Hedera (HBAR) on the Brink: 19% Price Plunge Looms if Critical Supports Fail

Hedera''s HBAR teeters at a make-or-break moment—technical charts flash warning signs as key demand zones threaten to collapse. A 19% freefall could trigger if bulls don''t defend these levels pronto.
Blood in the streets? Not yet. But crypto''s favorite ''enterprise blockchain'' is testing investor patience—again. When supports crack in this market, they shatter like a trader''s confidence after leverage gets liquidated.
Watch those order books closely. Either HBAR bounces hard here... or becomes another casualty in crypto''s endless cycle of hype and heartbreak. Just another Thursday in digital asset land.
HBAR Struggles to Regain Momentum
Hedera’s BBTrend is now at -1.2, recovering from -3.27 earlier today but still below the 2.63 seen two days ago.
The drop signals fading bullish momentum after a short-lived rally. HBAR may be shifting from a breakout attempt to a consolidation phase.
The quick bounce from deeper negative levels suggests some buyer support, but the overall trend remains weak.
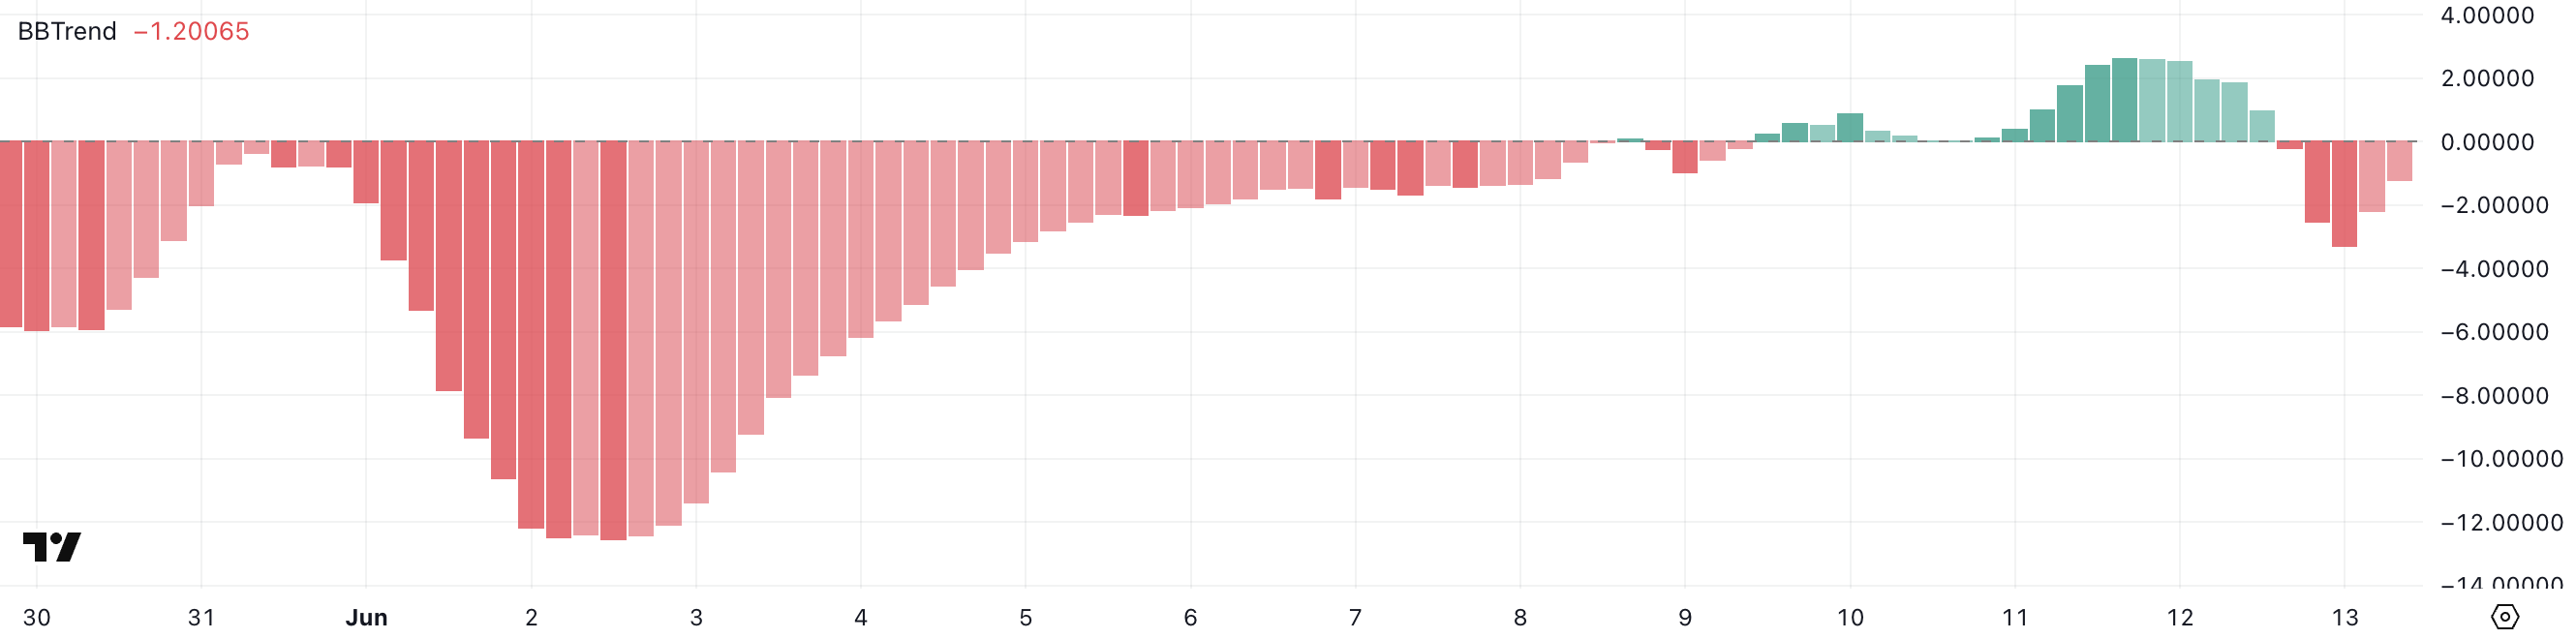
BBTrend, or Bollinger Band Trend, measures the directional strength and volatility of price movements relative to the Bollinger Bands.
Values above +1 typically indicate strong upward momentum, while readings below -1 suggest bearish pressure. With HBAR’s BBTrend hovering at -1.2, the signal leans bearish, but not deeply so—hinting that while selling pressure still dominates, it may be losing intensity.
If the BBTrend moves back toward neutral or flips positive, it could signal a shift toward recovery or renewed buying interest.
HBAR RSI Plunges Below 30: Oversold Signal Points to Possible Rebound
Hedera’s RSI has dropped sharply to 22.29, down from 61.99 just two days ago. This points to quickly increasing selling pressure.
The decline pushes HBAR DEEP into oversold territory, signaling an aggressive correction. While it may reflect panic selling, it could also open the door for a rebound if buyers step in.

RSI is a momentum indicator that tracks the speed and size of price changes on a scale from 0 to 100. Readings above 70 often mean an asset is overbought, while values below 30 suggest it’s oversold.
HBAR’s current RSI of 22.29 puts it well into oversold territory. If key support holds, this could limit further downside and signal a potential rebound.
Hedera Faces Breakdown Risk at $0.153
Hedera price is currently hovering just above a key support level at $0.153, a zone that has held in previous pullbacks.
However, if this support is tested and fails, Hedera could decline toward the next major support around $0.124.
Adding to the bearish outlook, HBAR’s EMA lines recently formed a death cross—a technical signal that typically indicates downward momentum and potential for further losses.

That said, a reversal in momentum could quickly change the outlook. If bulls regain control and push HBAR above the immediate resistance at $0.168, the token could then test higher levels at $0.175 and even $0.183 if the uptrend accelerates.
These resistance zones have historically acted as inflection points and WOULD need strong volume to be broken decisively.
Whether HBAR breaks down or rebounds will likely depend on how it behaves around the $0.153 level in the coming sessions.
