Bitcoin (BTC) Faces Sharp Spot Outflows as Middle East Tensions Escalate – A Buying Opportunity?

Bitcoin''s liquidity takes a hit as geopolitical risks trigger capital flight. Here''s why smart money sees blood in the water.
The Exodus Accelerates
BTC spot markets bled out this week as rockets flew in the Levant. Trading desks reported order books thinning faster than a hedge fund''s ethics.
Flight to Safety or FUD Trap?
While traditional markets wobble, crypto''s proving its crisis mettle. Remember: every panic sell creates a discount for diamond hands.
Wall Street''s still trying to price oil risk – meanwhile, Bitcoin''s plumbing works just fine. The network doesn''t care about border disputes.
Bitcoin Faces More Losses as Indicators Turn Red
Over the past 24 hours, BTC has declined by almost 5%, hovering around the $105,000 mark. The heightened risk-off sentiment is driving capital out of the spot market, signaling waning confidence among traders and institutional participants.
On the daily chart, BTC’s Relative Strength Index (RSI) has broken below the 50-neutral levels, confirming the rapidly declining buying momentum. As of this writing, this indicator is at 48.85, facing downward.
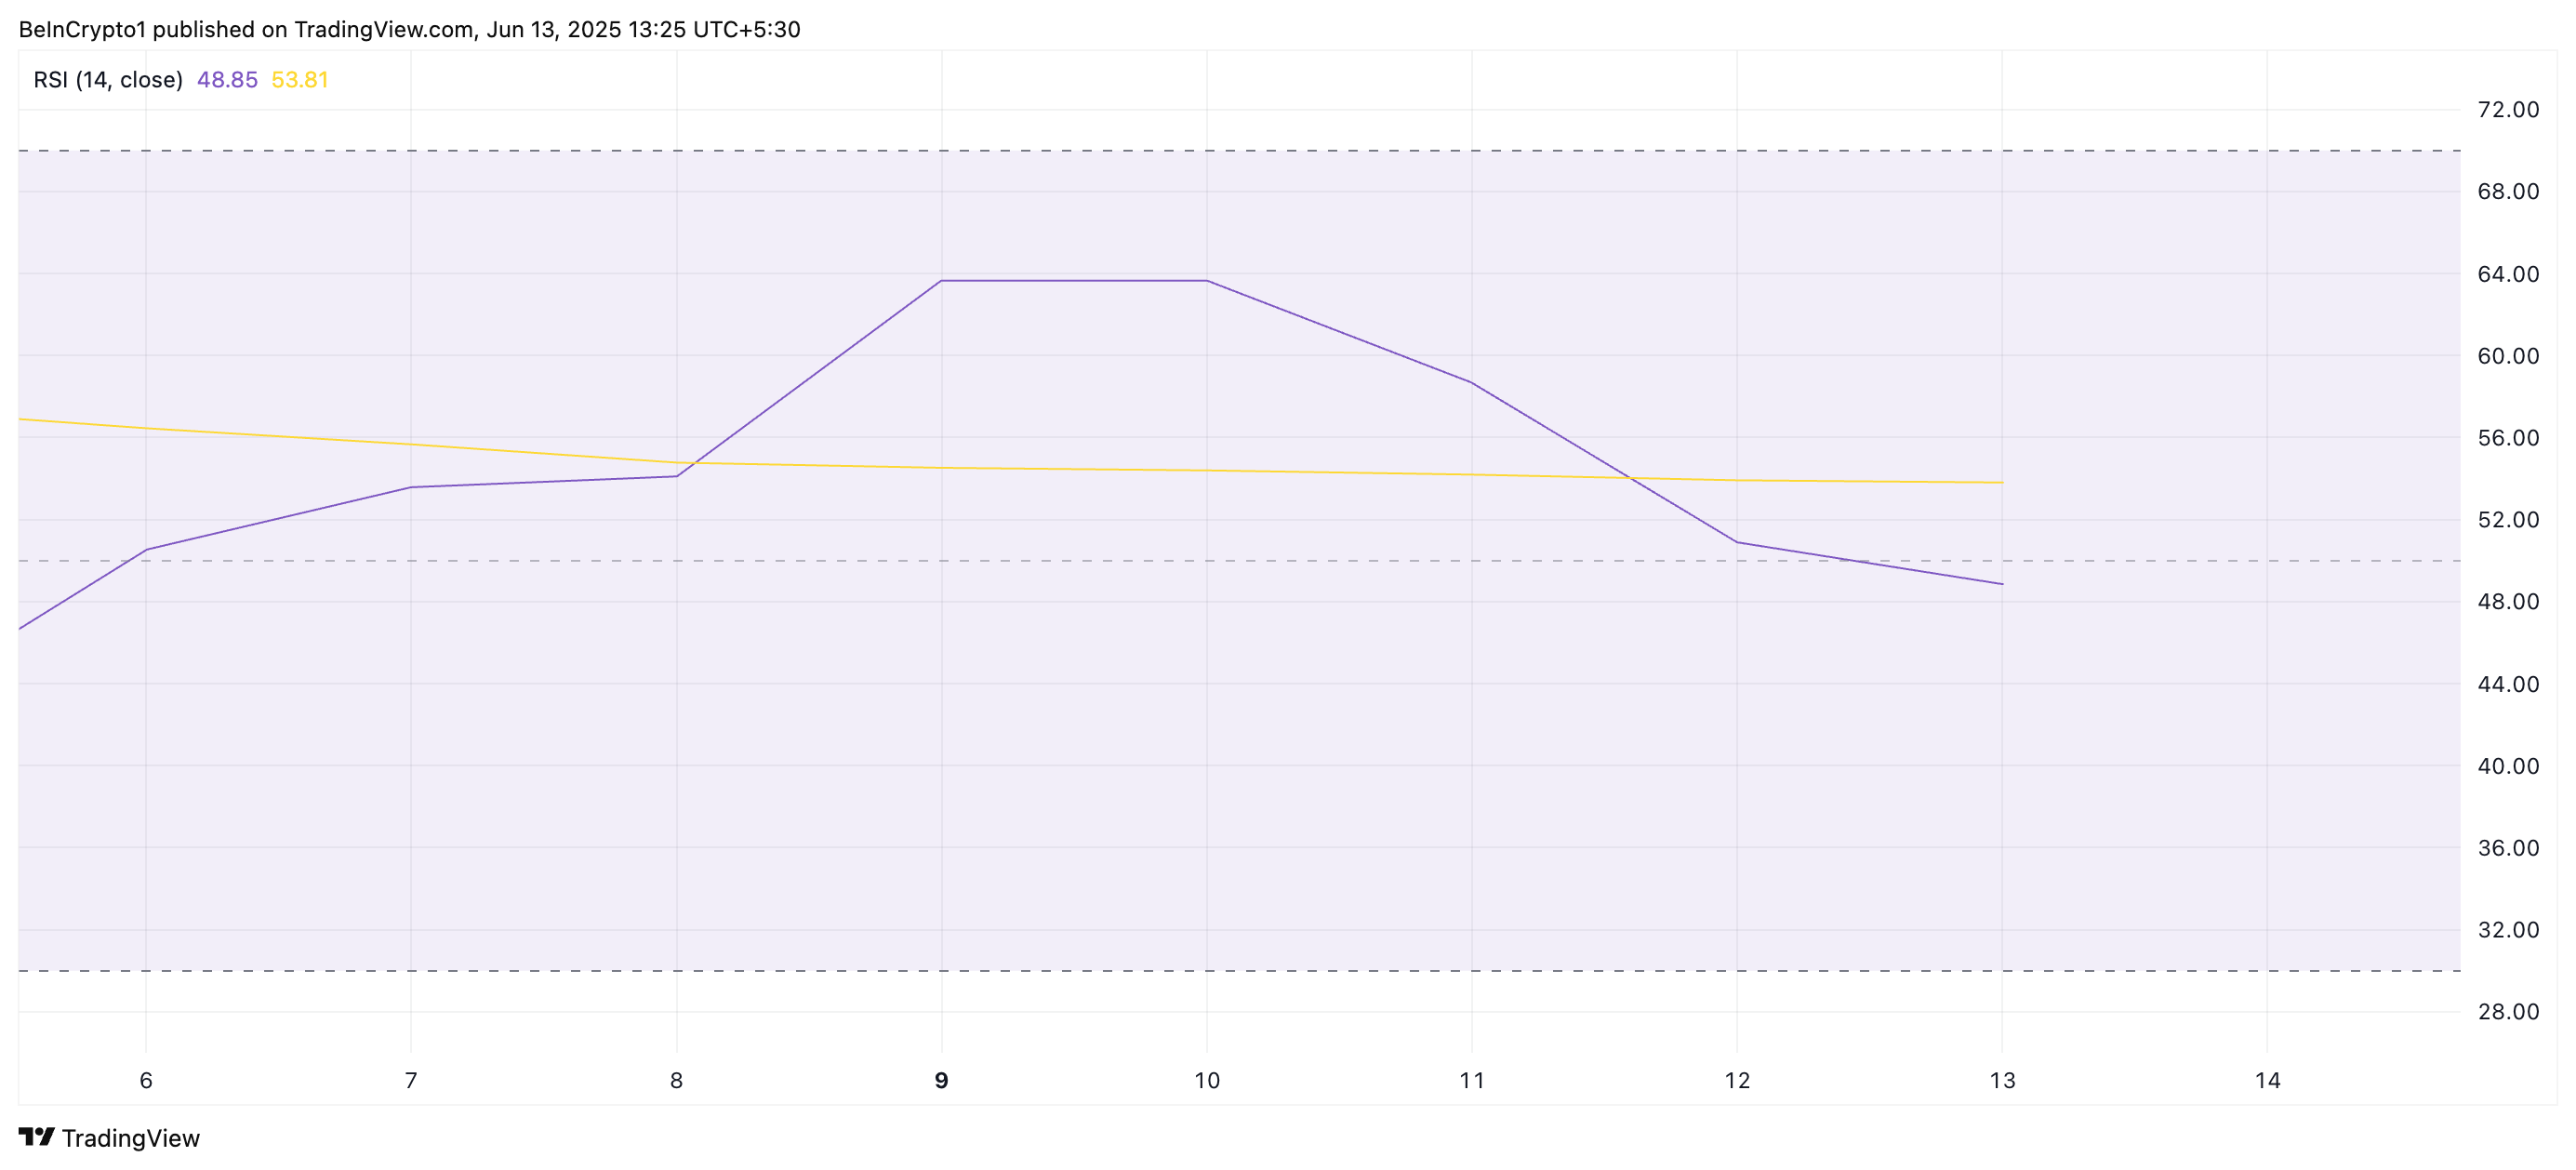
The RSI indicator measures an asset’s overbought and oversold market conditions. It ranges between 0 and 100, with values above 70 suggesting that the asset is overbought and due for a price decline. Converesly, values under 30 indicate that the asset is oversold and may witness a rebound.
BTC’s current RSI reading reflects the weakening bullish momentum and hints at the likelihood of further price dips in the NEAR term.
Moreover, the setup of the coin’s Moving Average Convergence Divergence (MACD) supports this bearish outlook. As of this writing, BTC’s MACD line (blue) rests below its signal line (orange), a trend that indicates the dominance of sell-side pressure.

An asset’s MACD indicator identifies trends and momentum in its price movement. It helps traders spot potential buy or sell signals through crossovers between the MACD and signal lines. When set up this way, selling activity dominates the market, hinting at further price drops.
BTC Bears Tighten Grip as Price Slips
BTC currently trades at $105,304, marking its third consecutive red candle on the daily chart. With demand for the coin continuing to wane, it risks a drop toward the support floor at $103,061. If the bulls fail to defend this level, a deeper decline to $101,610 could occur.

However, if new demand emerges, BTC may break out of its downtrend and rally toward the $106,548 resistance level.
