Pi Network Stalls Below Critical Resistance – Are Buyers Losing Faith?

Pi Network''s price action hits a wall as traders retreat from key resistance levels. The crypto''s stagnation sparks debate: temporary consolidation or bearish reversal?
The Standstill: Despite bullish whispers in crypto circles, Pi fails to break through its ceiling. No fancy charts needed—the numbers tell the story of a market in waiting mode.
Traders on the Fence: Volume dries up like a desert oasis as speculators watch from the sidelines. Even the usual moonboys are suspiciously quiet on socials.
Reality Check: Another ''next Bitcoin'' stuck in purgatory while institutional money flows elsewhere. Some things never change in crypto-land.
Pi Network Struggles to Reignite Momentum
Technical indicators for Pi suggest a pause in market activity, with buyers and sellers refraining from making significant moves. This has led to a lackluster performance over the past week, keeping the token in a sideways trend.
For example, PI’s Relative Strength Index (RSI) has remained flat for nearly a week, highlighting the lack of momentum in the market. At press time, this momentum indicator stands at 40.96.
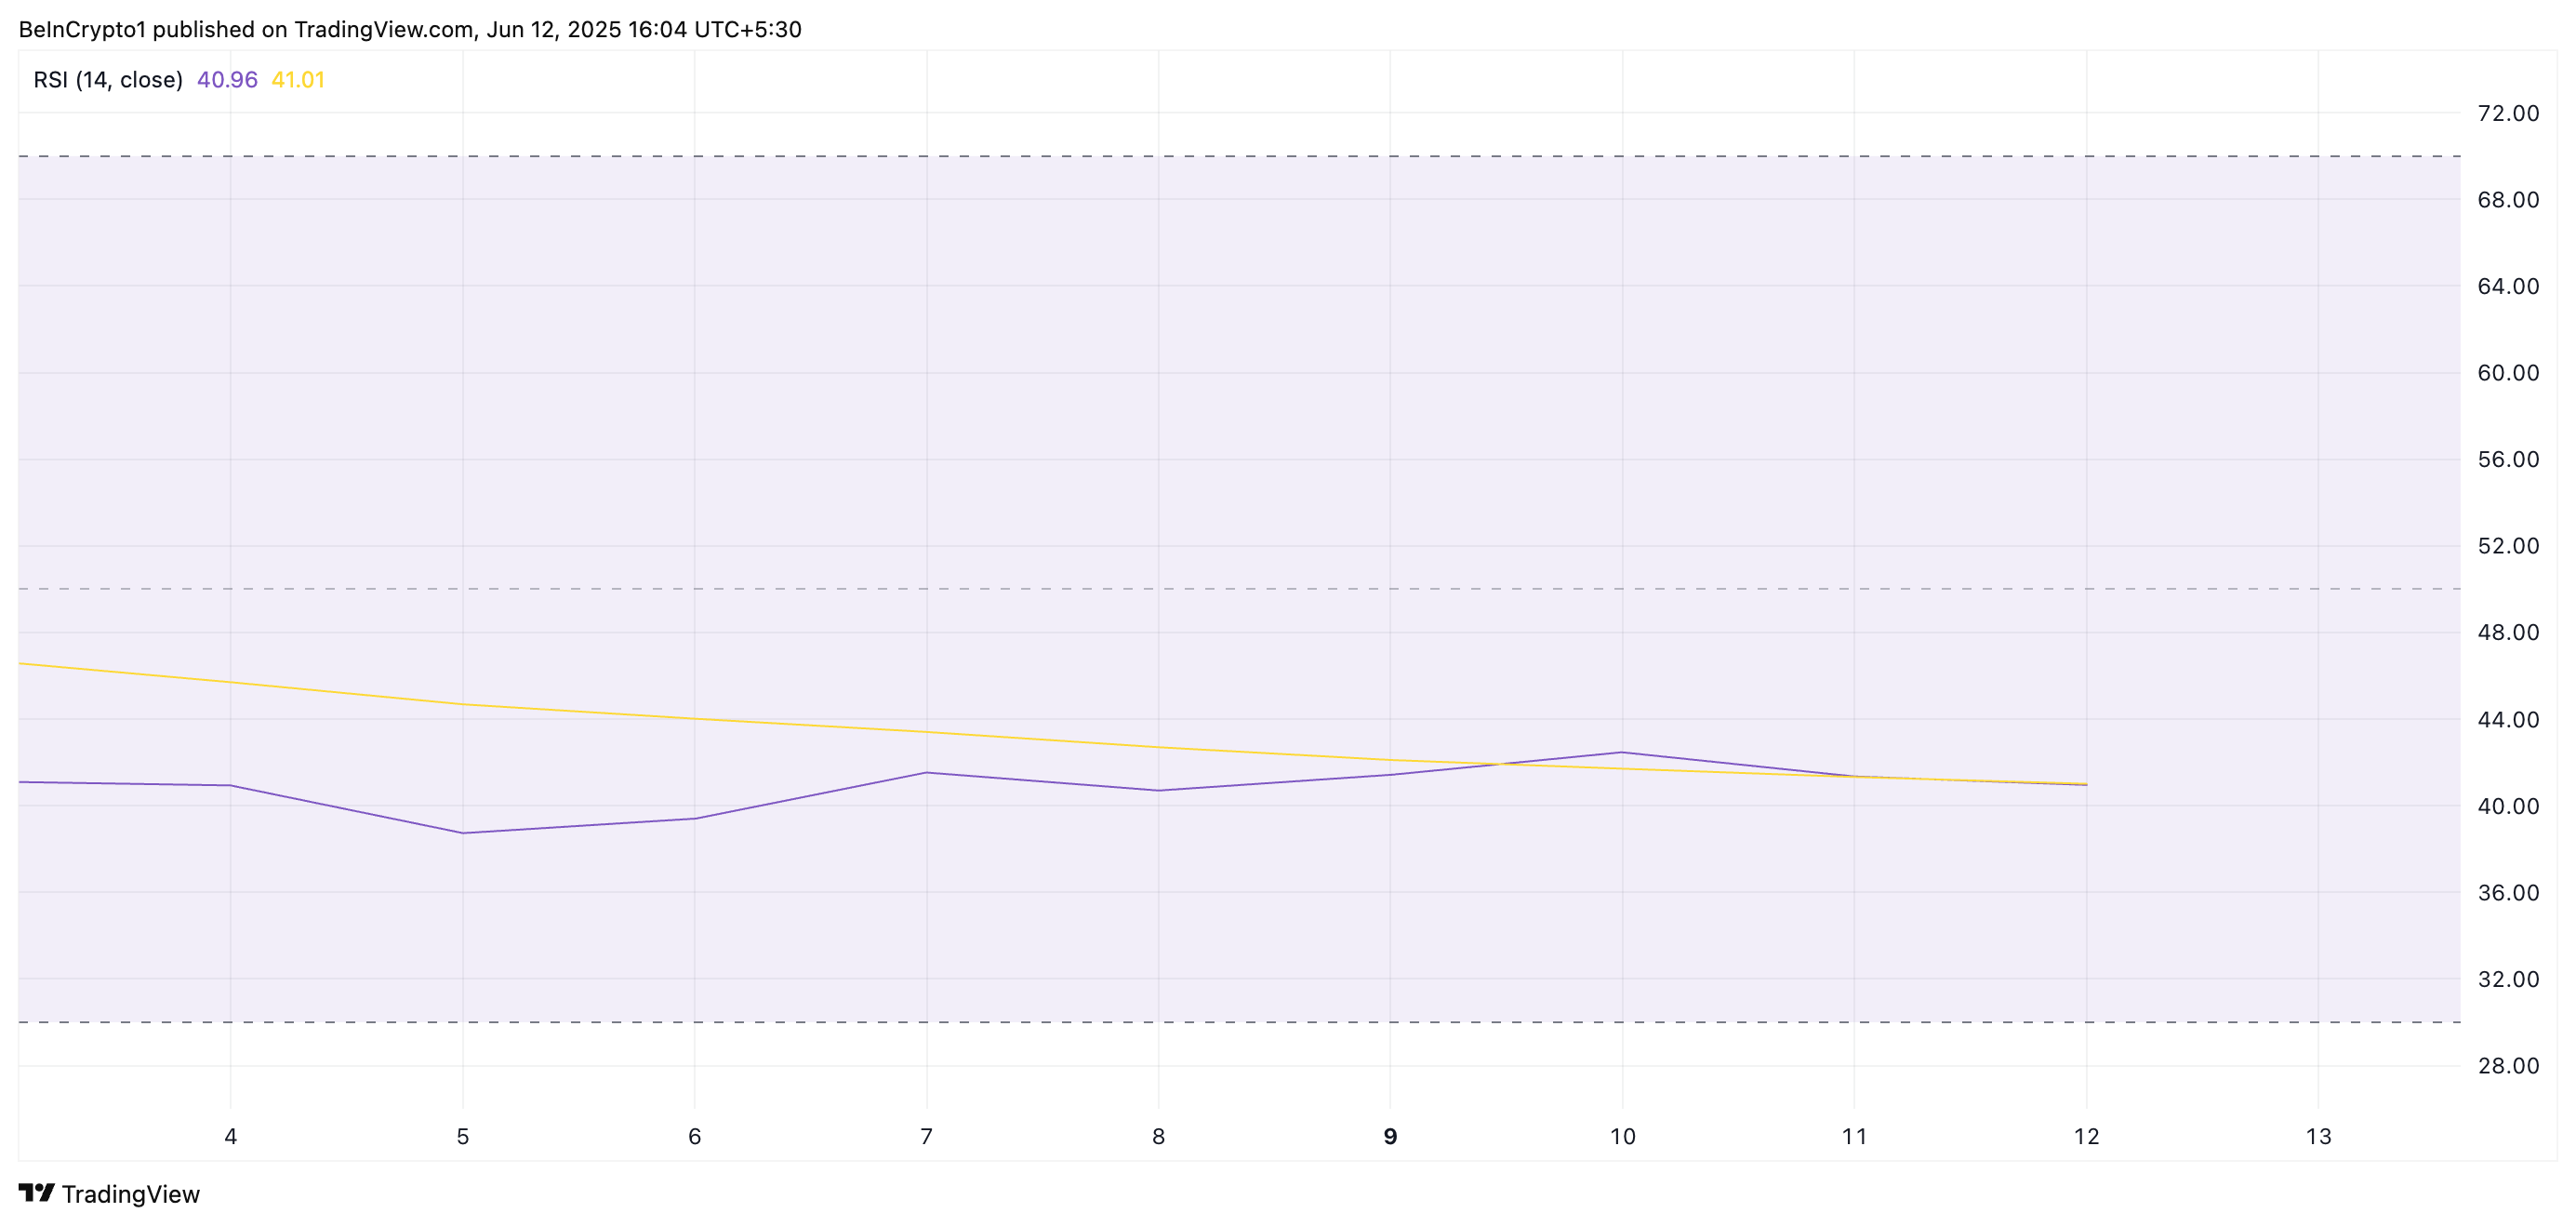
The RSI indicator measures an asset’s overbought and oversold market conditions. It ranges between 0 and 100. Values above 70 suggest that the asset is overbought and due for a price decline, while values under 30 indicate that the asset is oversold and may witness a rebound.
When an asset’s RSI flattens, it indicates little change in buying or selling momentum, suggesting market indecision. It highlights a balance between bullish and bearish forces, with neither side dominating price action.
However, the bears still appear to hold the upper hand despite this. At the time of writing, PI trades below its 20-day Exponential Moving Average (EMA), a key indicator of short-term trend direction.

The 20-day EMA measures an asset’s average price over the past 20 trading days, giving more weight to recent prices. PI’s continued position beneath this key moving average suggests that buyer activity remains subdued. If sentiment fails to improve, the token is vulnerable to further downside or extended consolidation.
PI Teeters at $0.63 as Bears Eye Breakdown Toward $0.57
Currently, PI trades at $0.62. A resurgence in selloffs could trigger a break below its price range and a decline toward $0.60.If this support floor fails to hold, the price dip could reach $0.57.
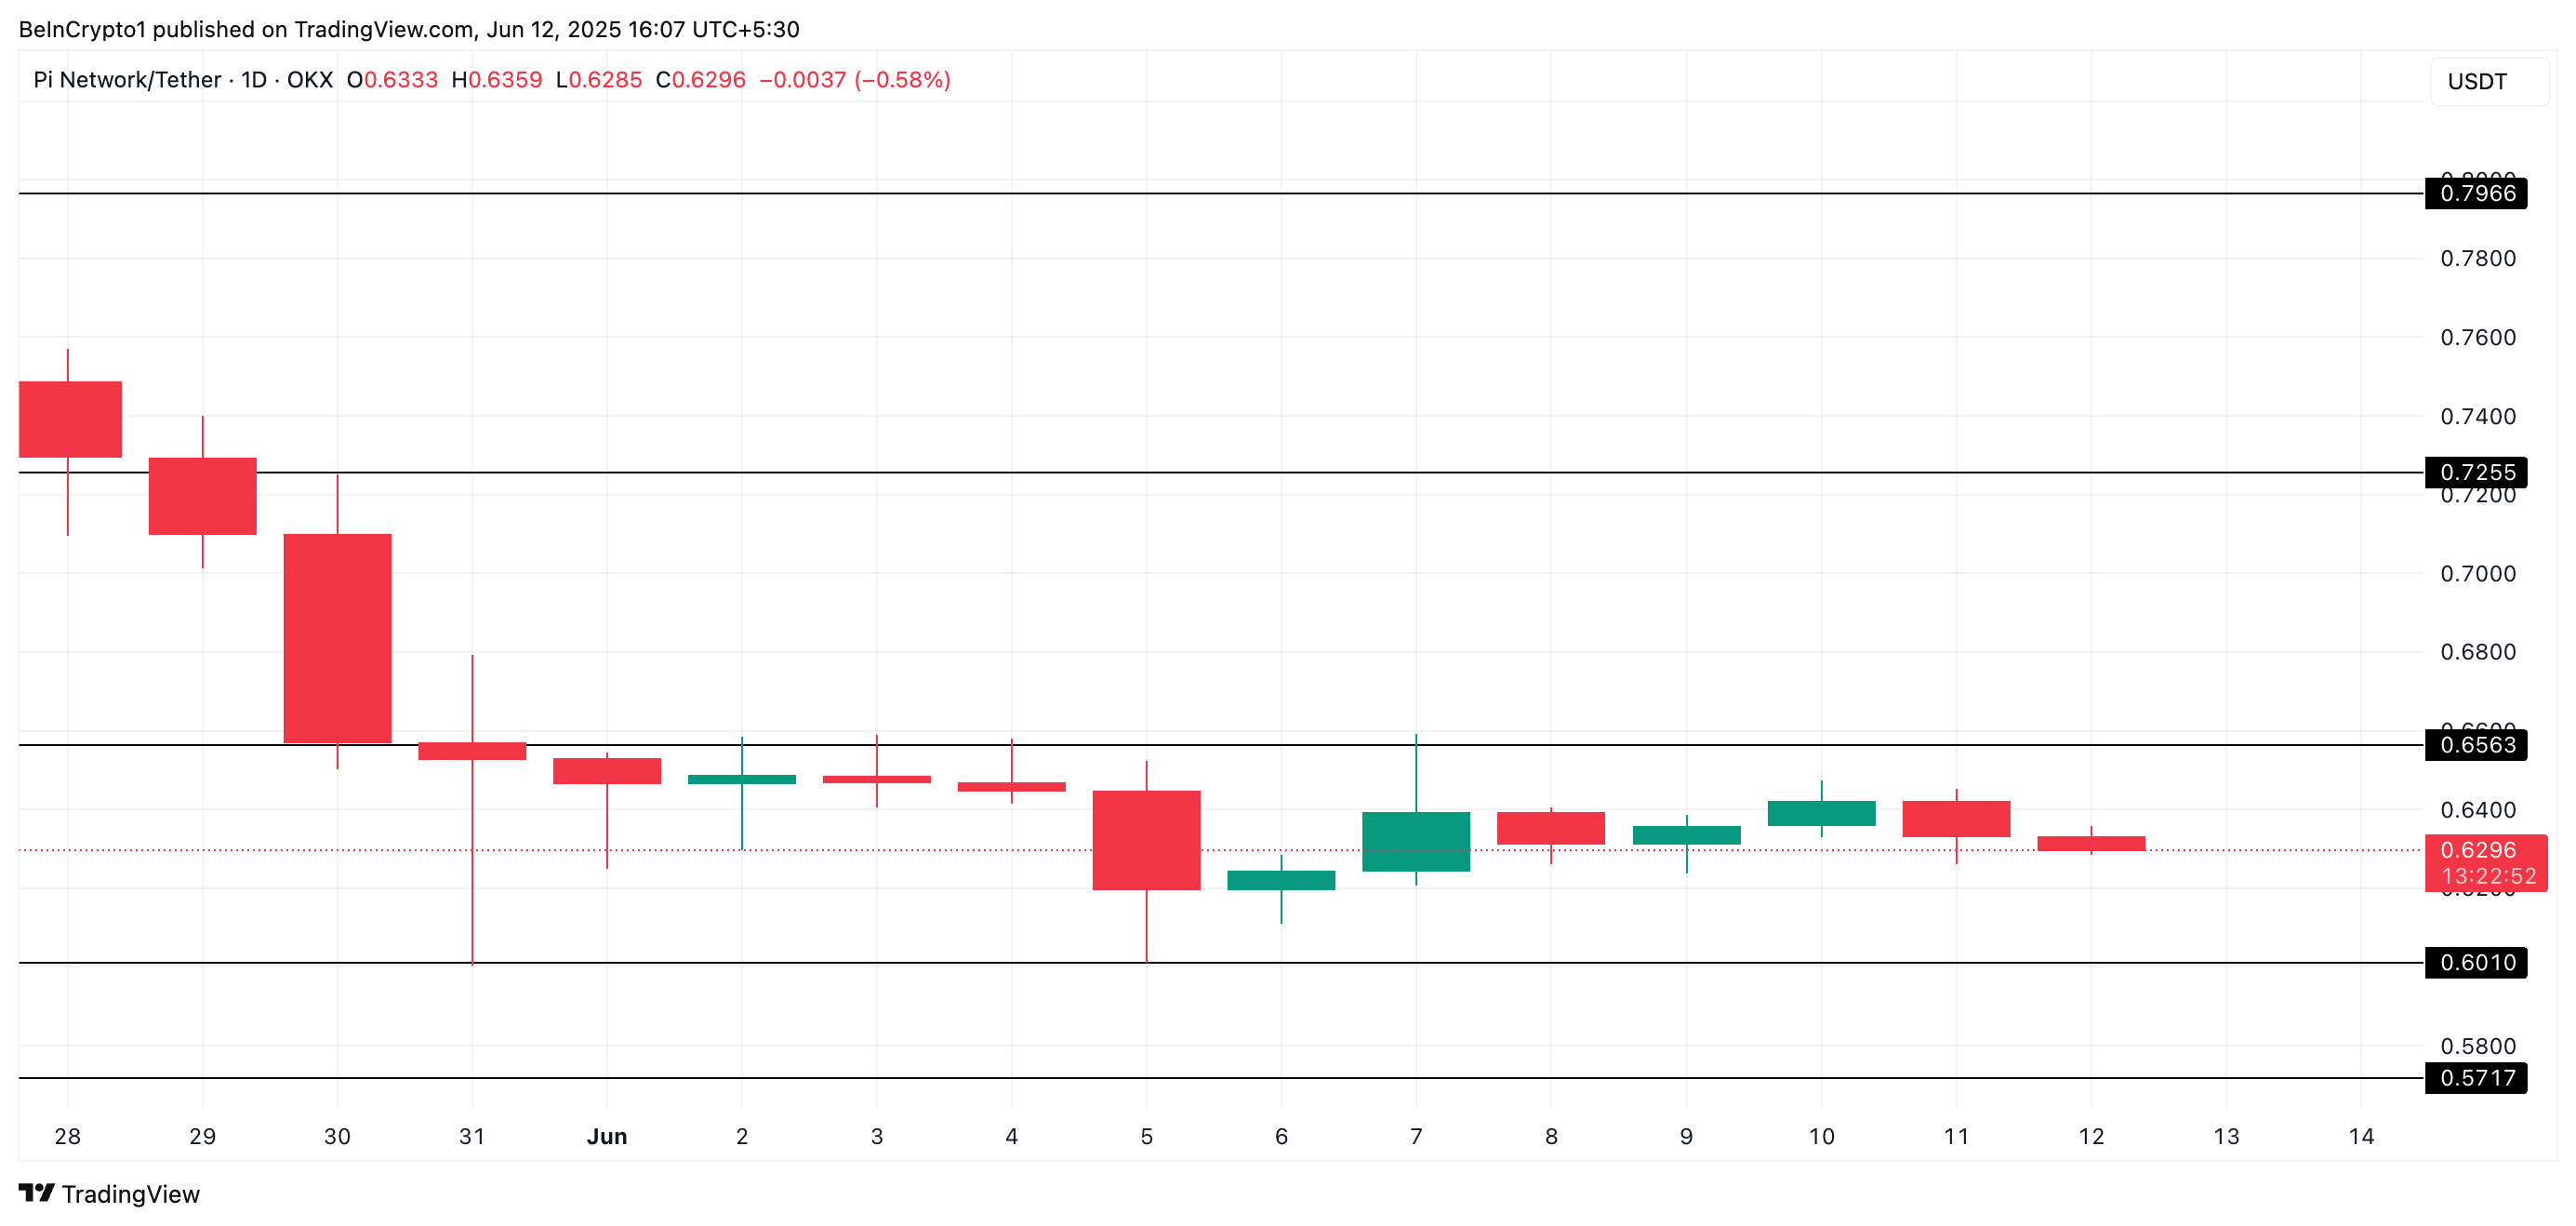
However, new demand entering the market could drive PI Network’s price toward $0.65.
