Freysa AI Defies Market Downtrend With 15% Surge – Top Meme Coins to Track Now

Freysa AI just pulled off a gravity-defying act—spiking 15% while the broader crypto market whimpered in bearish territory. Meme coins aren’t just surviving; they’re staging a rebellion.
Here’s what’s hot (and what’s not) in today’s circus.
### The Underdog Rally
While ‘serious’ investors panic-sell BTC, Freysa’s rally proves meme coins still move faster than a hedge fund’s excuse for missing a trade. The 15% pump? Pure retail FOMO—no fundamentals required.
### Today’s Meme Coin Watchlist
Forget blue chips. These volatile gems are where the action is—just don’t blame us when the leverage traders get liquidated by a viral tweet.
### The Punchline
Meme coins: the only ‘asset class’ where a dog wearing sunglasses can outpace Wall Street’s ‘smart money.’ Enjoy the ride—until the music stops.
SPX6900 (SPX)
- Launch Date – August 2023
- Total Circulating Supply – 930.99 Million SPX
- Maximum Supply – 1 Billion SPX
- Fully Diluted Valuation (FDV) – $1.59 Billion
- Contract Address – 0xe0f63a424a4439cbe457d80e4f4b51ad25b2c56c
SPX has surged by 50% in the past week, with a 7% increase in the last 24 hours. Trading at $1.70, the meme coin is positioning itself to breach the $1.77 resistance. If successful, this WOULD mark a new all-time high (ATH) and further extend its rally toward $1.85.
SPX is showing significant upward momentum, with no immediate resistance holding it back. The coin is likely to breach $1.77 soon, possibly within the week. This would establish a new ATH, the first for SPX since January, continuing its bullish trend.

However, if investors decide to sell, SPX could lose the support at $1.55. This would lead to a potential drop towards $1.20, negating the current bullish outlook. A significant selling spree could trigger a major decline, reversing the gains made over the past few days.
Freysa AI (FAI)
- Launch Date – December 2024
- Total Circulating Supply – 8.18 Billion FAI
- Maximum Supply – 8.18 Billion FAI
- Fully Diluted Valuation (FDV) – $189.46 Million
- Contract Address – 0xb33ff54b9f7242ef1593d2c9bcd8f9df46c77935
FAI has seen a 15% rise in the last 24 hours, currently trading at $0.0231. This upward momentum has brought the meme coin close to the $0.0243 resistance. If FAI can break through this level, it may continue its bullish trend, aiming for higher price targets.
The meme coin is comfortably above its 50-day EMA, suggesting the bullish momentum could remain intact. If FAI successfully breaches the $0.0243 resistance level, it may continue its climb, targeting $0.0261. This would mark a key technical breakout and further validate the ongoing positive trend for the token.
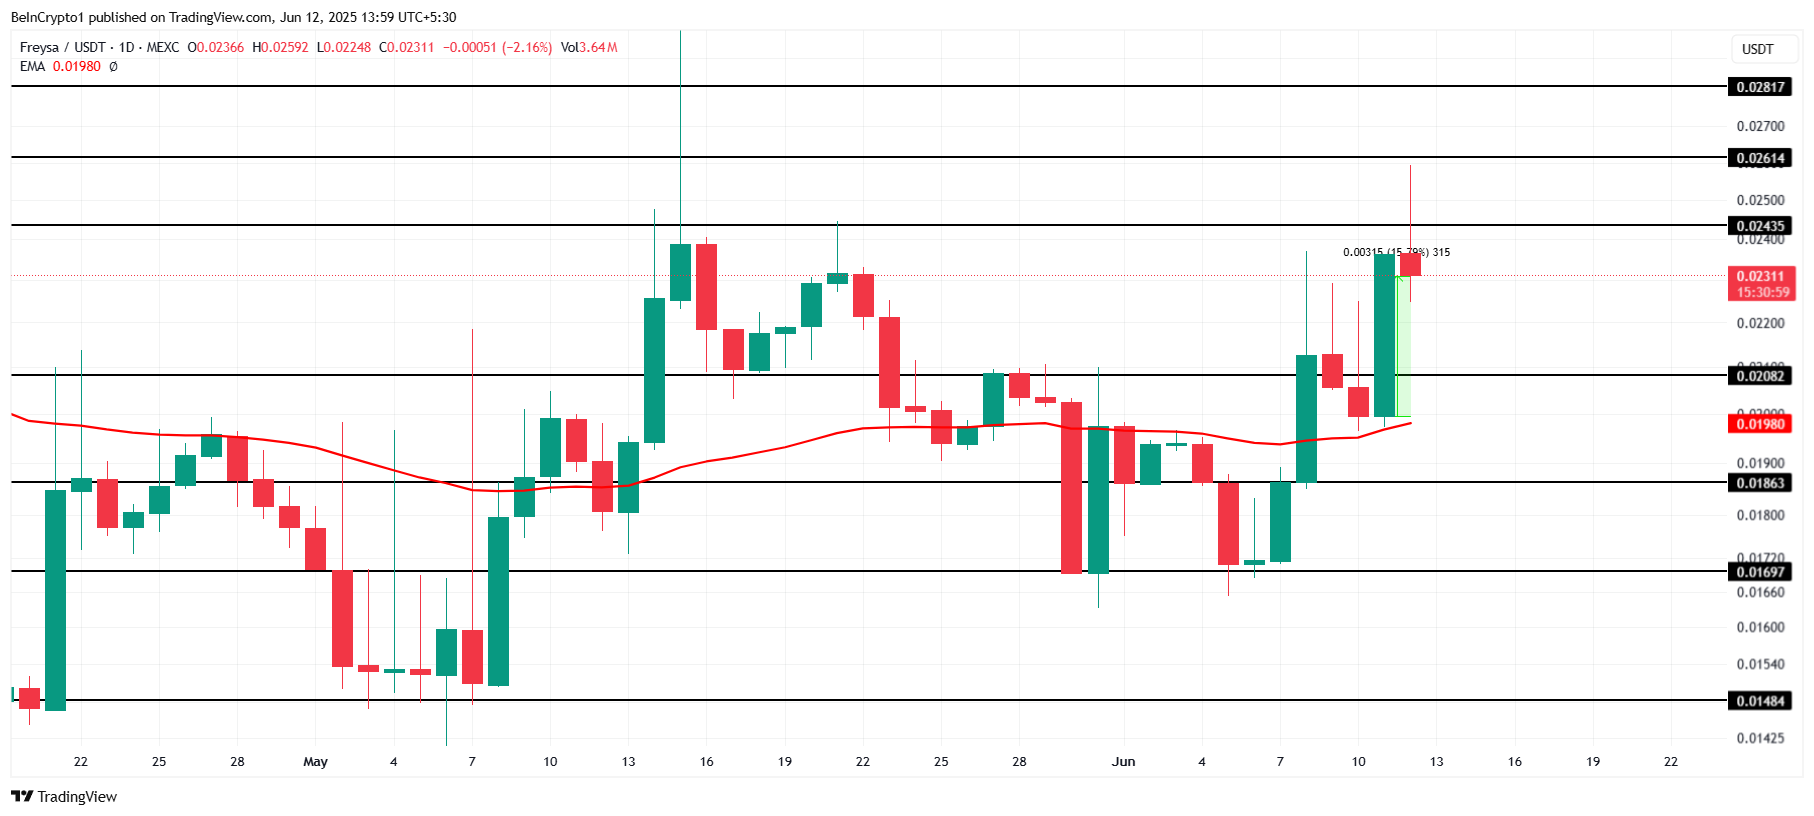
However, if FAI fails to break the $0.0243 resistance once again, it could face a decline. Falling below this level might lead to a drop toward $0.0208. Such a retreat would invalidate the current bullish outlook, signaling potential price weakness for the meme coin.
Small Cap Corner – Siren (SIREN)
- Launch Date – February 2025
- Total Circulating Supply – 731.55 Million SIREN
- Maximum Supply – 1 Billion SIREN
- Fully Diluted Valuation (FDV) – $111.36 Million
- Contract Address – 0x997a58129890bbda032231a52ed1ddc845fc18e1
SIREN experienced a whiplash over the last 24 hours but managed to recover, posting a nearly 10% rise from the previous day’s lows. Trading at $0.150, the meme coin is poised for further gains. Its strong recovery suggests it may continue rising as bullish momentum builds.
The $0.156 resistance has plagued SIREN for over two weeks. However, the Bollinger Bands are converging, signaling a potential squeeze release. This could result in a surge in volatility, and if the momentum remains bullish, SIREN might break through the $0.156 barrier and climb toward $0.172.

If SIREN fails to breach the $0.156 resistance, history could repeat itself, causing a drop back to $0.139. Such a pullback would invalidate the bullish outlook, erasing the recent gains. The failure to break this resistance level may point to ongoing price struggles.

Log in to Reply
Log in to comment your thoughtsComments
Related Articles
|Square
Get the BTCC app to start your crypto journey
Get started today Scan to join our 100M+ users