Pi Network’s Freefall: PI Crashes to 7-Day Low Amid Relentless Sell-Off

Another rough week for Pi Network holders as the project’s token nosedives—proving once again that ’free crypto’ isn’t always free.
Market watchers shrug as Pi’s latest plunge follows the same script: hype-fueled peaks, then gravity-defying drops. No white knights in sight—just bagholders left counting paper losses.
Bonus cynicism: At least traditional pump-and-dump schemes come with the courtesy of a roadmap.
PI’s Outlook Worsens as Bearish Trend Deepens
The global cryptocurrency market capitalization has dropped by over 5% in the past seven days, shedding over $170 billion. The widespread pullback has shaken investor confidence, triggering fresh PI selloffs over the past few days.
The strengthening sell-side pressure is evident in PI’s BBTrend indicator, which has continued to print red histogram bars, a clear signal of mounting bearish momentum. As of this writing, the indicator sits at -4.52.
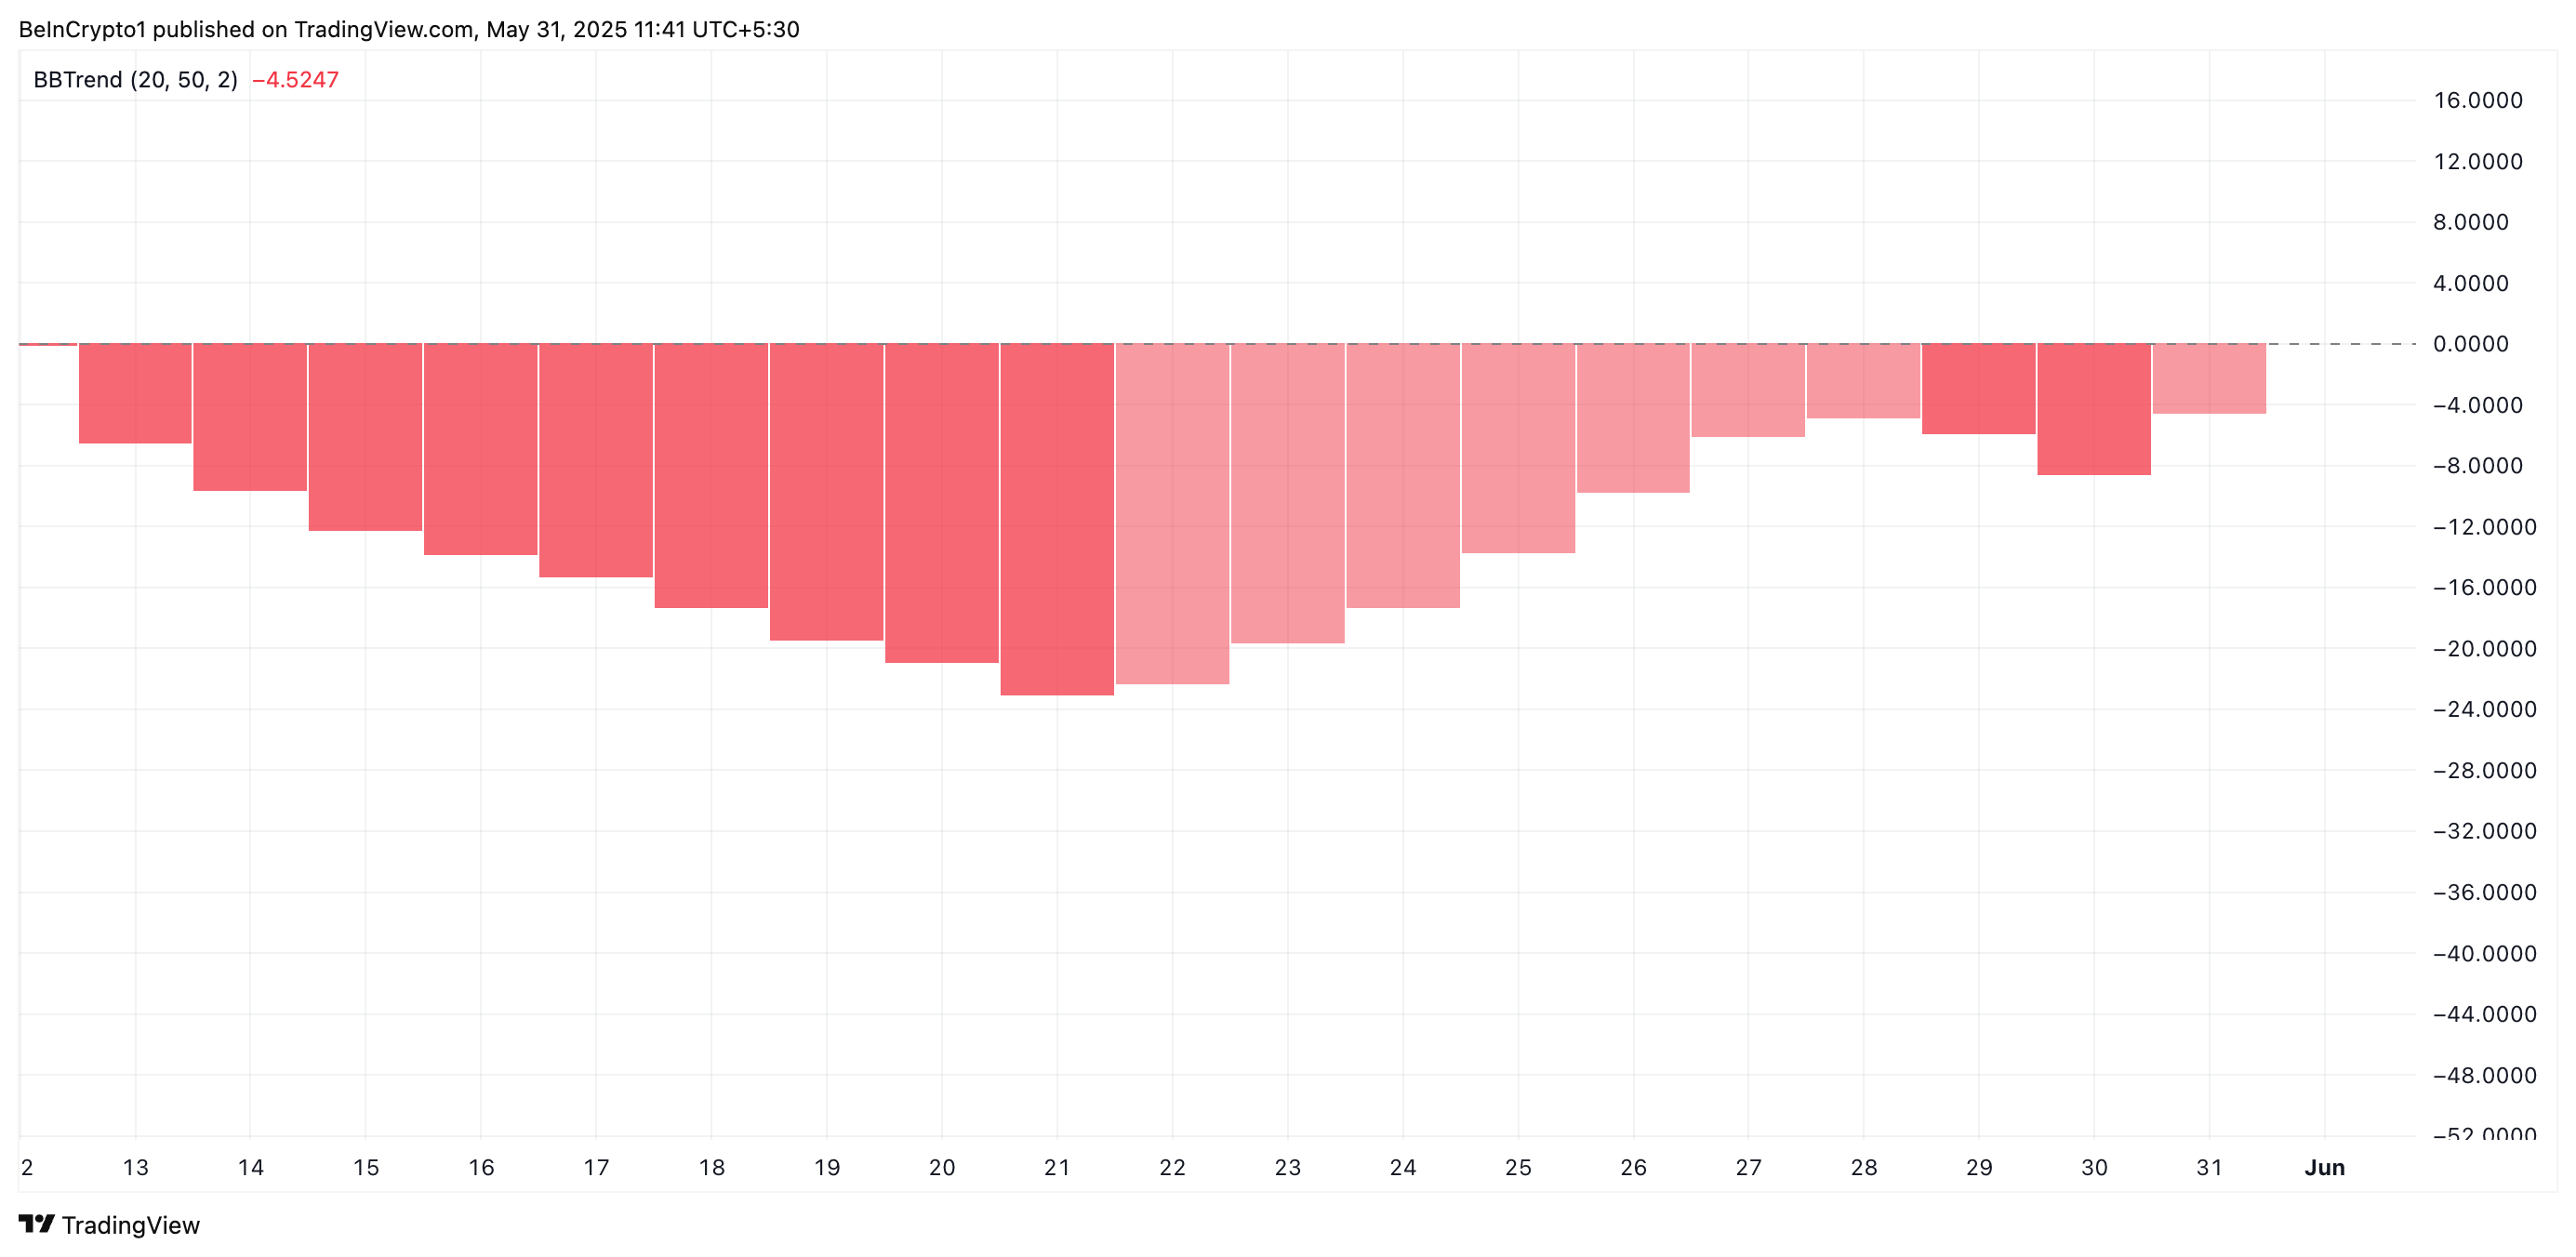
The BBTrend measures the strength and direction of a trend based on the expansion and contraction of Bollinger Bands. When BBTrend values are positive, it typically signals a strong uptrend, while negative values indicate increasing bearish momentum.
PI’s persistent negative BBTrend suggests that its price consistently closes NEAR the lower Bollinger Band. This trend indicates sustained selling activity and hints at the potential for a sustained price decline.
Further, PI’s Smart Money Index (SMI) has fallen over the past few days, signaling an exit of “smart money” or institutional-grade investors. This is often considered a leading indicator of deeper price declines, as it suggests reduced confidence from these key investors.
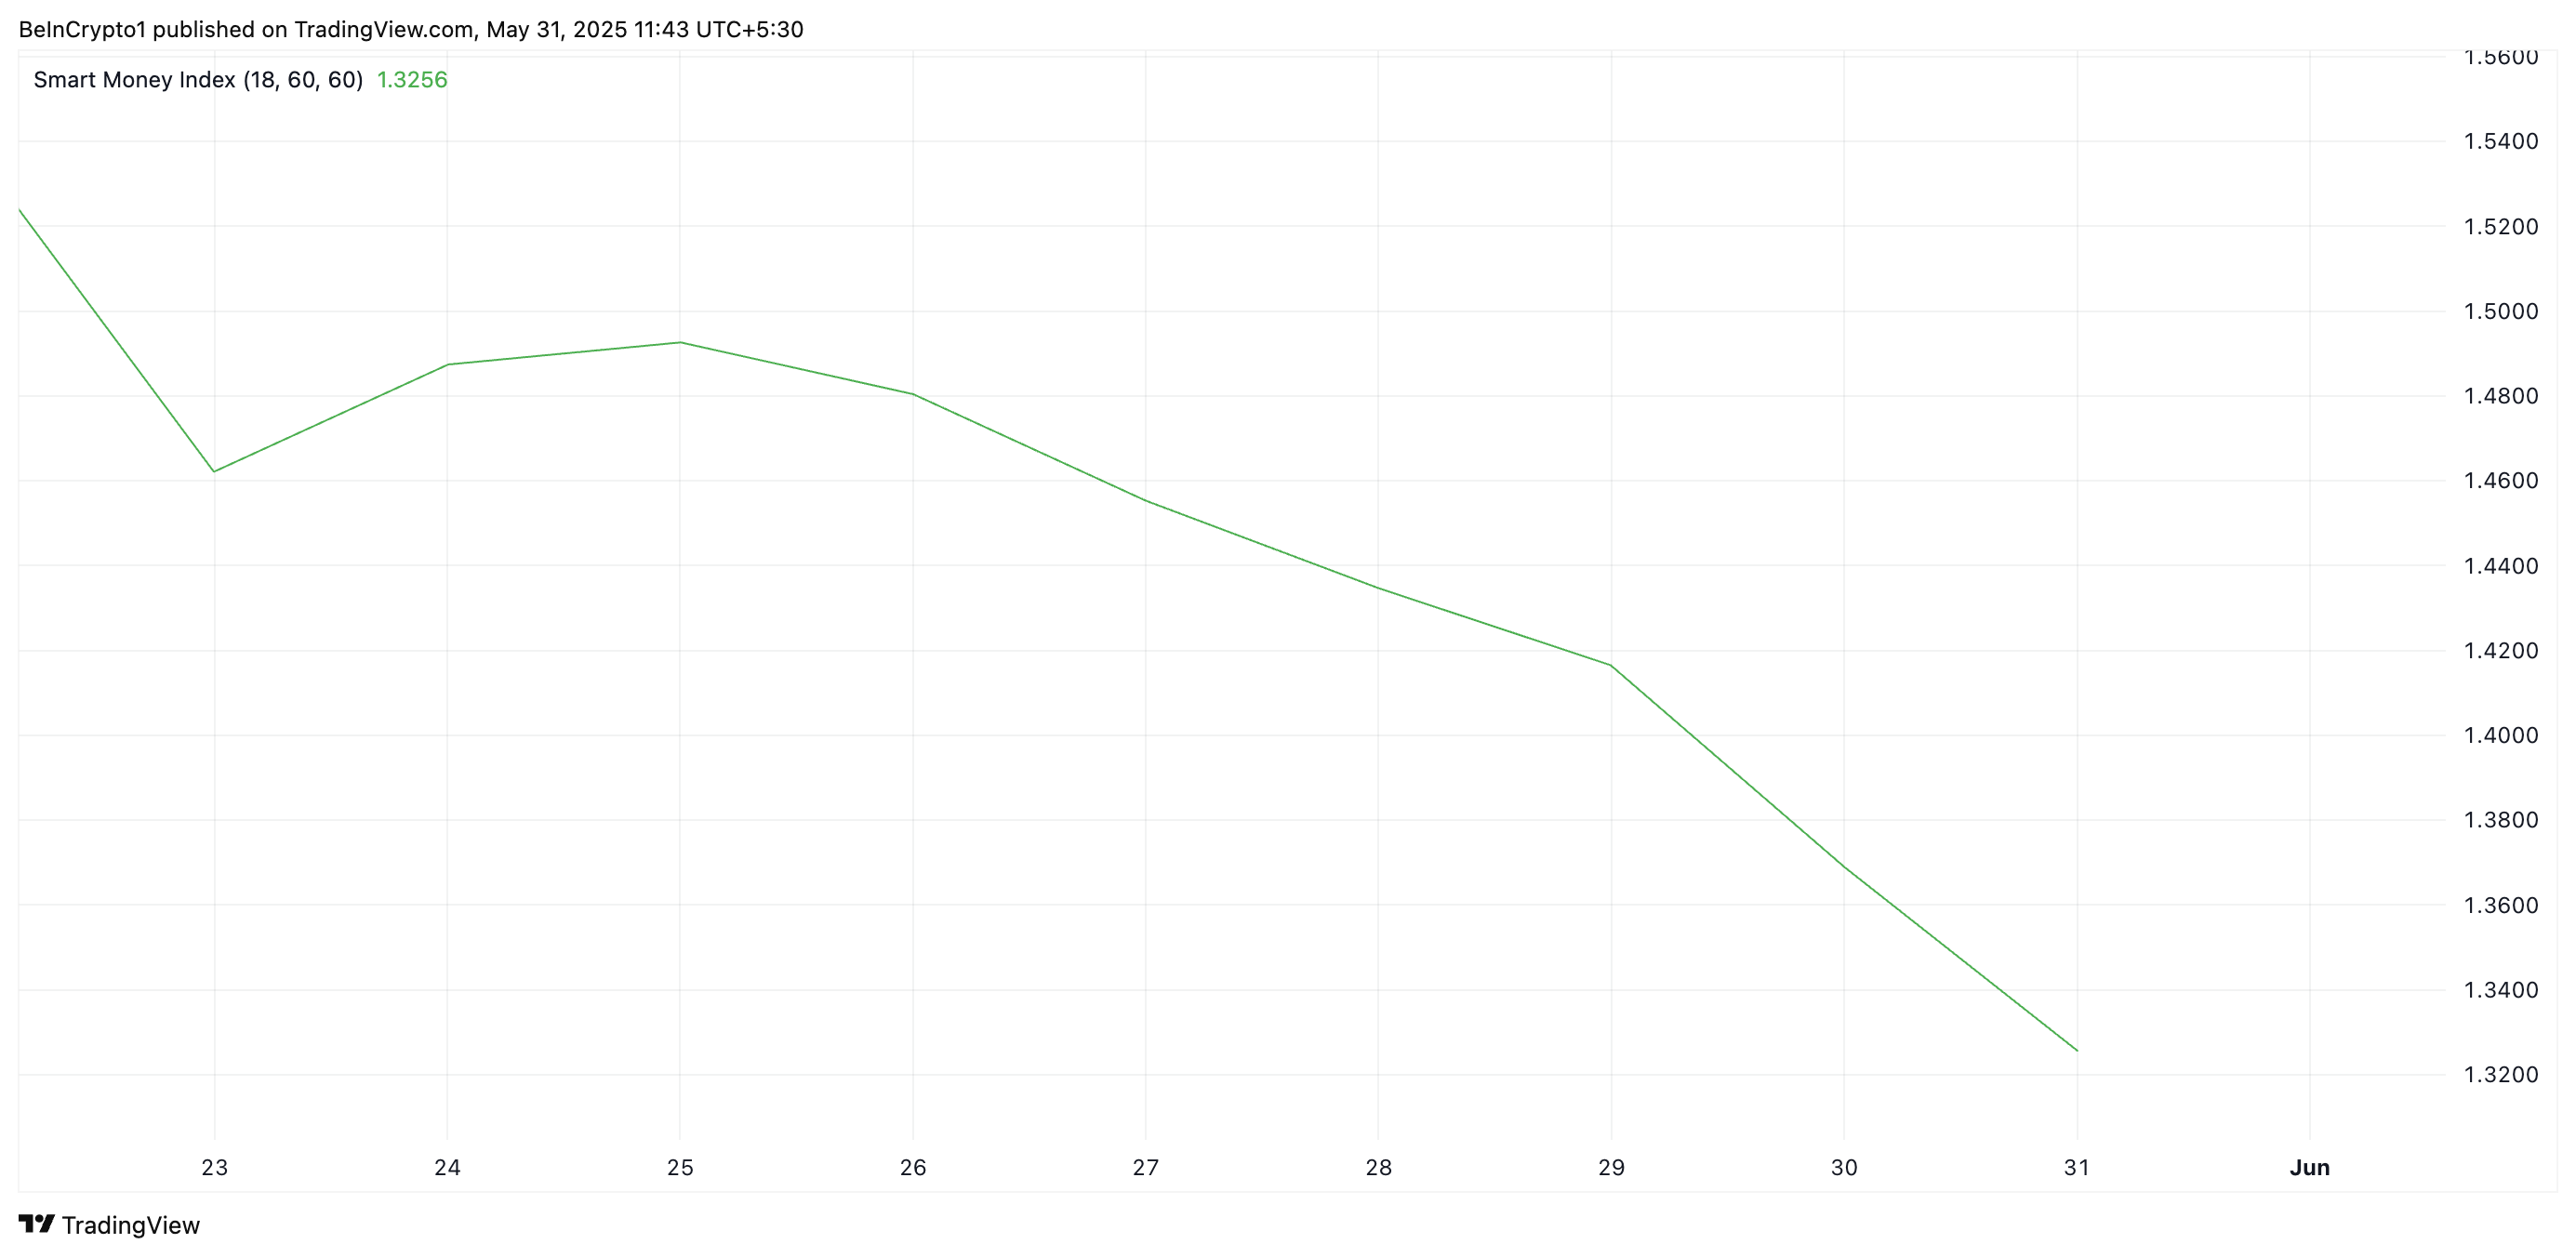
An asset’s SMI tracks the activity of institutional investors by analyzing market behavior during the first and last hours of trading. When it rises, these investors are increasing their buying activity, indicating the likelihood of an extended rally.
Conversely, as with PI, when it falls, it indicates that institutional demand for the asset is weakening, signalling potential for further downside.
PI Teeters Near Key Support—Will Bulls Hold the Line at $0.55?
PI’s climbing selling activity suggests that the token could be vulnerable to further losses in the short term. If selloffs continue, the altcoin risks breaking below the critical support formed at $0.55.
If the bulls fail to defend this support floor, Pi could revisit its all-time low of $0.40.
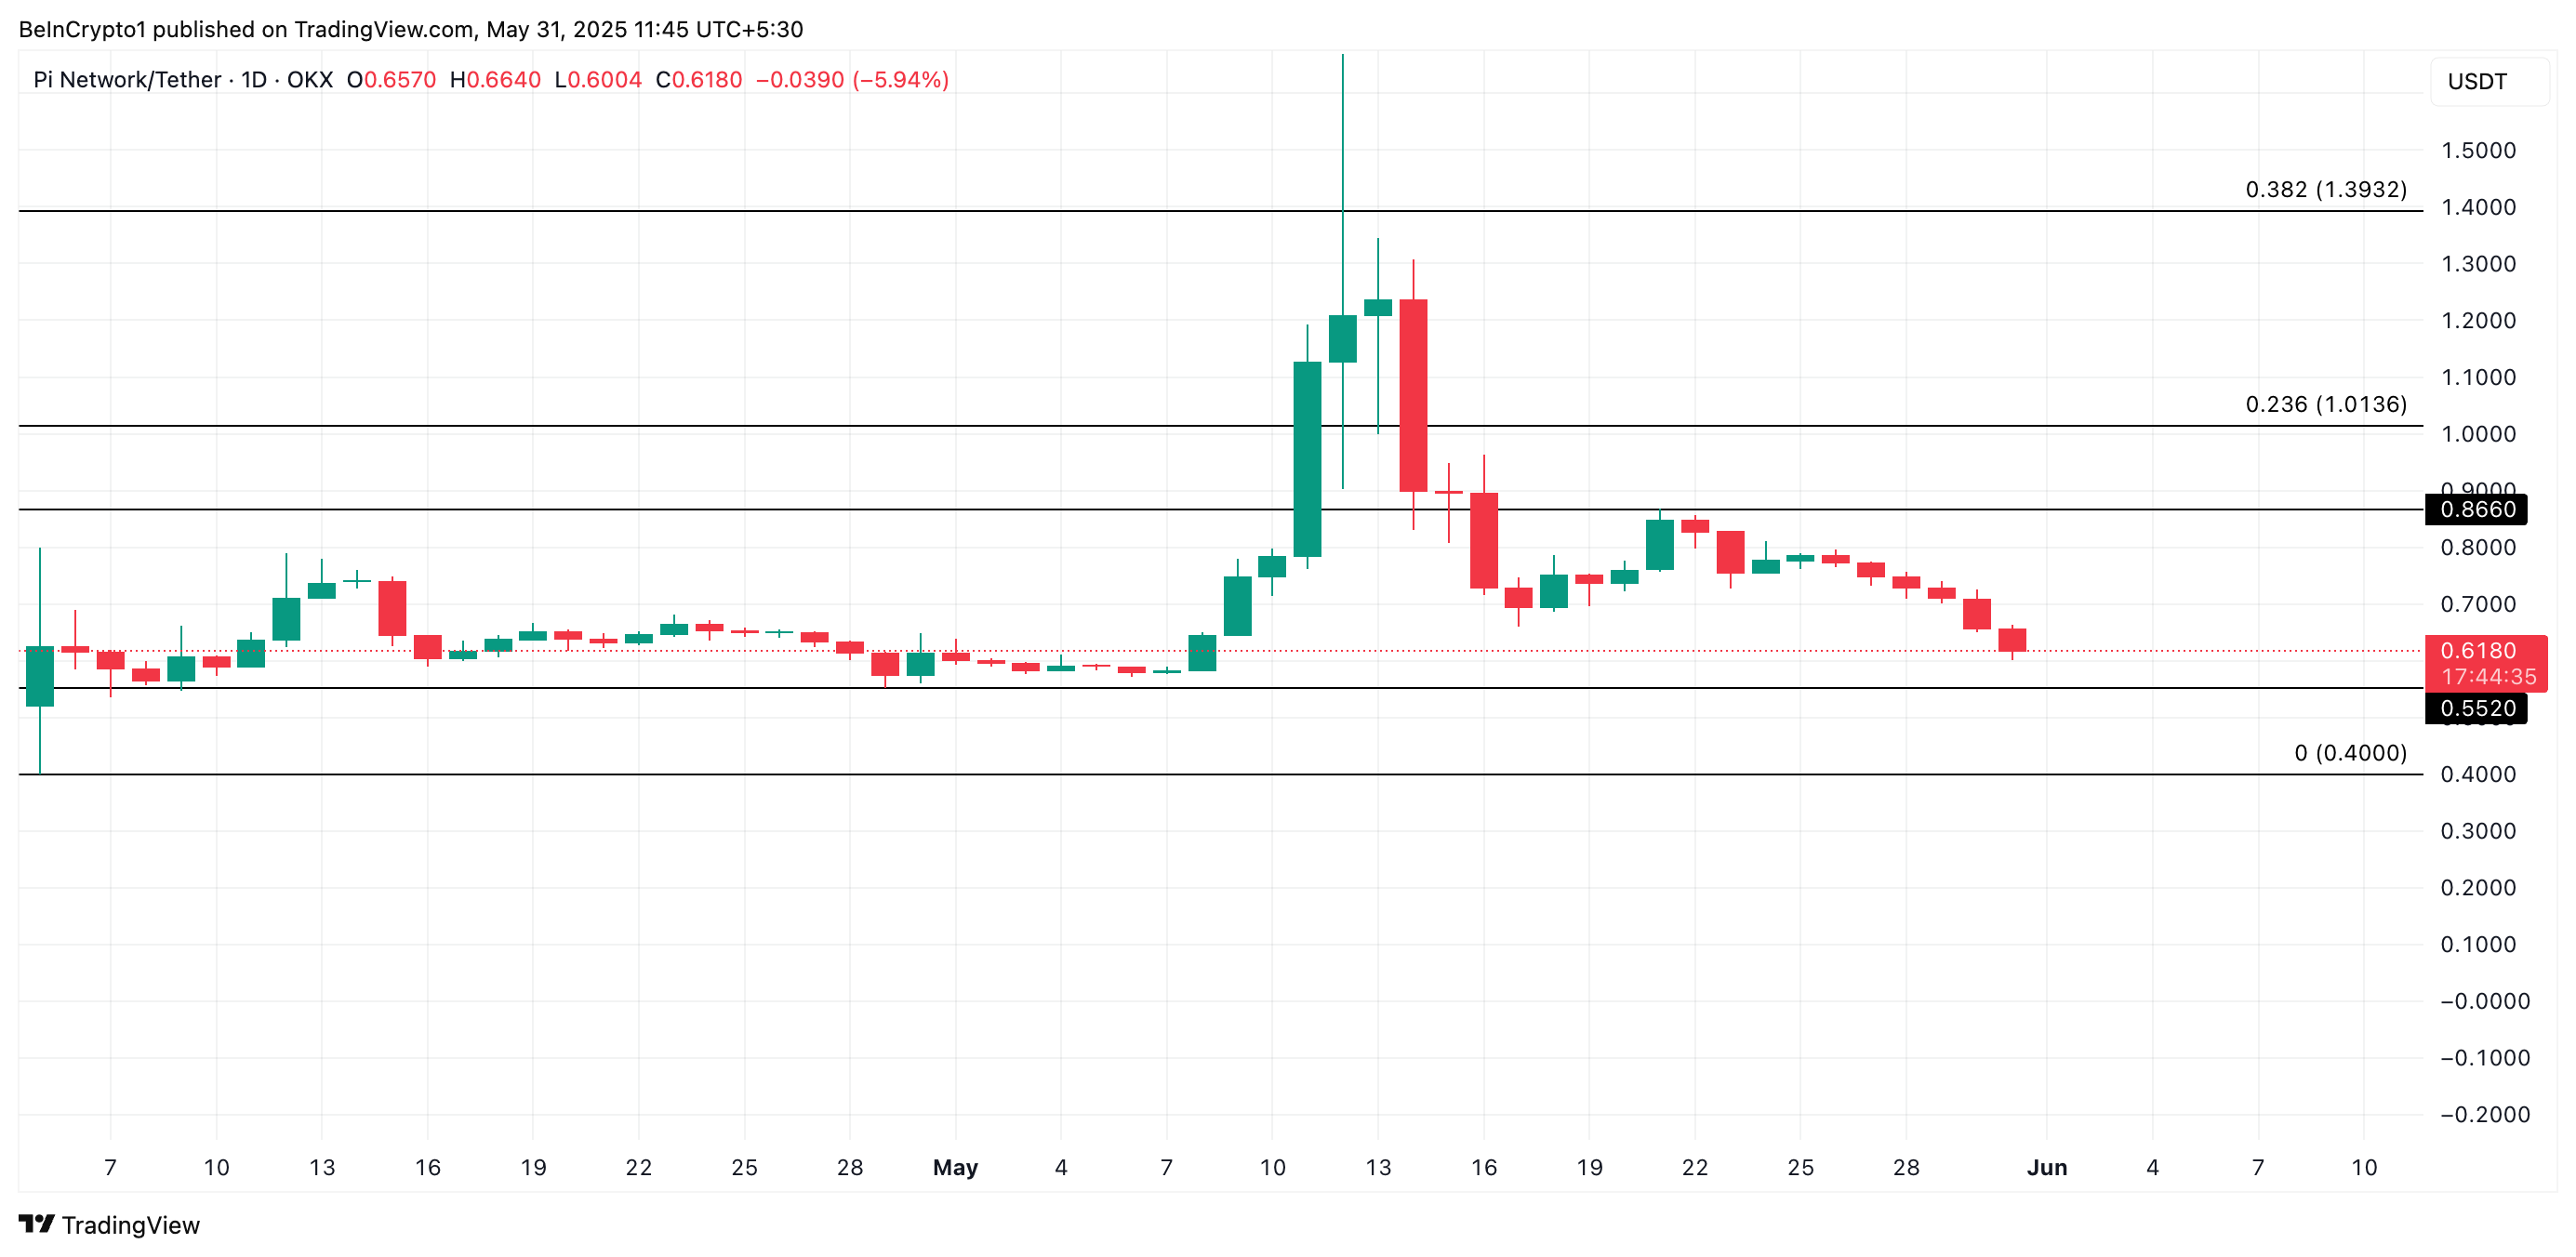
However, a spike in new demand for the token could prevent this from happening. If the PI Network token buying pressure spikes, it could push its price to $0.86.

Log in to Reply
Log in to comment your thoughtsComments
Related Articles
|Square
Get the BTCC app to start your crypto journey
Get started today Scan to join our 100M+ users