HBAR Squeeze: Hedera’s Price Stuck in No-Man’s Land as Traders Sweat

Hedera’s native token HBAR is playing a dangerous game of chicken with the markets—bouncing between support and resistance like a ping-pong ball while traders watch their screens through splayed fingers.
The consolidation comes as no surprise to veterans who’ve seen this story before: promising tech meets impatient capital. Meanwhile, Wall Street ’experts’ are busy arguing whether this is a ’healthy accumulation phase’ or the calm before another crypto storm—because nothing builds confidence like contradictory hot takes.
One thing’s certain: in a market where even stablecoins occasionally forget their purpose, HBAR’s tight range is either a coiled spring or a trapdoor waiting to open. Place your bets.
HBAR BBTrend Turns Negative Again: What It Means
Hedera BBTrend is currently at -3.67, signaling renewed bearish pressure after a brief recovery.
The metric had climbed to 1.84 just yesterday, reflecting short-term momentum before reversing sharply back into negative territory.
This volatility suggests that market sentiment around HBAR remains unstable, with quick shifts in trader positioning and potential uncertainty around near-term price direction.
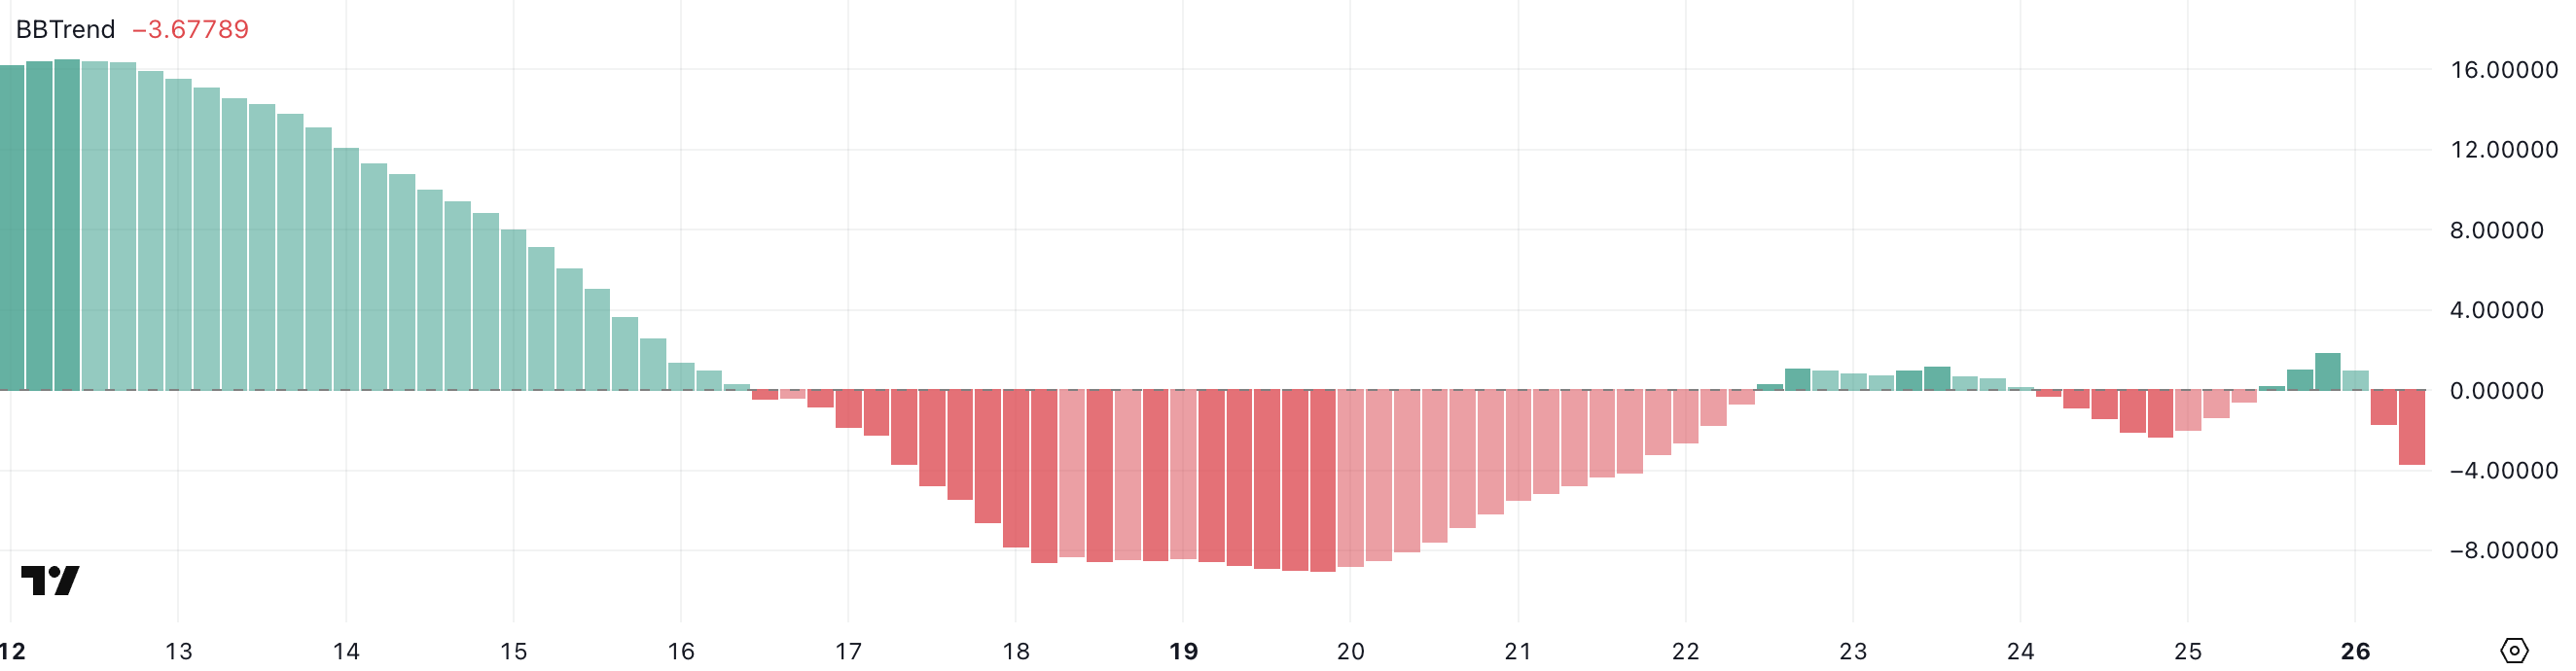
BBTrend, or Bollinger Band Trend, measures the strength and direction of price movement relative to Bollinger Bands. Values above +2 generally indicate strong bullish momentum, while values below -2 reflect strong bearish trends.
A BBTrend reading of -3.67 suggests that HBAR’s price is significantly leaning toward the lower Bollinger Band, often interpreted as persistent downside momentum.
If sentiment doesn’t shift soon, this may imply continued selling pressure or a possible retest of recent support levels.
Hedera RSI Recovers to Neutral Zone After Volatile Swing
Hedera Relative Strength Index (RSI) currently sits at 49.25, recovering from a low of 30.46 just one day ago.
This rebound comes after the RSI nearly hit overbought levels at 69.91 four days ago, highlighting a volatile shift in momentum.
The recent bounce from near-oversold territory to a more neutral zone suggests that bearish pressure has eased, but conviction among buyers remains limited for now.
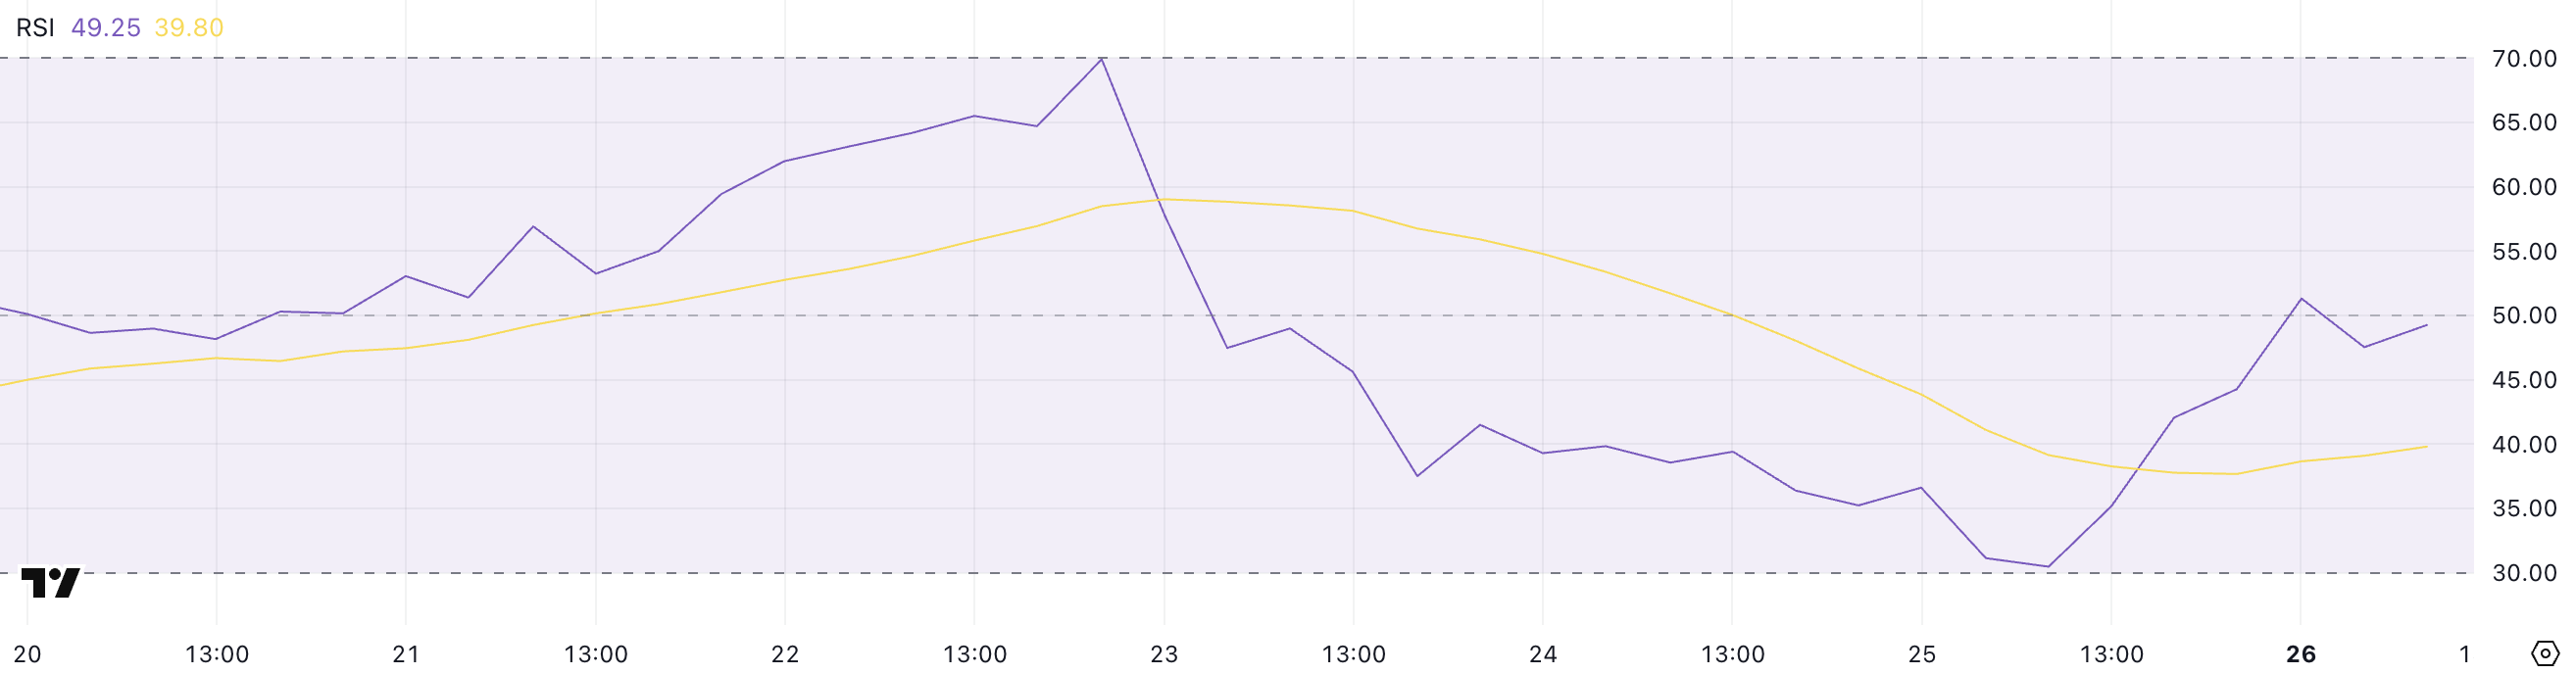
RSI is a momentum oscillator that measures the speed and change of price movements on a scale of 0 to 100.
Readings above 70 typically indicate overbought conditions, while values below 30 suggest an asset is oversold and may be due for a rebound.
HBAR’s RSI at 49.25 signals a neutral stance in the market—neither strongly bullish nor bearish—implying that the next directional MOVE could depend on broader market cues or upcoming catalysts.
Hedera Price Outlook: Can Bulls Break the $0.20 Barrier?
Over the past few days, Hedera has been consolidating in a narrow range between $0.183 and $0.193, showing limited volatility but signaling a potential buildup for a breakout.
If bullish momentum returns, Hedera Price could break above the $0.193 resistance level, opening the path toward $0.20.
A sustained rally could push the price further to $0.209 and, in a stronger uptrend, possibly as high as $0.228—levels that have previously acted as resistance zones.
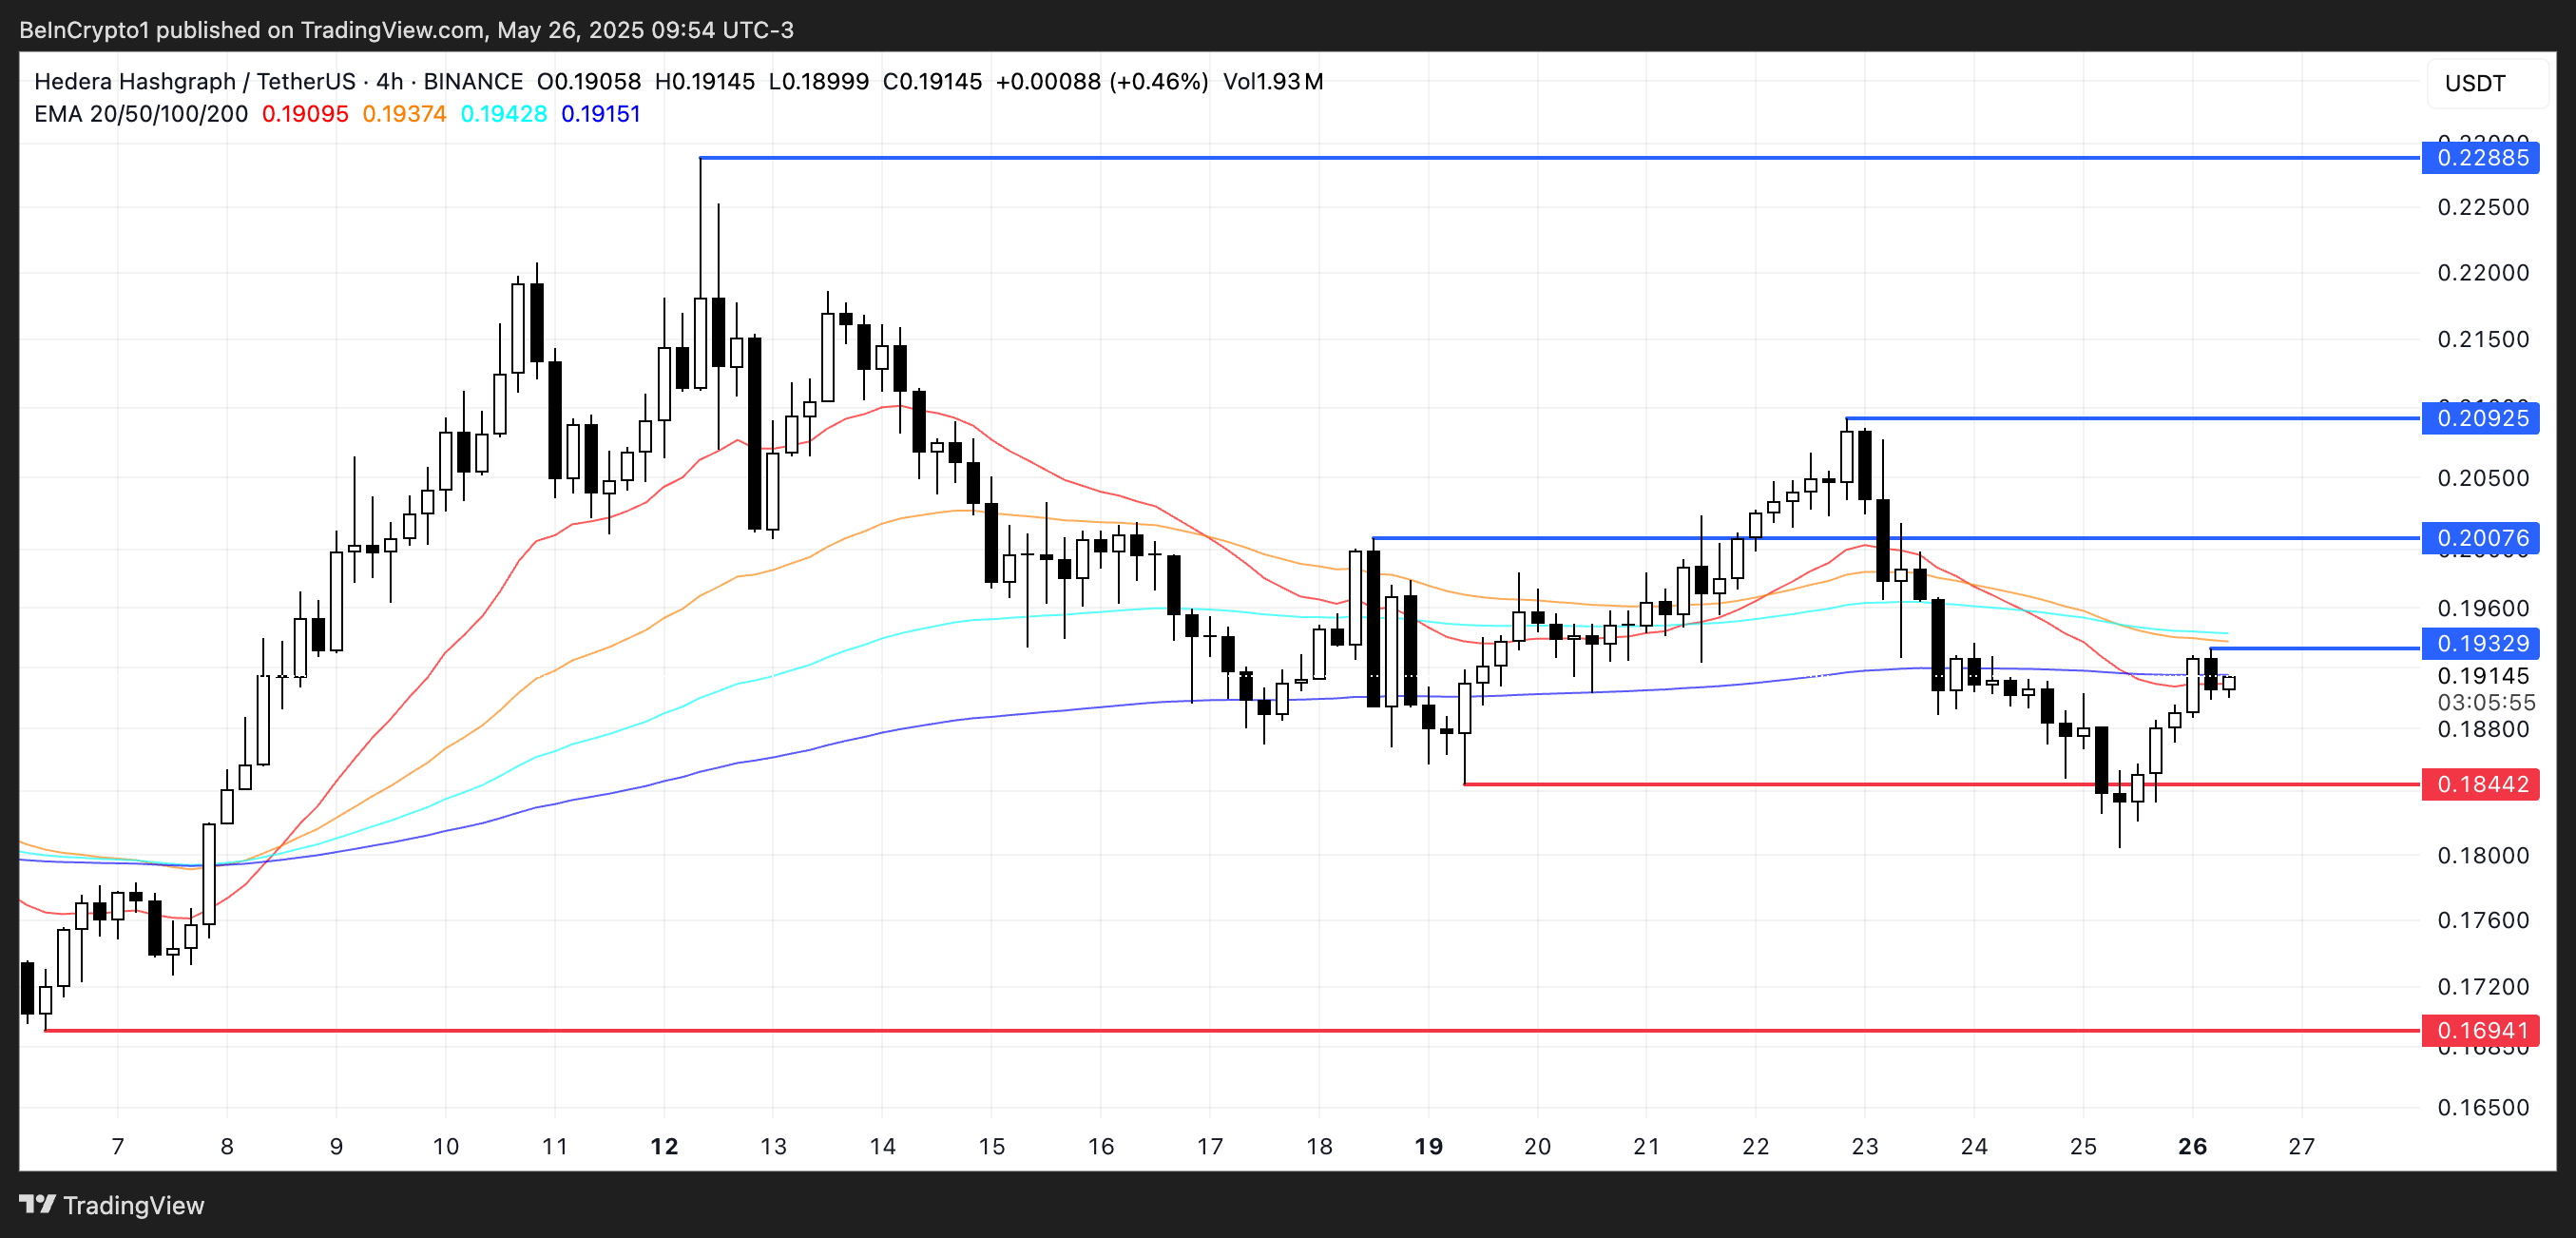
However, the EMA lines currently offer little directional insight, reflecting indecision in trend strength.
If selling pressure increases and HBAR fails to hold the $0.184 support level, the token could decline toward $0.169, a level that WOULD represent a deeper retracement.
Until a clear breakout or breakdown occurs, HBAR’s price action is likely to remain range-bound, with traders watching closely for any confirmation of trend direction.
