PENDLE rockets 15% as whales gobble up tokens—$5 breakout in sight

DeFi’s latest darling isn’t playing nice. PENDLE just ripped through resistance like a hot knife through butter, fueled by aggressive accumulation from deep-pocketed traders.
The chart tells the story: A textbook pennant formation after weeks of consolidation. Now volume’s spiking, liquidity pools are getting drained, and that $5 psychological barrier looks flimsier than a banker’s promise.
Watch the derivatives data next. If open interest follows spot’s lead without excessive leverage, this could be more than just another pump-and-dump spectacle.
PENDLE Soars 135% in Two Months
PENDLE has traded within an ascending parallel channel since March 11, reflecting its growing price over the past two months. At press time, the altcoin exchanges hands at $4.16, climbing 135% from the $1.81 price bottom.
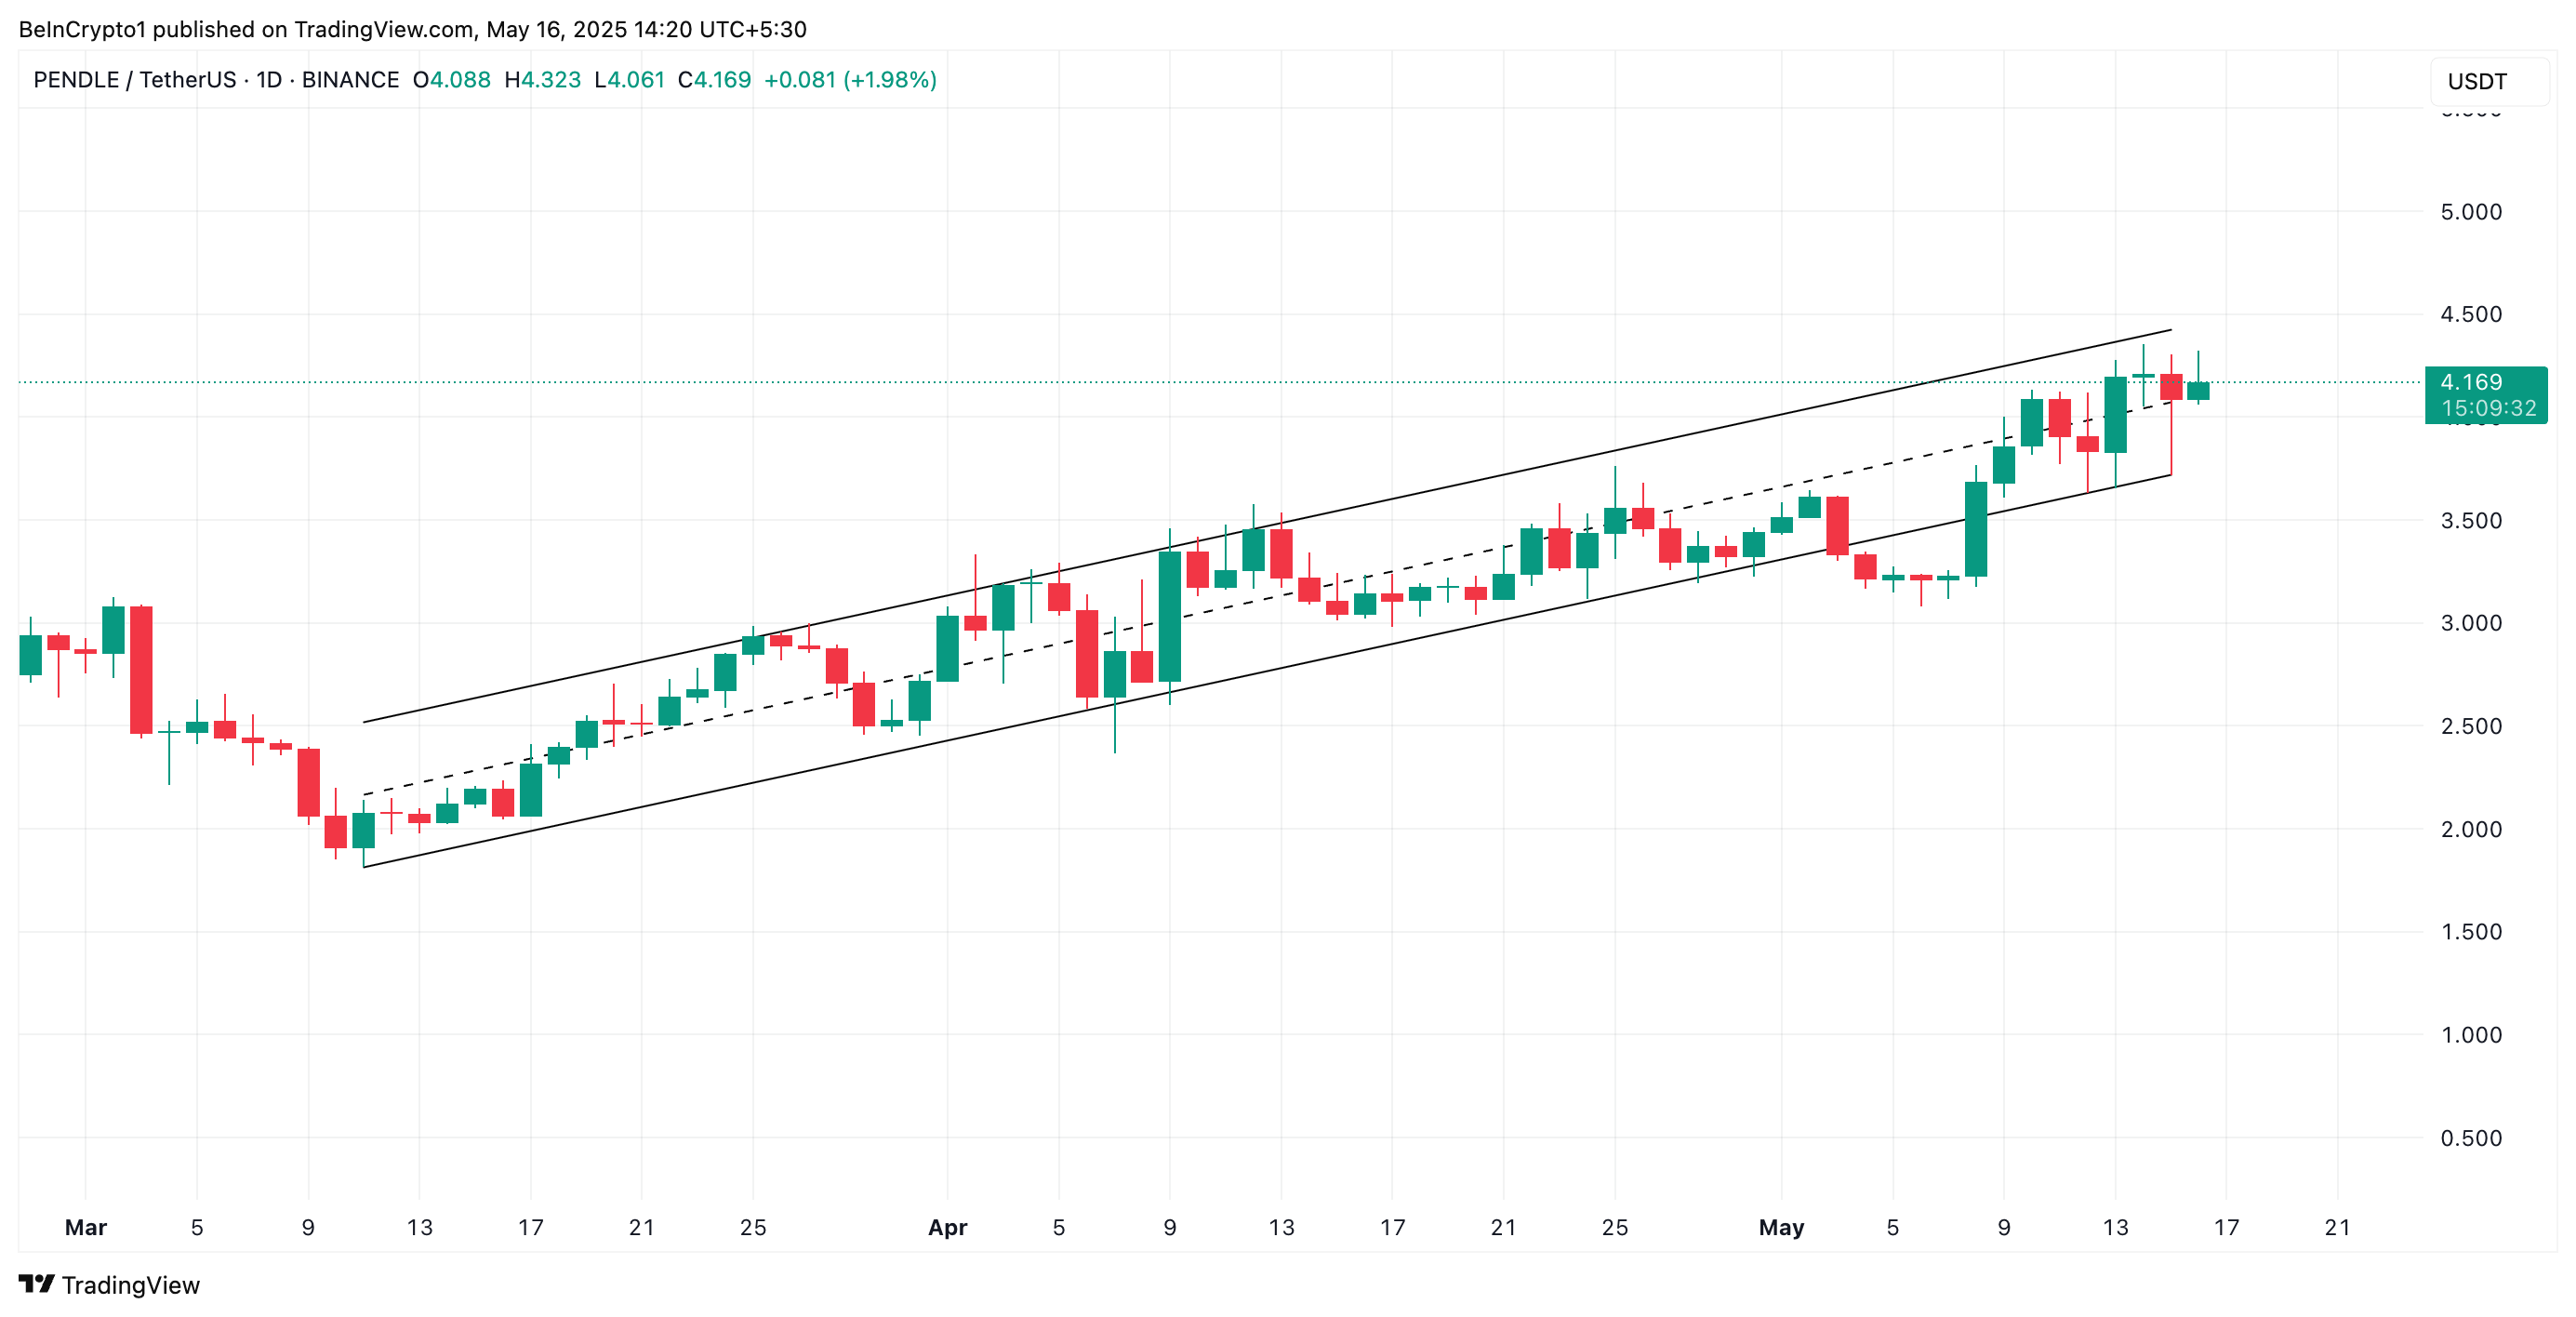
An ascending parallel channel is formed when an asset’s price moves between two upward-sloping, parallel trendlines, indicating consistently higher highs and higher lows. PENDLE’s rally within the channel suggests that its buyers continue to push the price upward while confidently maintaining control over pullbacks.
Moreover, the setup of the token’s Moving Average Convergence Divergence (MACD) supports this bullish outlook. PENDLE’s MACD line (blue) currently lies significantly above its signal line (orange).
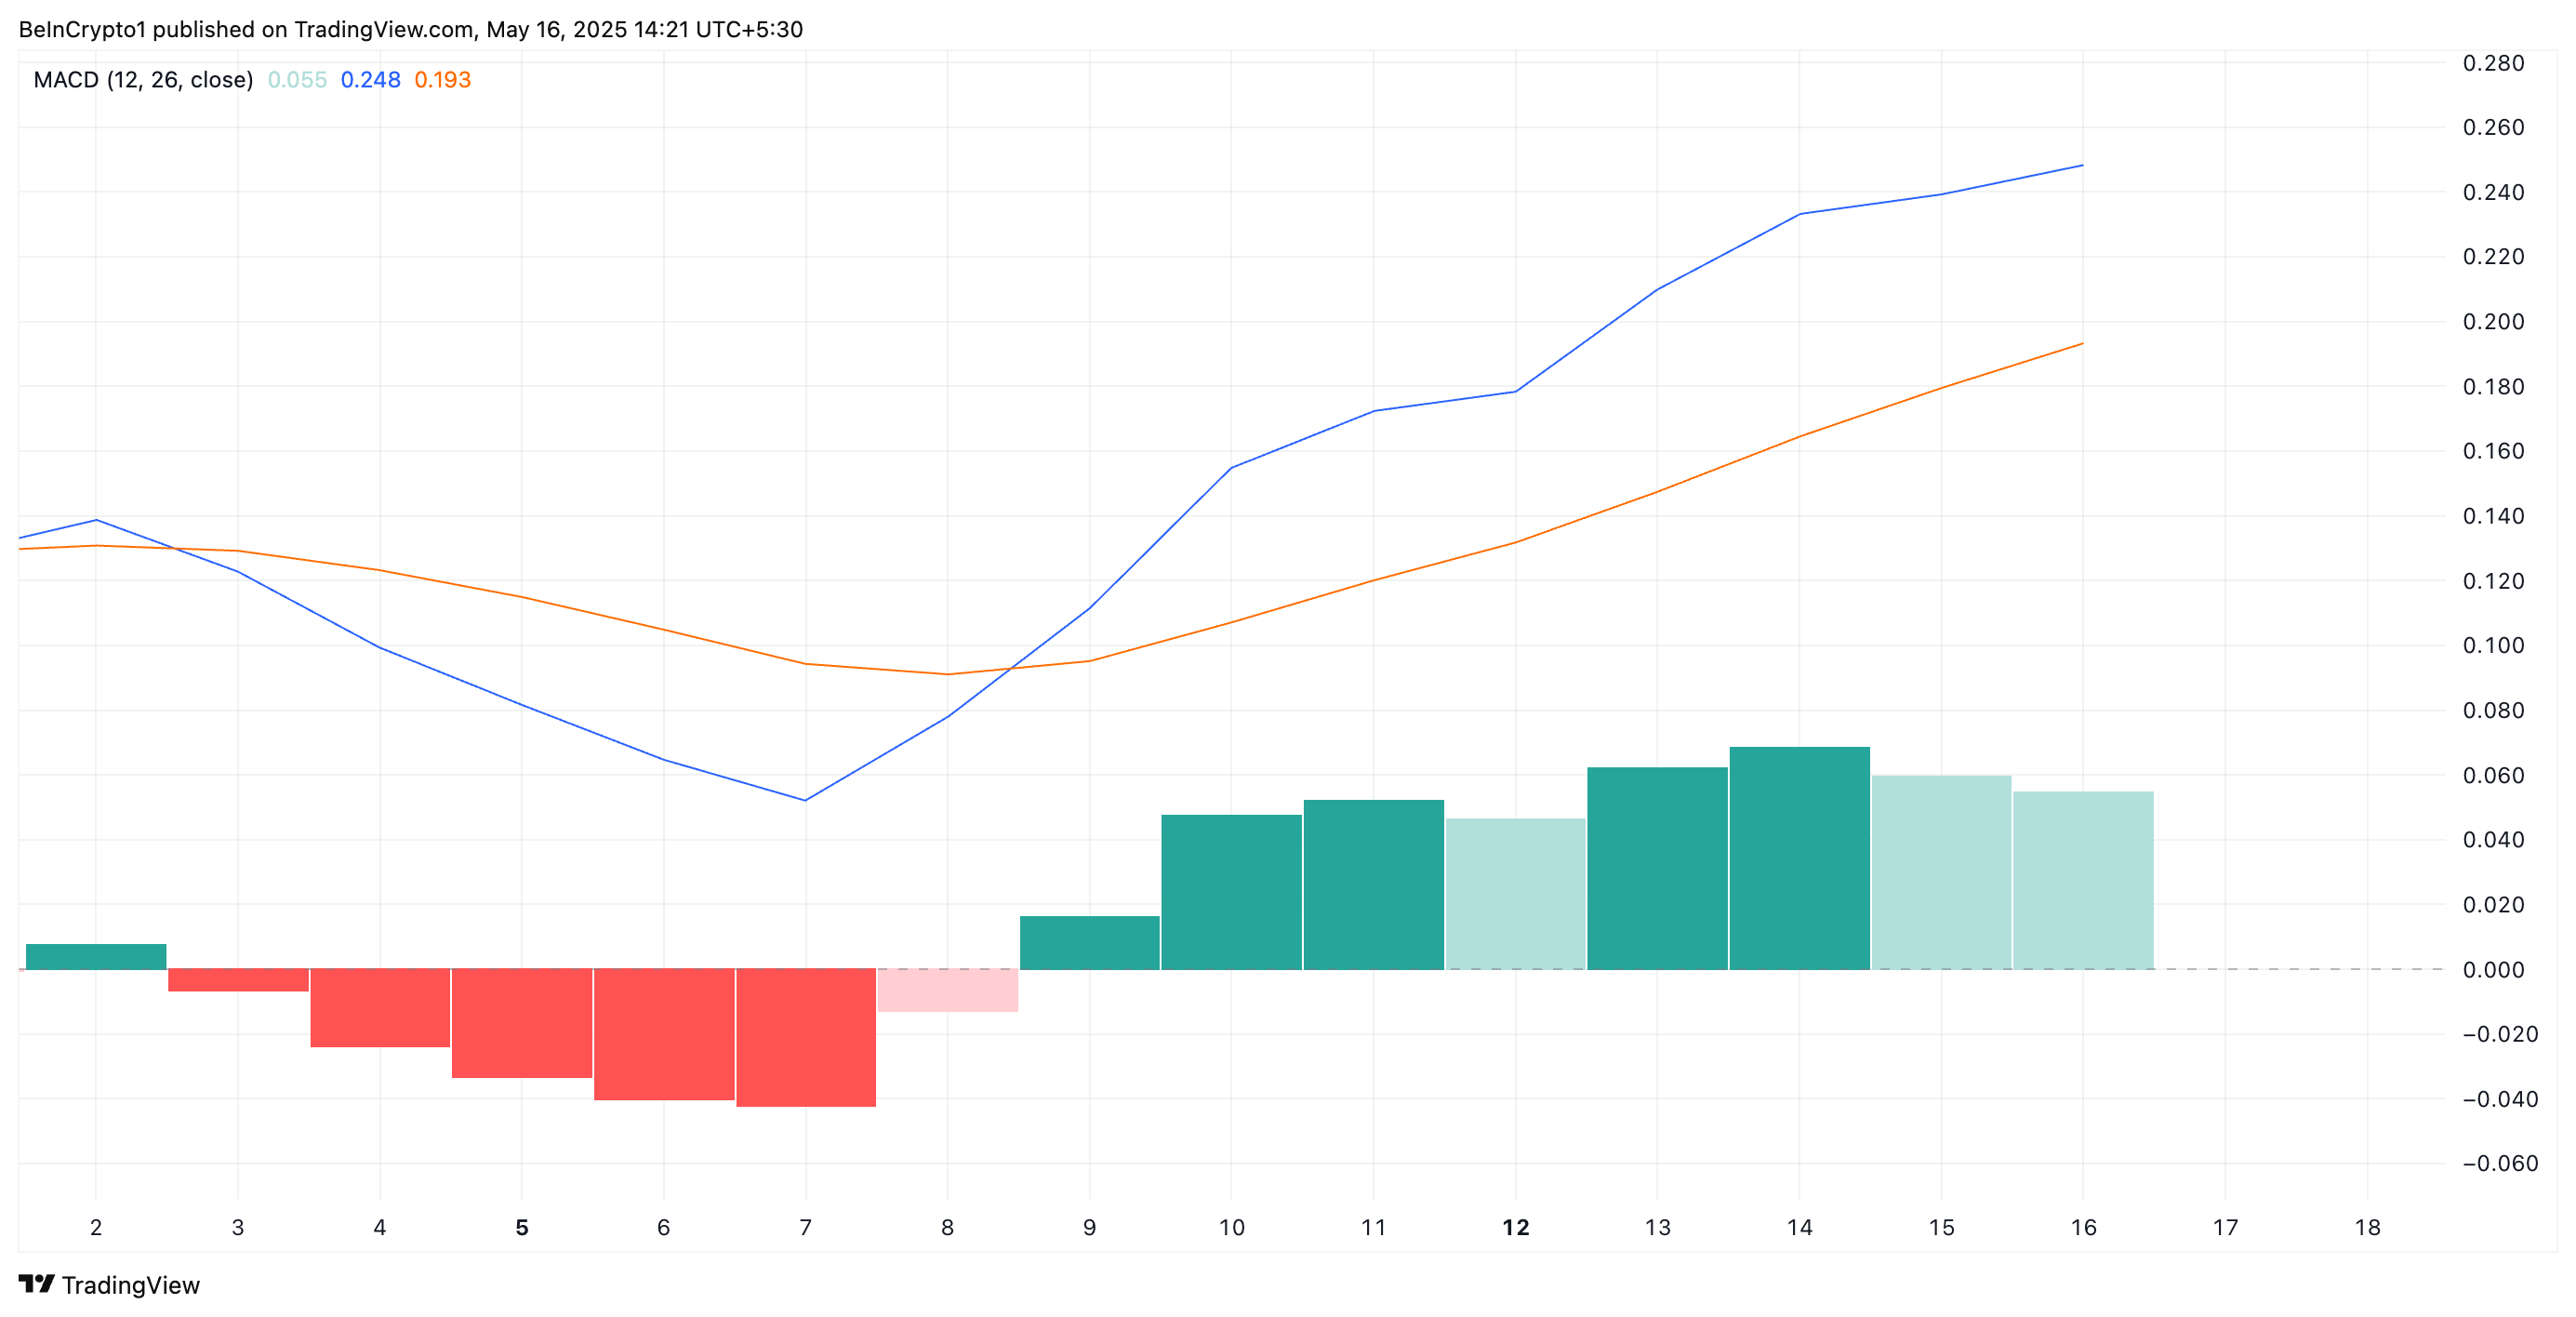
The MACD indicator identifies an asset’s price trends and changes in its momentum. Traders use it to spot potential buy or sell signals through crossovers between the MACD and signal lines.
As in PENDLE’s case, when the MACD line rests above the signal line, it is a bullish signal. It indicates that buying activity exceeds selloffs among traders and hints at a sustained price rally if bullish conditions persist.
Furthermore, PENDLE’s triple-digit rally has pushed it above the Leading Spans A and B of its Ichimoku Cloud, confirming the buying pressure in the market.

The Ichimoku Cloud tracks the momentum of an asset’s market trends and identifies potential support/resistance levels. When an asset trades below this cloud, it reflects a downtrend. In this scenario, the cloud acts as a dynamic resistance zone, reinforcing the likelihood of continued decline if the price remains below it.
On the other hand, breaking above the cloud suggests a strong bullish trend, which signals that buyers have gained control. This means Pendle will likely continue its upward trajectory in the short term.
PENDLE Battles $4.48 Resistance — Will the Bulls Push Through?
PENDLE trades at $4.16 at press time, resting just below the key resistance at $4.48—the barrier standing between it and the $5 price region. If buying pressure strengthens and PENDLE flips this resistance into a support floor, it could propel the token toward $5.10, a high last seen on January 6.
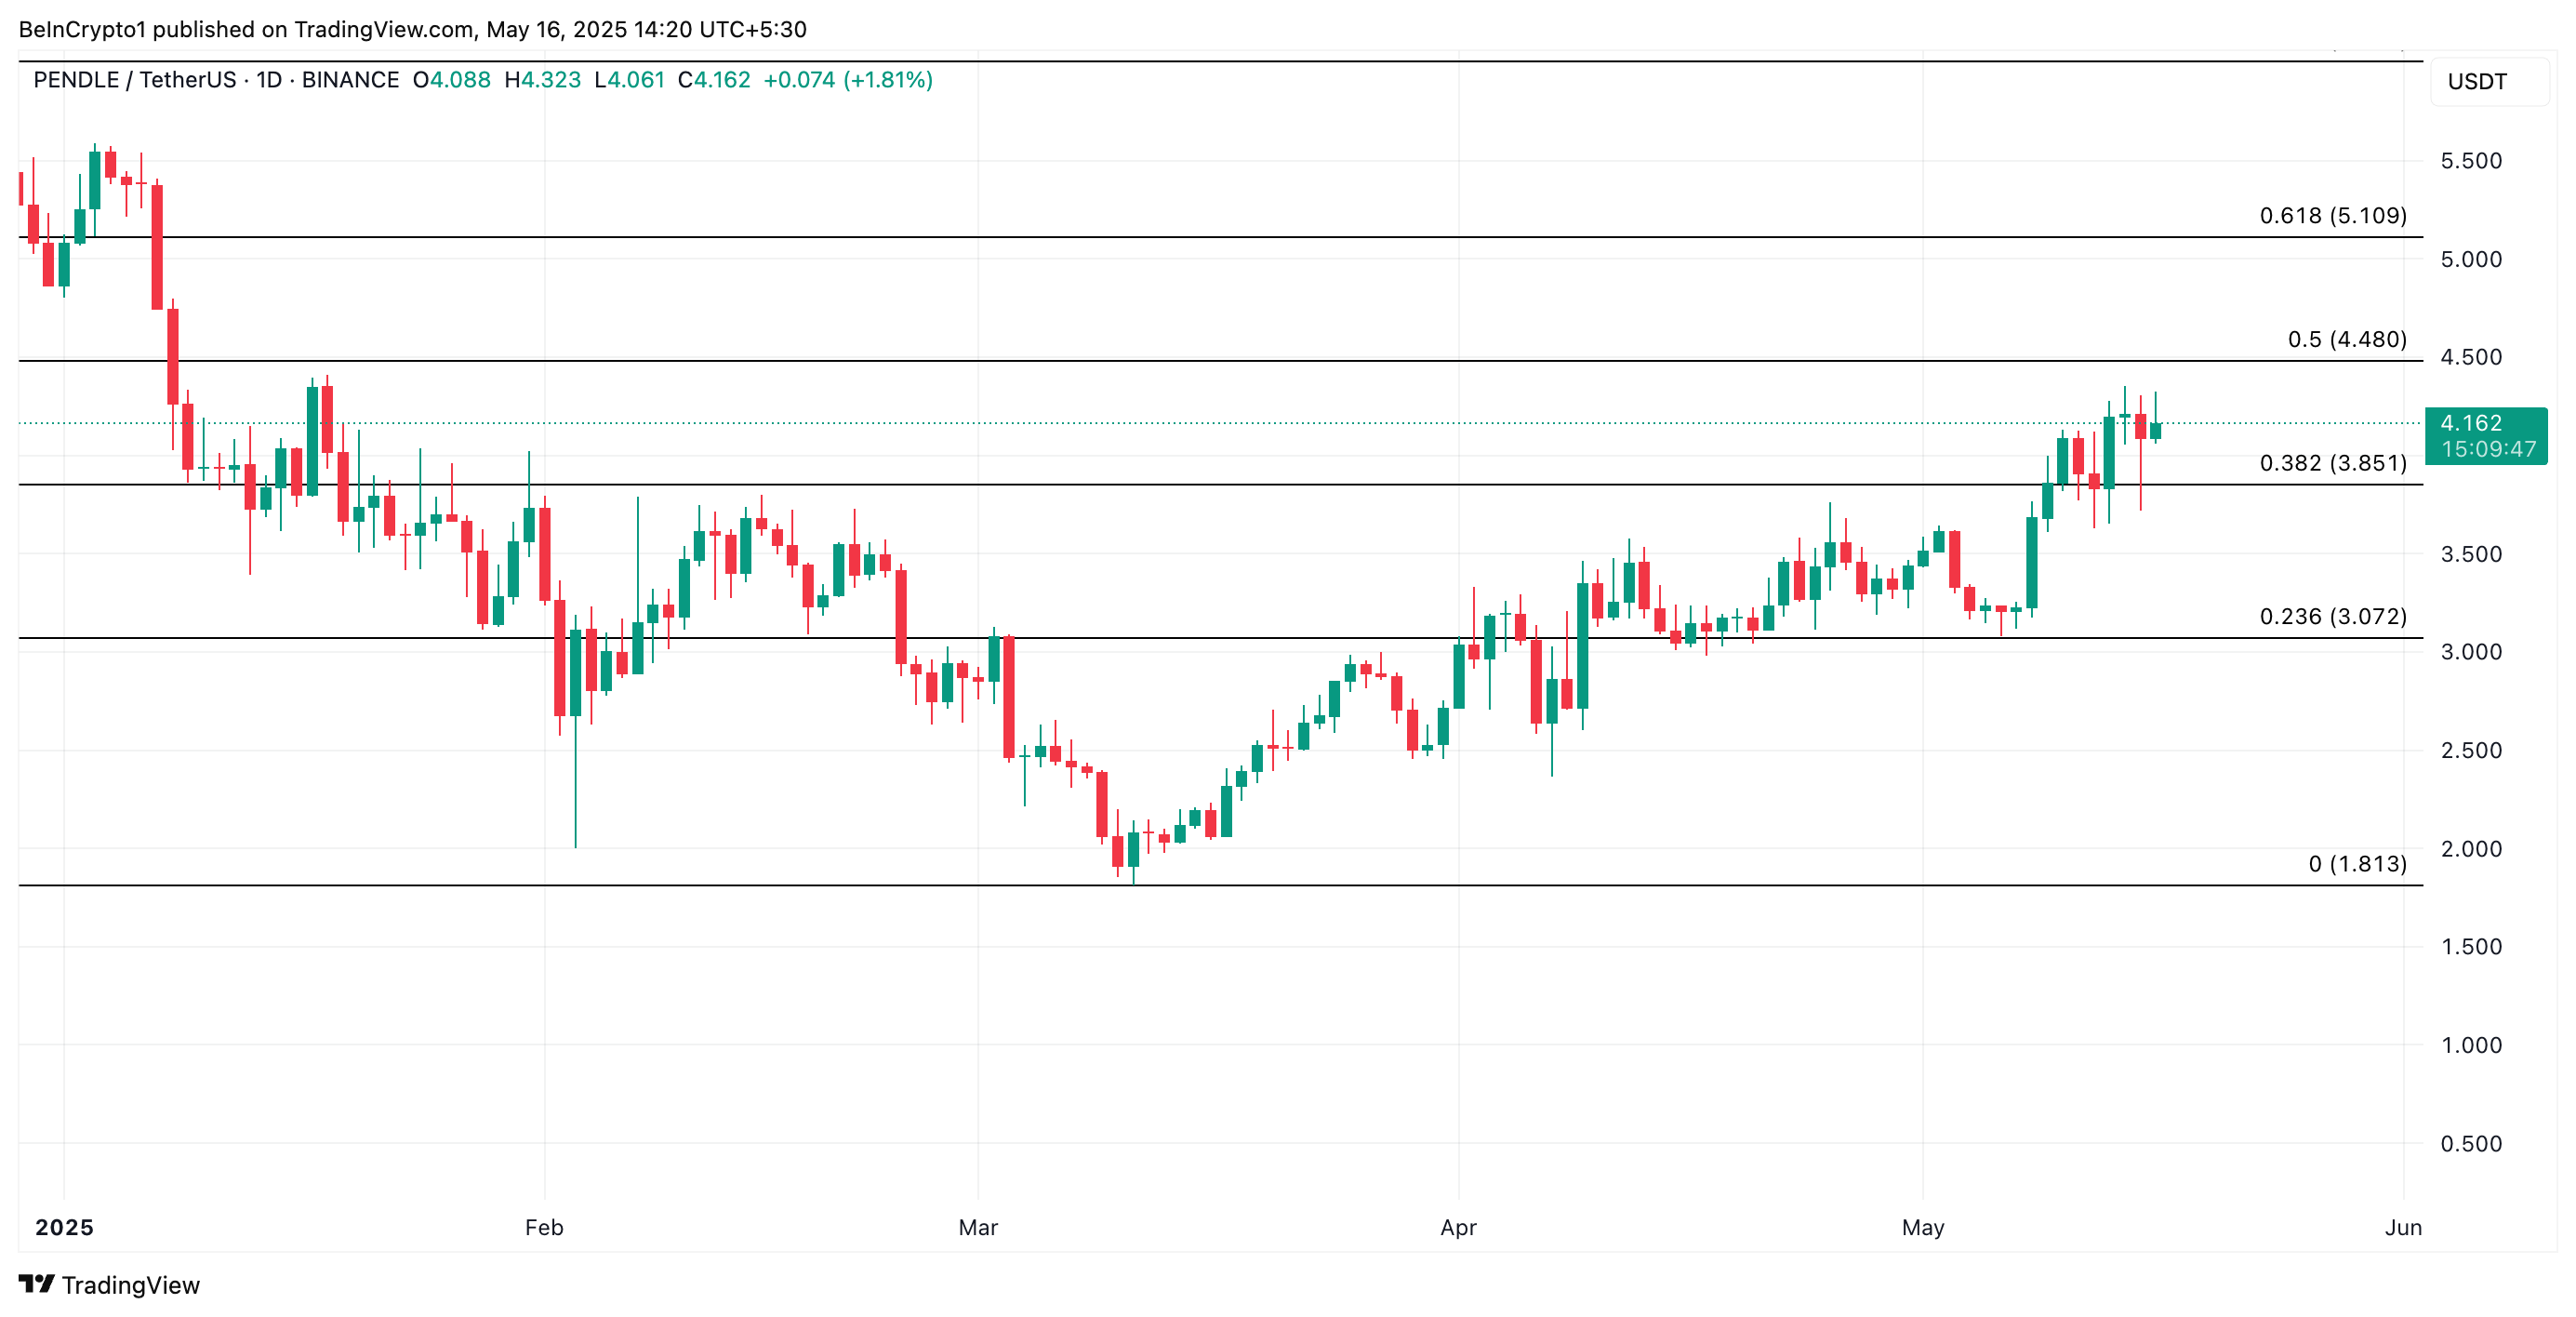
However, if profit-taking sets in, this bullish projection WOULD be invalidated. In that case, the token’s price could fall to $3.85. Should the bulls fail to defend this level, the PENDLE token may extend its decline further to $3.07.

Log in to Reply
Log in to comment your thoughtsComments
Related Articles
|Square
Get the BTCC app to start your crypto journey
Get started today Scan to join our 100M+ users