Ethereum’s 40% Surge Faces Sell-Off Pressure as US Traders Take Profits

ETH’s rally hits turbulence—American holders are dumping bags faster than a hedge fund during a margin call.
Bullish momentum stalls as on-chain data shows US wallets dominating outflows. The ’buy the rumor, sell the news’ playbook strikes again.
Will institutional buyers step in to absorb the sell-side pressure? Or is this the classic crypto cycle of euphoria followed by ’oh god why is my portfolio red’?
Funny how ’decentralized’ markets still pivot on the whims of a few whale wallets. Just saying.
ETH’s Price Rally Faces Risk as US Investors Exit
According to CryptoQuant, ETH’s Coinbase Premium Index (CPI) reached a weekly peak of 0.022 on May 10 and has since trended downward. As of this writing, the metric sits at 0.0063.
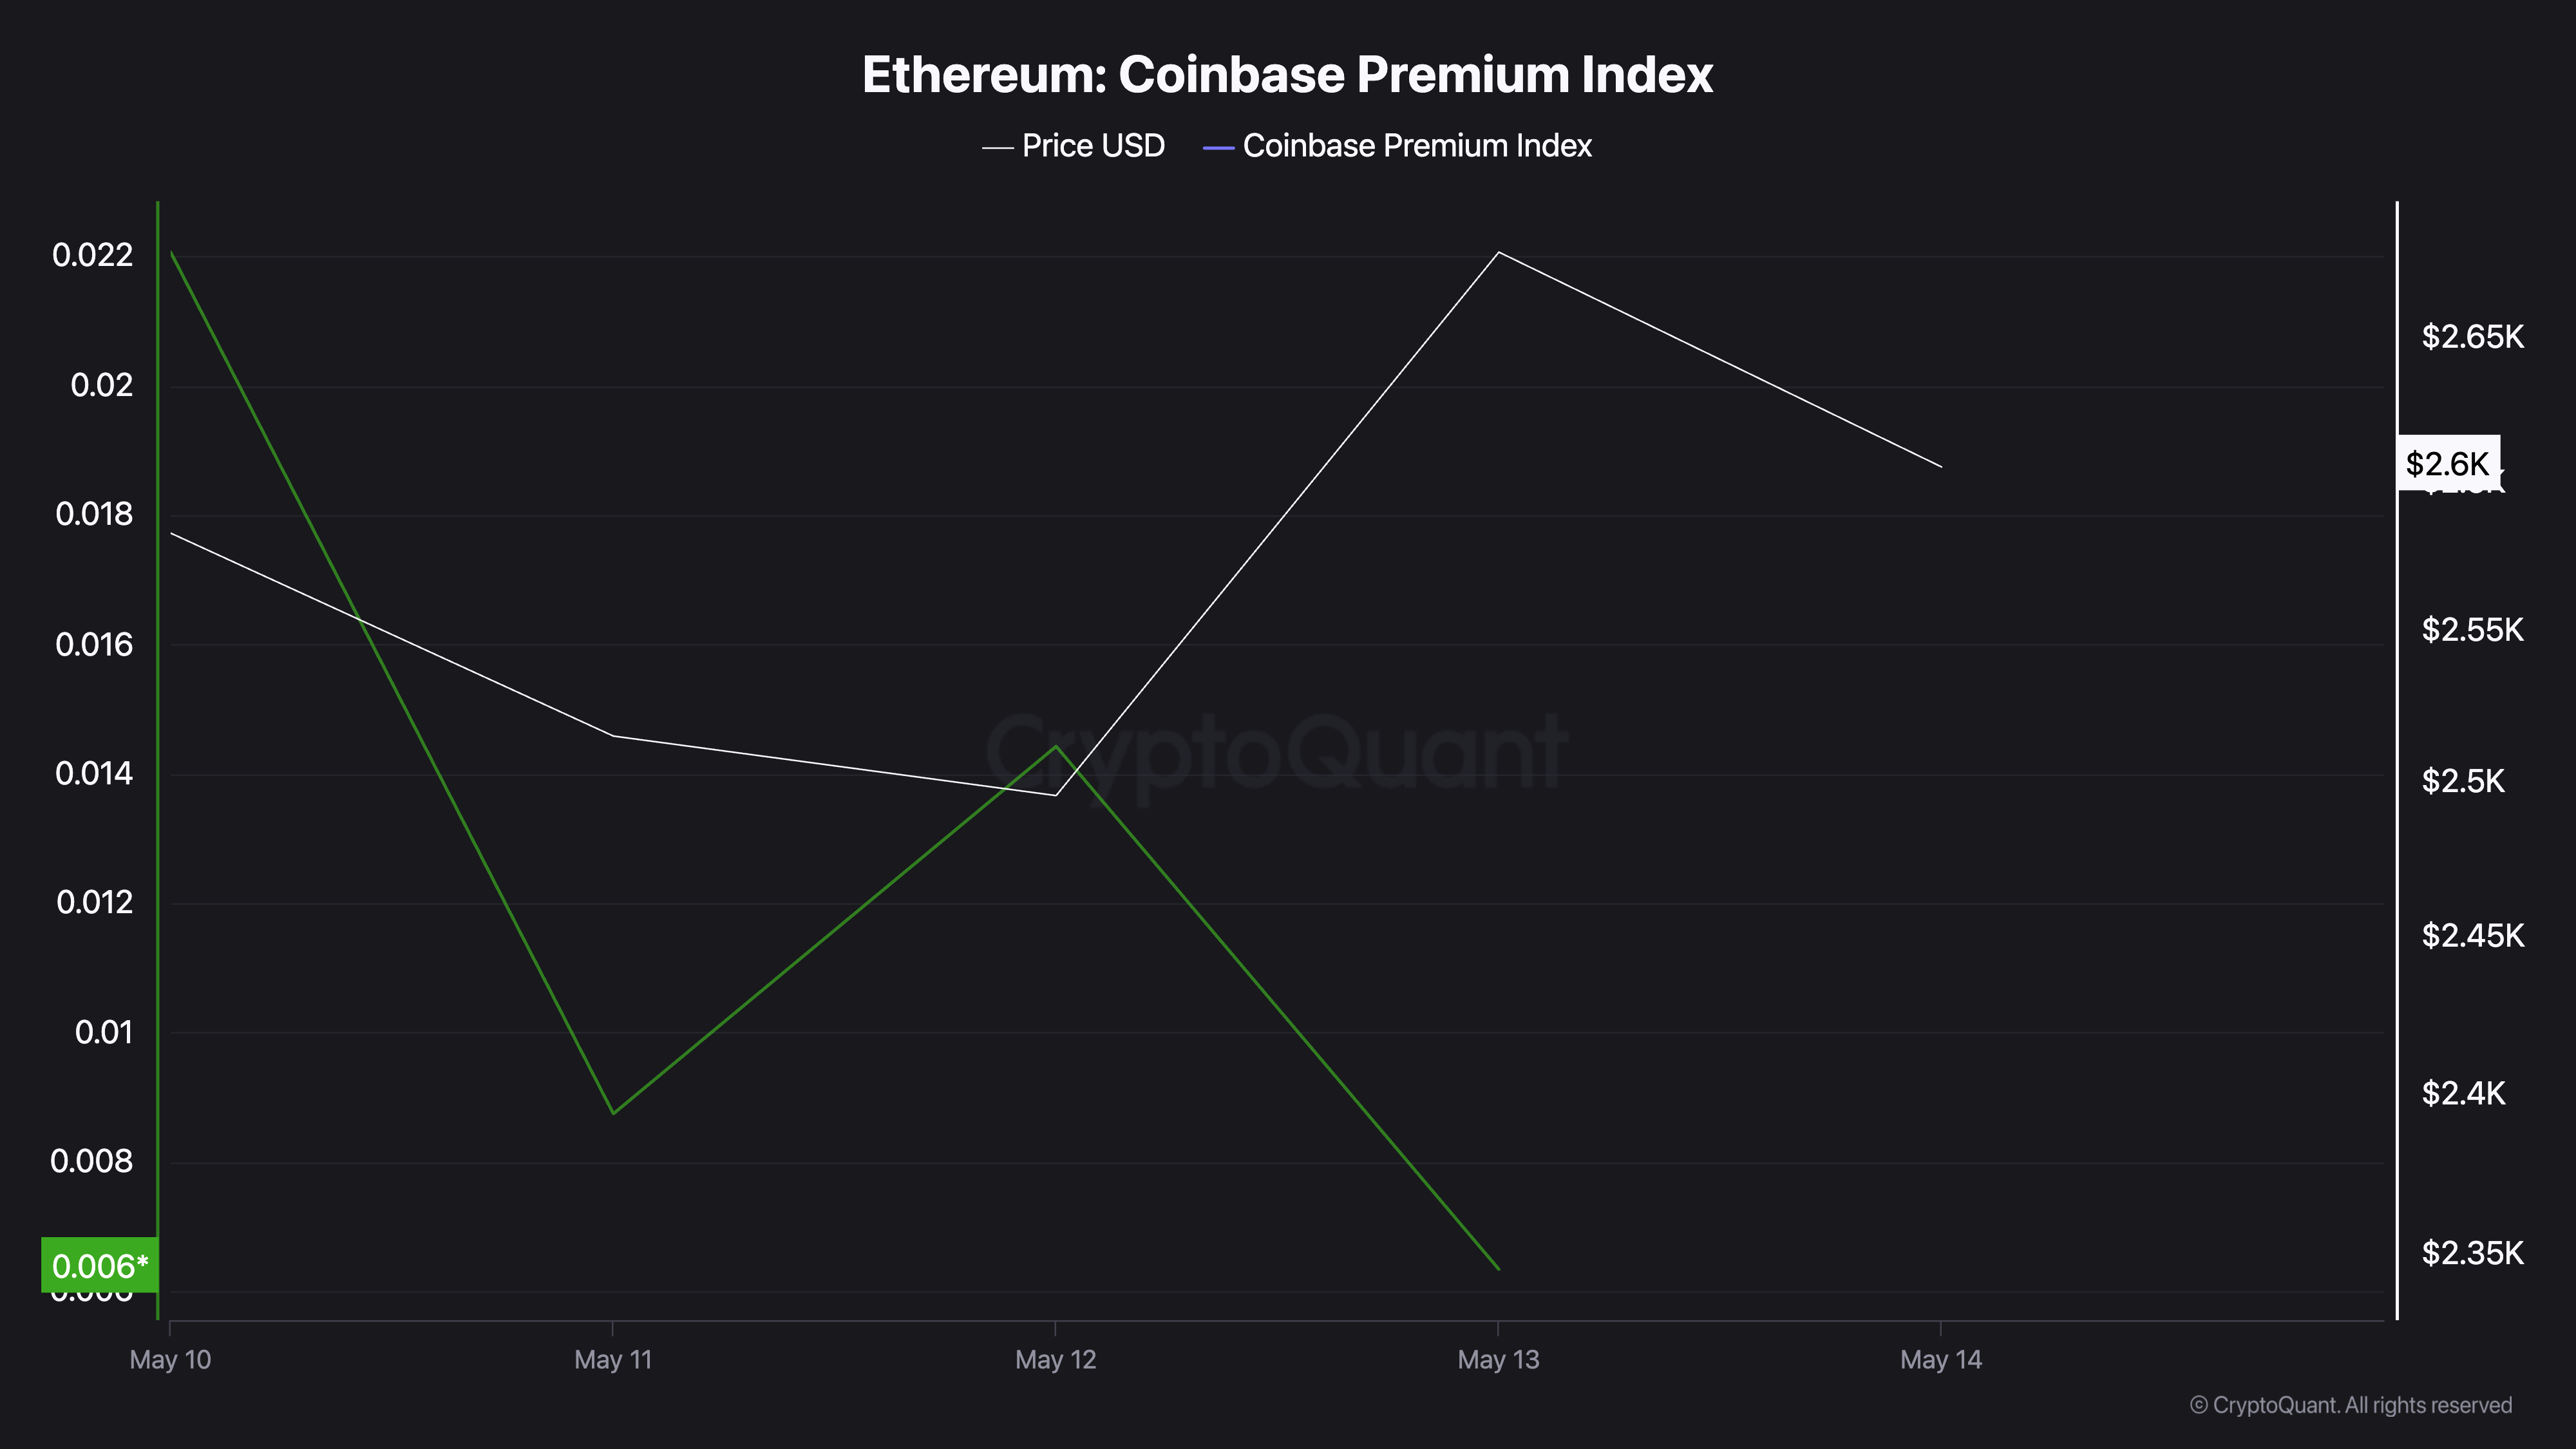
This metric has noted a decline despite ETH’s 5% price rally during the same period. This suggests increased selling pressure from US investors, a trend that can weigh heavily on the altcoin’s price.
ETH’s CPI measures the difference between the coin’s prices on Coinbase and Binance. It is a good indicator for tracking US investor sentiment.
When the CPI rises, it means ETH is trading at a premium on Coinbase compared to international exchanges, reflecting stronger buying pressure from US-based institutional and retail investors.
Conversely, when the CPI falls—or worse, turns negative—it signals that demand on Coinbase is lagging behind global markets, due to profit-taking or waning interest among US buyers. ETH’s falling CPI amid its price rally indicates that American investors are exiting their positions and realizing gains, rather than buying into the rally.
Moreover, readings from ETH’s Price-to-Daily Active Addresses (DAA) divergence, an on-chain metric that compares price movement with network activity, confirm this bearish outlook. Per Santiment, the metric has been negative over the past few days even as ETH’s price climbs. As of this writing, it is at -58.2%.
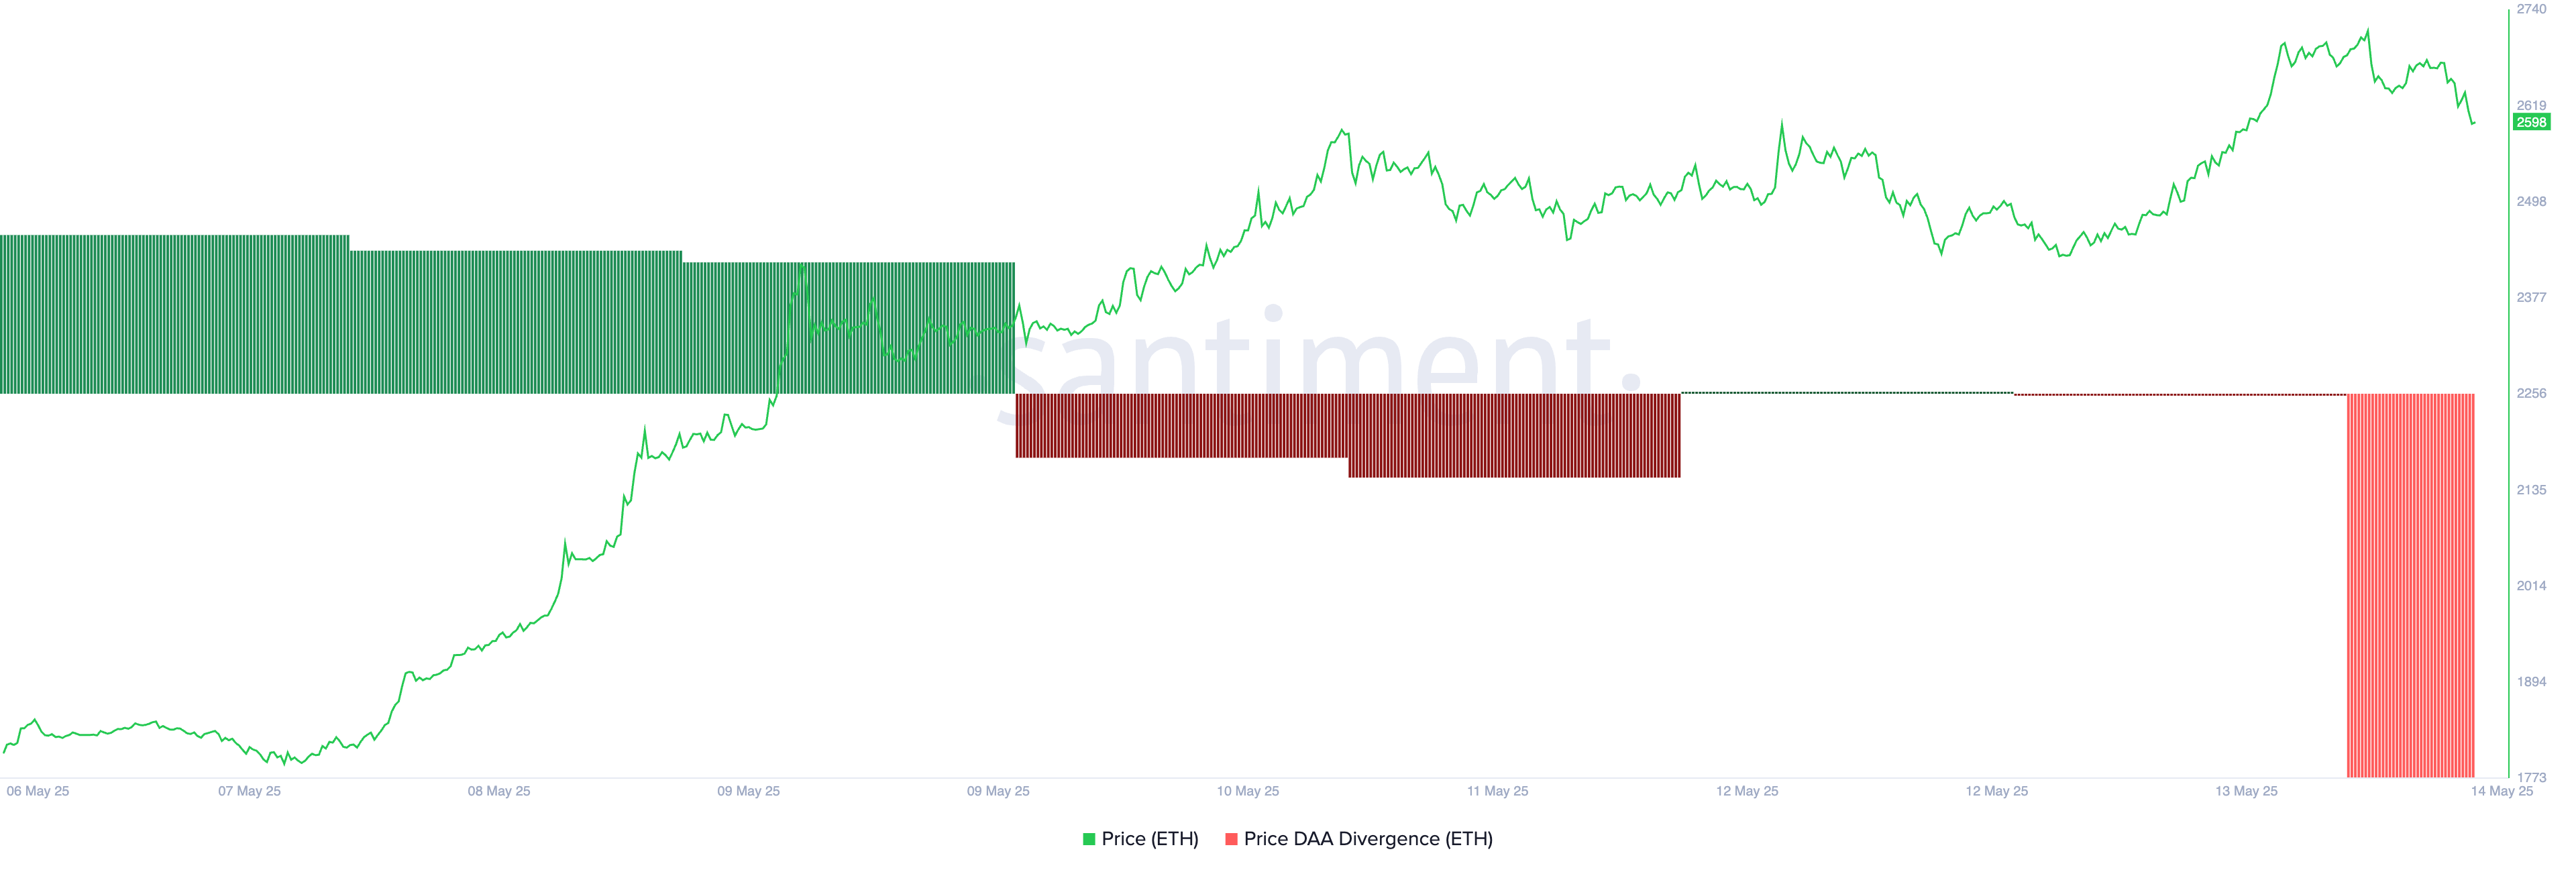
This negative value indicates that a corresponding rise in user engagement does not support ETH’s recent price gains. In essence, not enough demand is driving ETH’s rally, hence it risks a pullback in the near term.
Will Bulls Reclaim $2,745 or Is a Deeper Drop Ahead?
ETH trades at $2,598 at press time, resting just below the multi-month resistance formed at $2,725. As US-based investors lock in profits, downward pressure on ETH is intensifying and could push its price toward $2,424.
If the bulls fail to defend this level, the coin’s price could plummet further to $2,243.
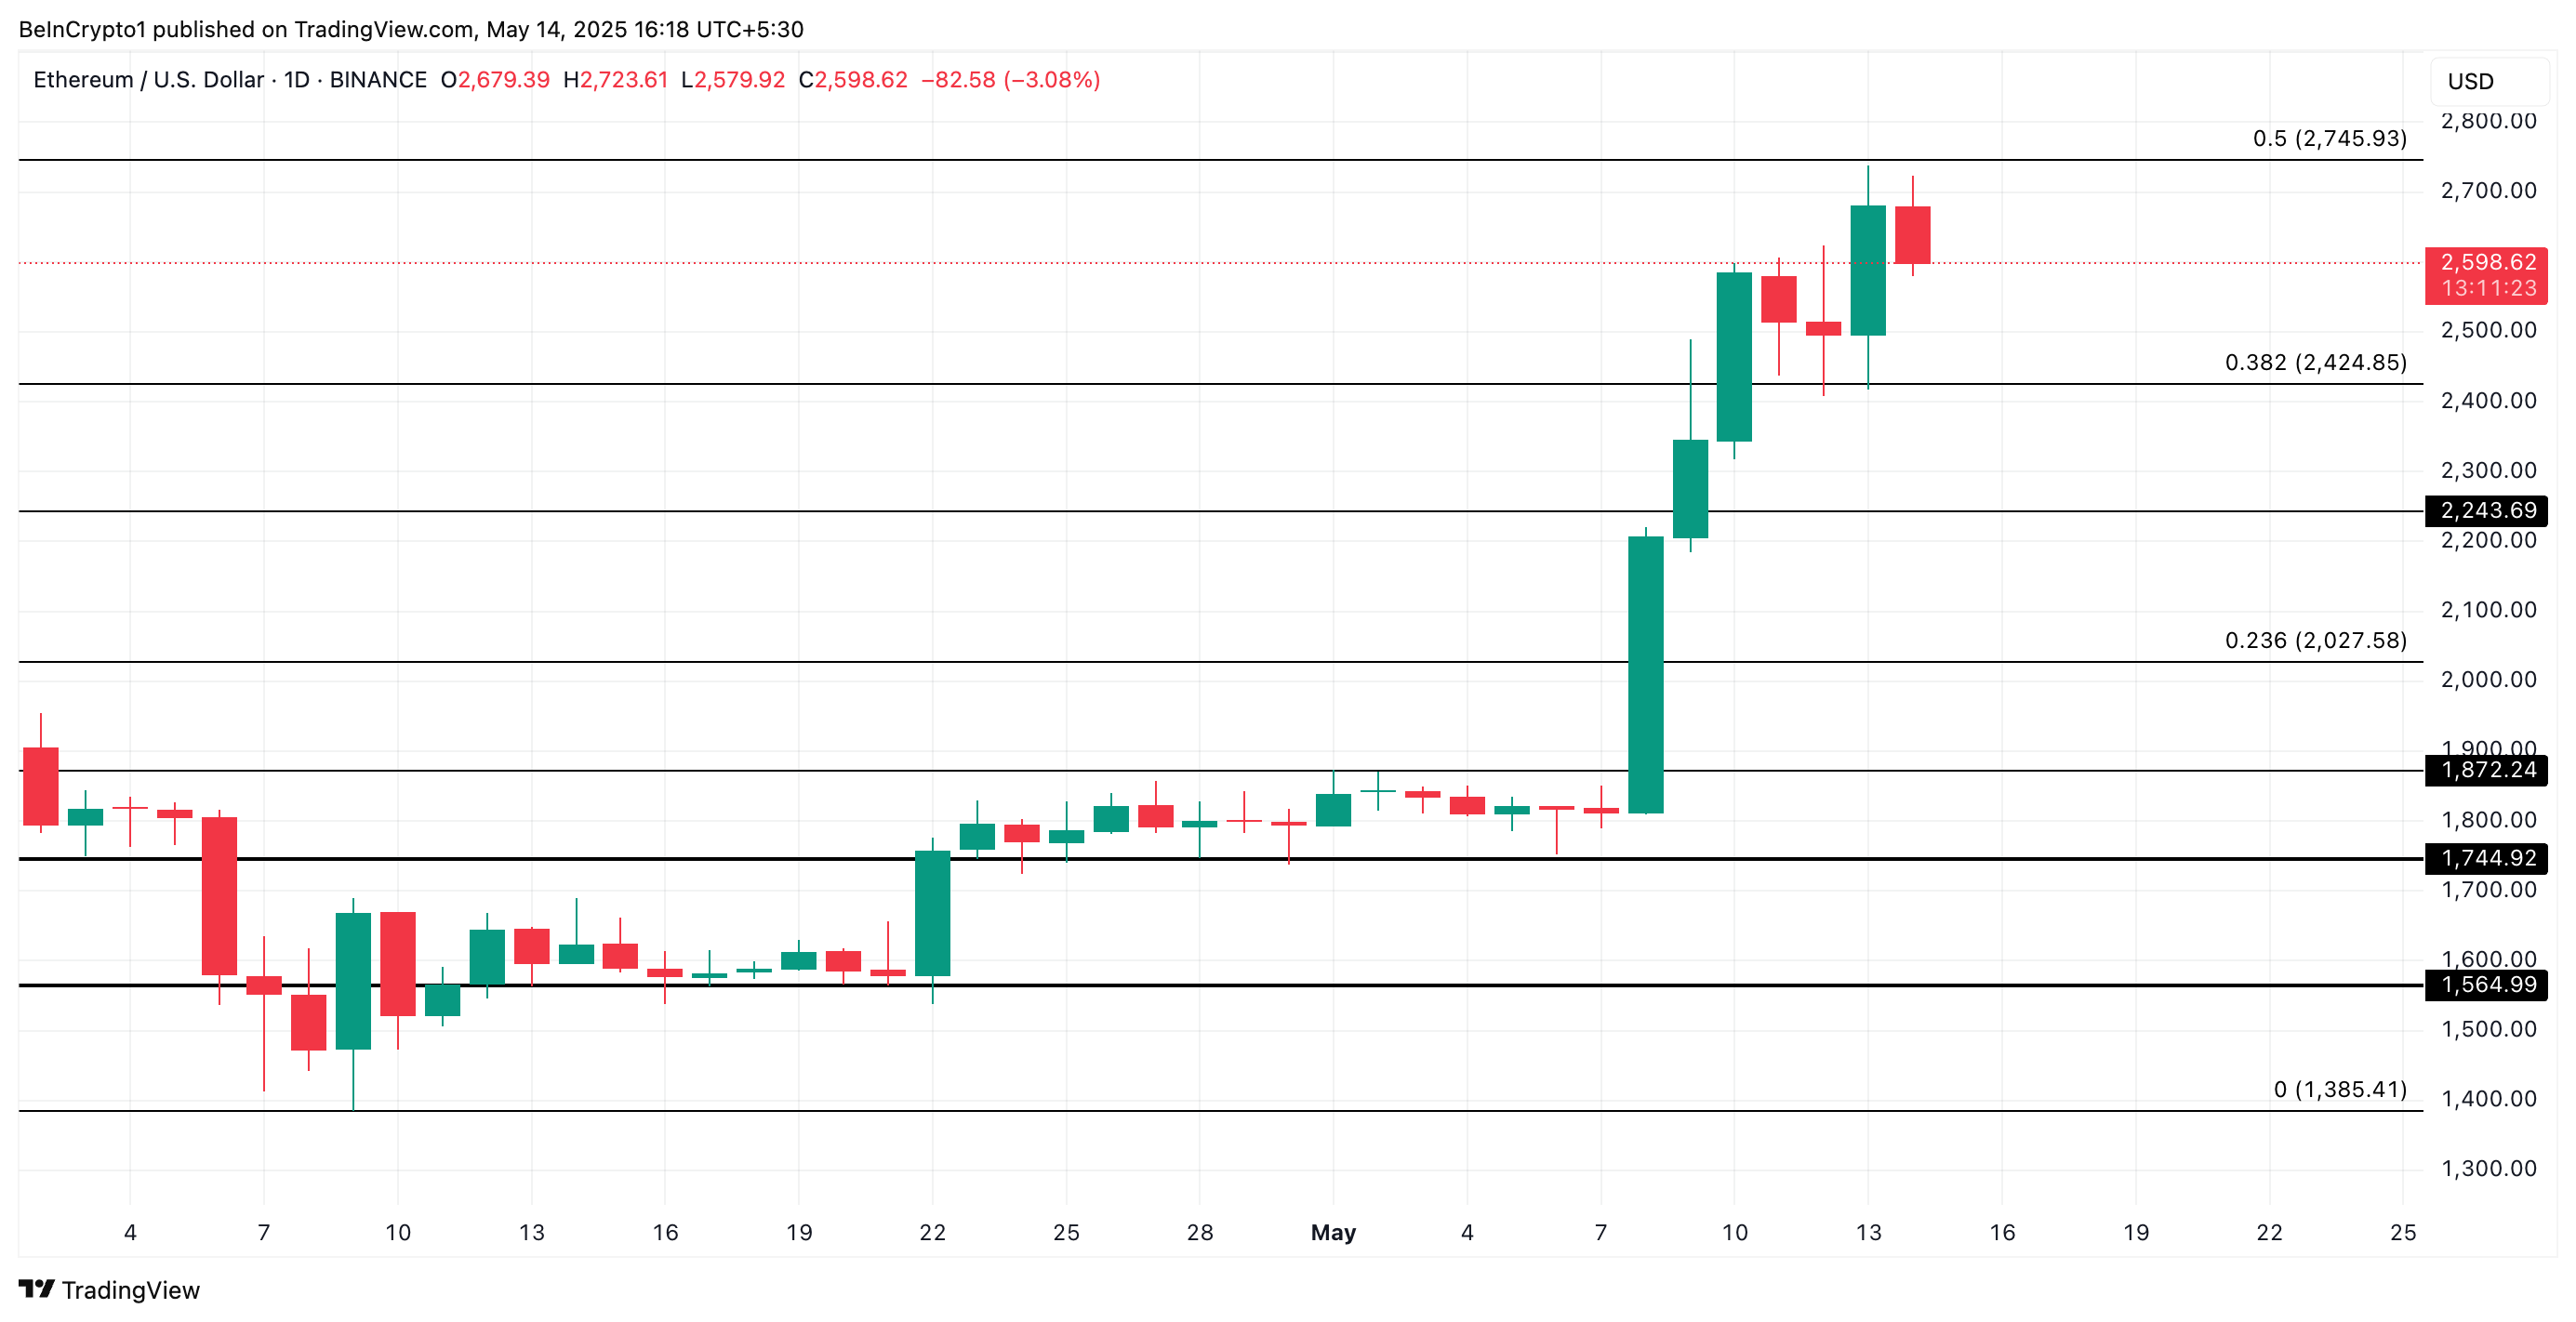
However, if bullish pressure strengthens, ETH could make another attempt to climb back to $2,745.
