Raydium (RAY) Skyrockets 20%—DeFi Dark Horse Charges Toward $4 Comeback

Solana’s sleeper-hit DEX token RAY just outran the entire crypto market with a blistering 20% surge. Traders are scrambling as the altcoin flips resistance levels like a pancake chef at Sunday brunch.
The $4 Question
All eyes are on whether Raydium can reclaim its 2024 peak—a psychological barrier thicker than a Wall Street exec’s skull. Liquidity pools are deepening as yield farmers position for what could be either a breakout or yet another ’buy the rumor, sell the news’ circus.
Cynical Bonus
Meanwhile, traditional finance bros are still trying to explain to their bosses what an AMM is—between golf outings and 3-martini lunches, of course.
RAY Climbs 60% in 7 Days, Signals More Upside Ahead
Since April 8, the RAY token has maintained a steady uptrend, posting new daily highs as bullish momentum builds. Over the past seven days alone, the token’s price has surged nearly 60%, pushing it to a three-month high of $3.70 at press time.
The surge comes amid increasing investor confidence, as the token trades well above its 20-day Exponential Moving Average (EMA) on the daily chart. This key moving average forms dynamic support below RAY’s price, preventing it from significant dips.
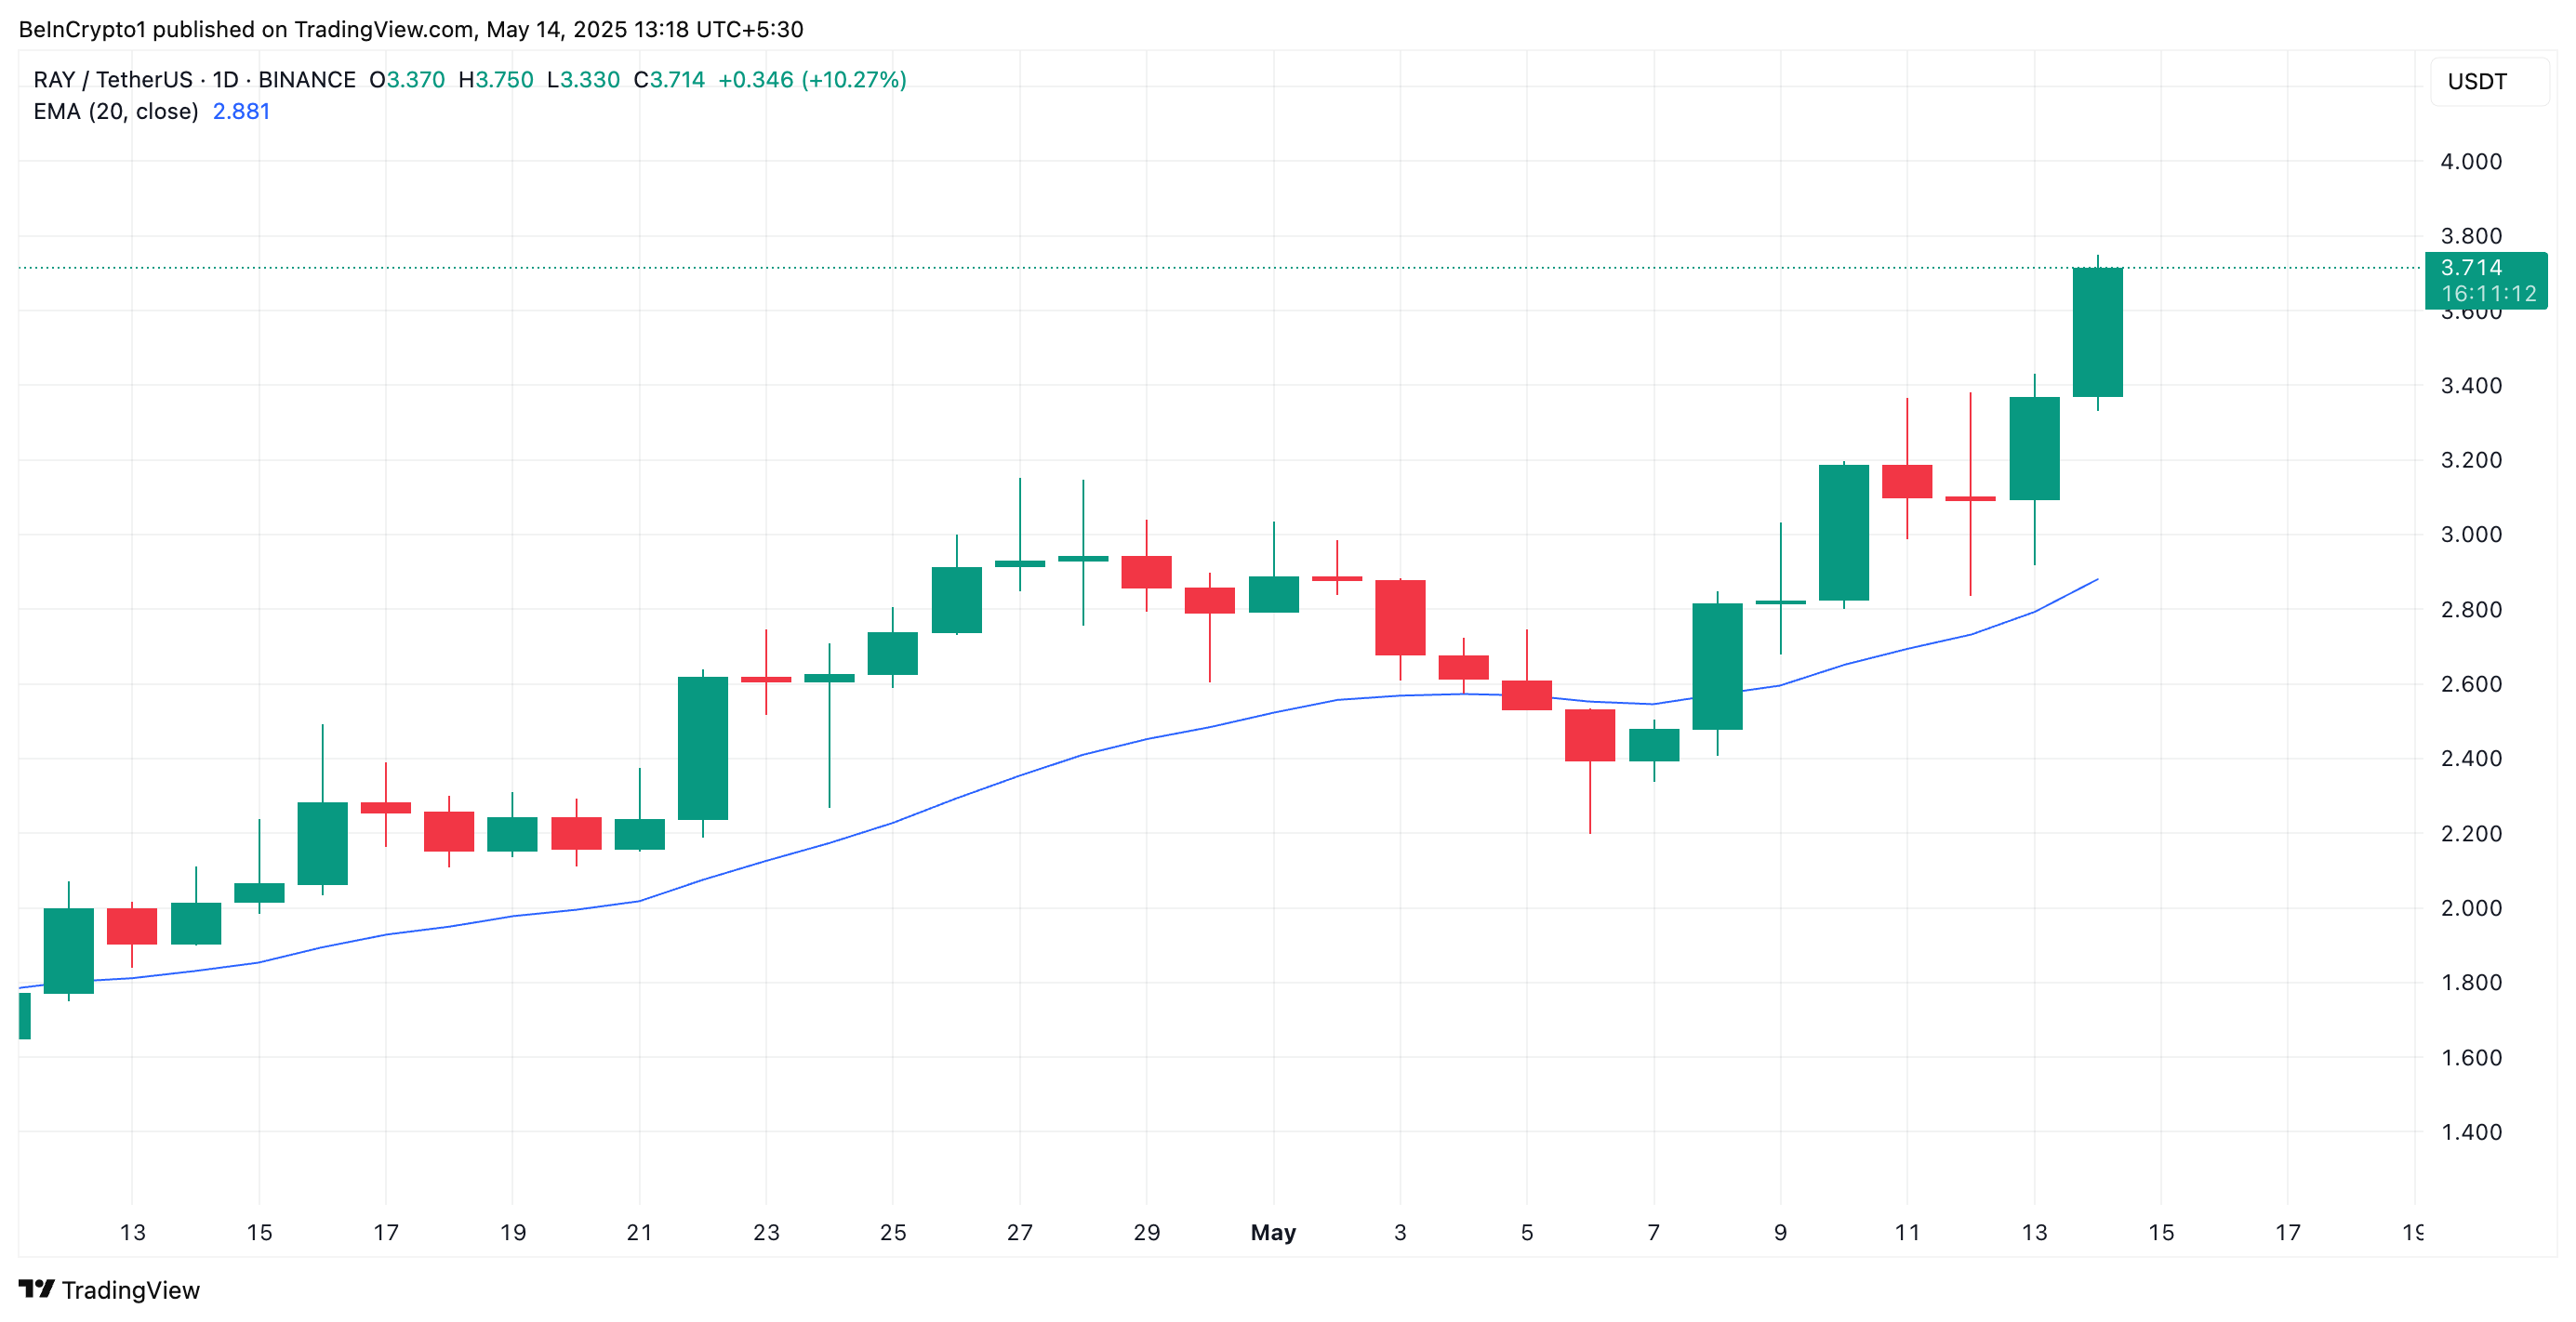
An asset’s 20-day EMA measures its average price over the past 20 trading days, giving weight to recent prices. As with RAY, when an asset’s price trades above its 20-day EMA, short-term momentum is bullish, and buyers are in control. This signal suggests continued upward movement, especially if the token’s price consistently holds above that level.
Further, RAY’s Super Trend indicator, which rests below its price, adds to the bullish outlook. This indicator helps traders identify the market’s direction by placing a line above or below the price chart based on the asset’s volatility.
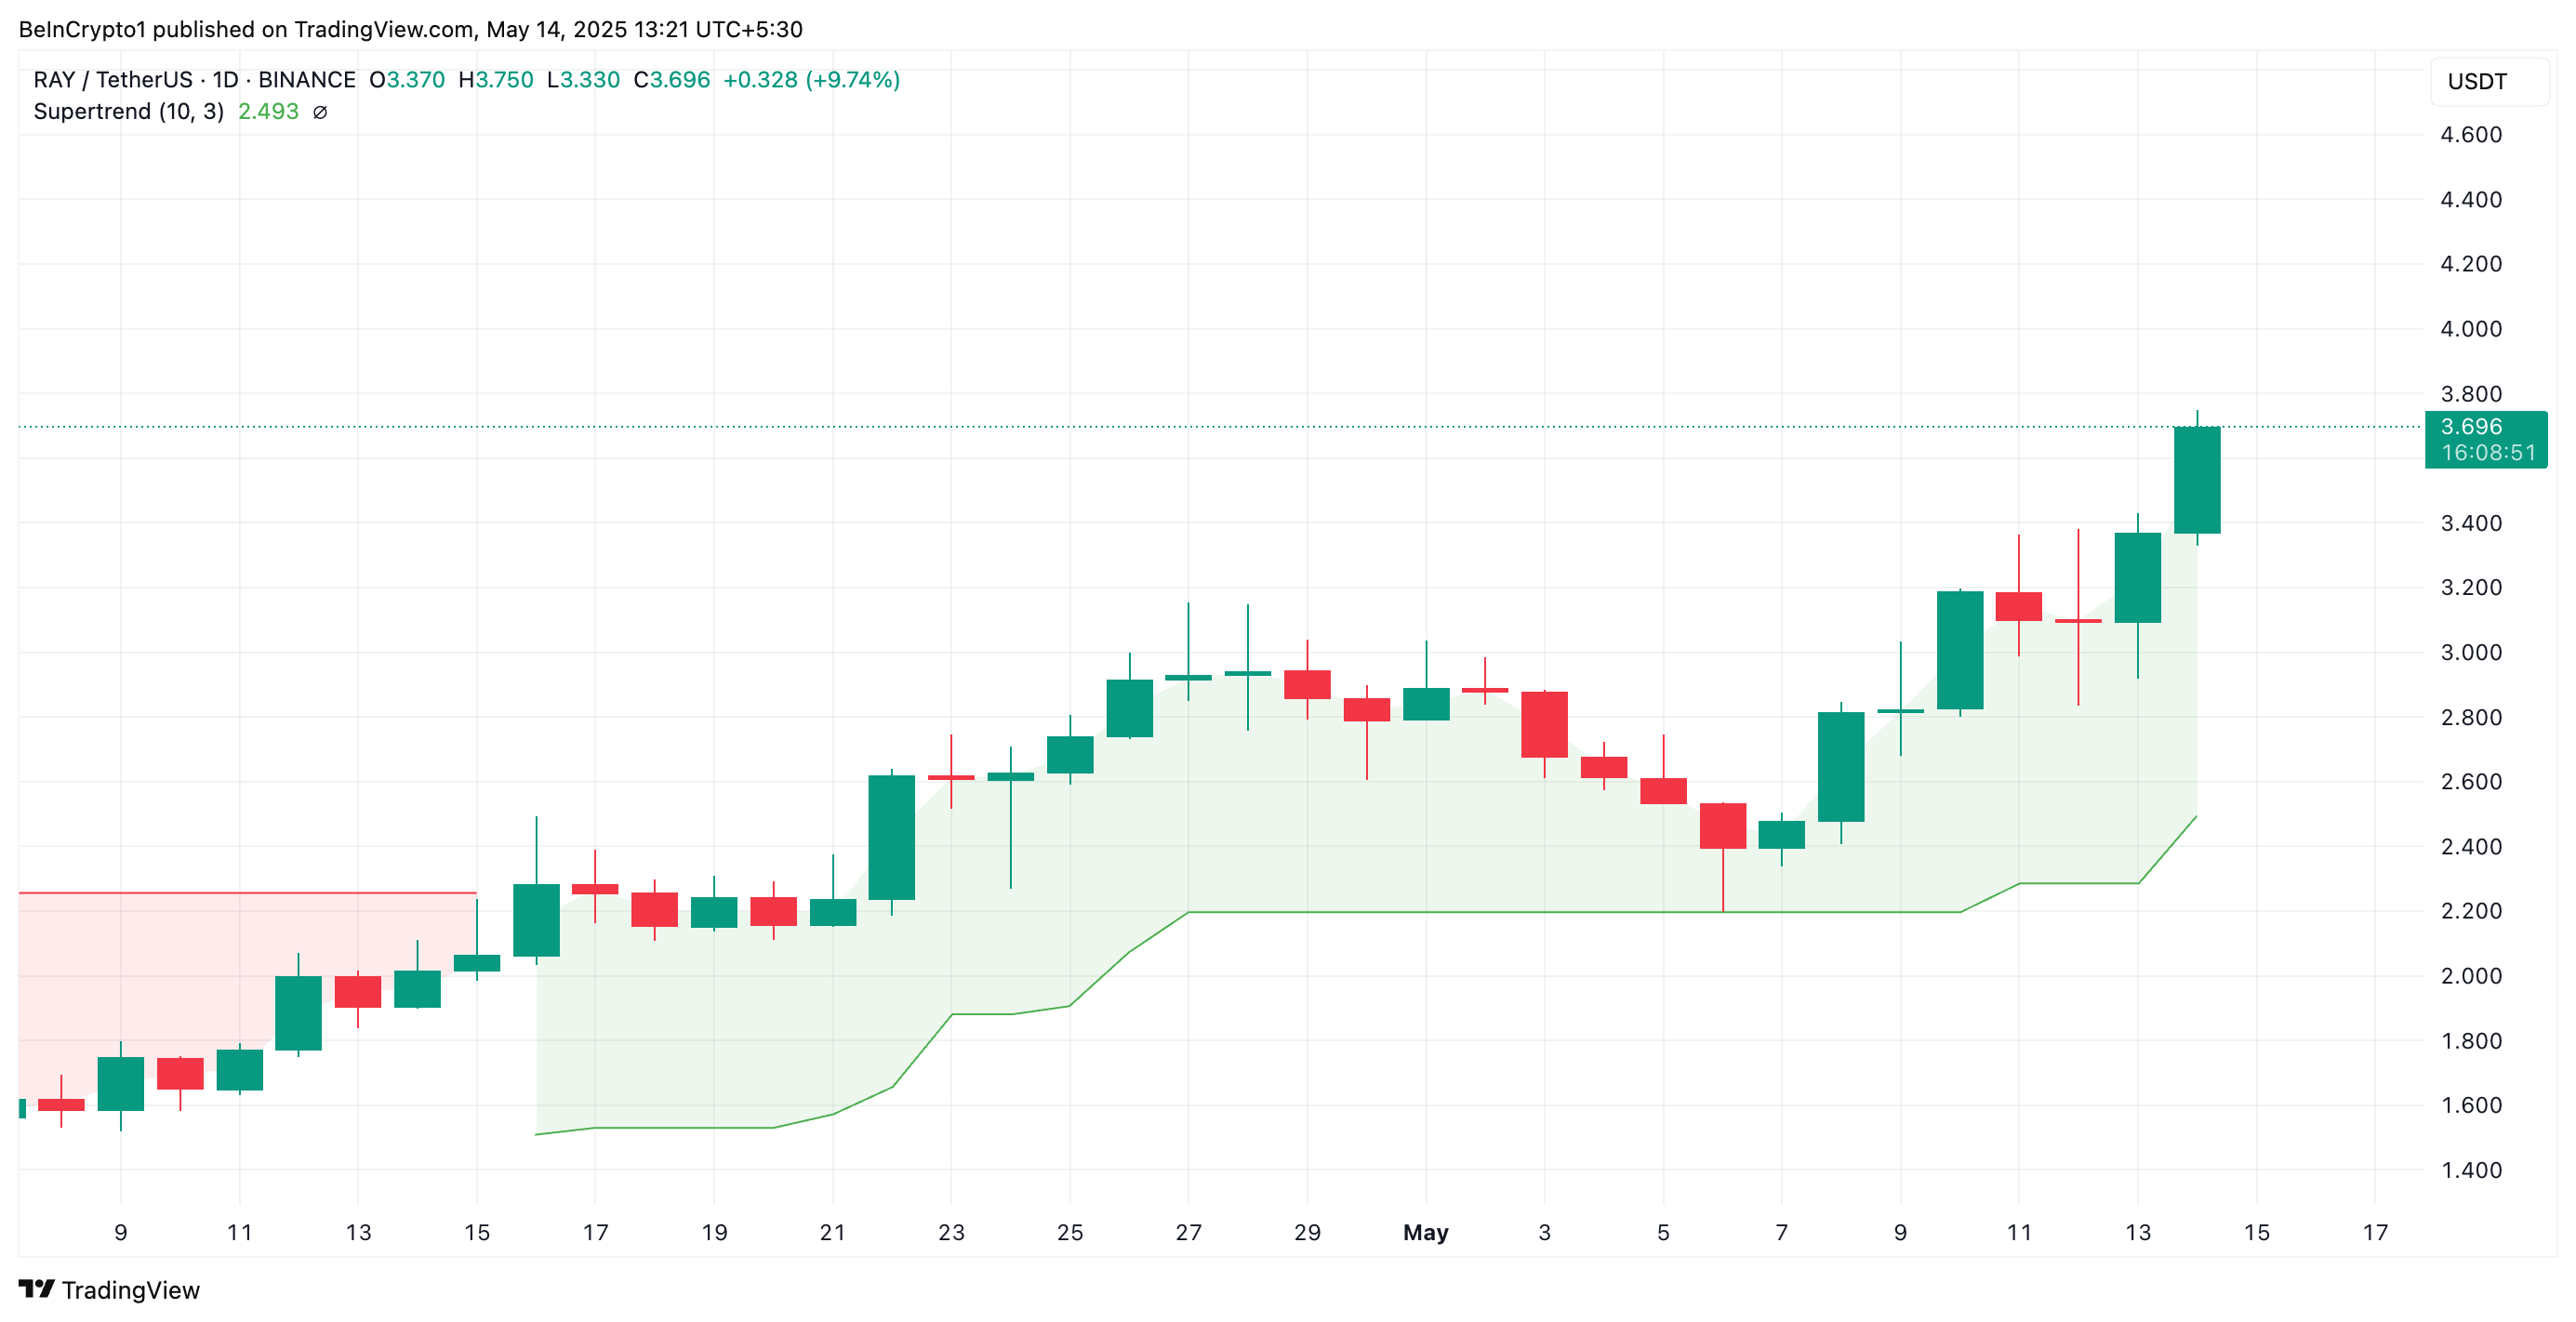
When an asset’s price trades below the Super Trend line, it signals a bearish trend, indicating that the market is in a downtrend and selling pressure is dominant.
Conversely, when the line is below an asset’s price, the market is bullish, with buying pressure exceeding selloffs among market participants. This confirms the demand for RAY and hints at a sustained rally if buying activity is maintained.
Will Resistance or Profit-Taking Win?
Thanks to its double-digit rally over the past day, RAY’s price has bounced off the support floor formed at $3.11. With strengthening bullish pressure, RAY could extend its gains and rally to $4.18.
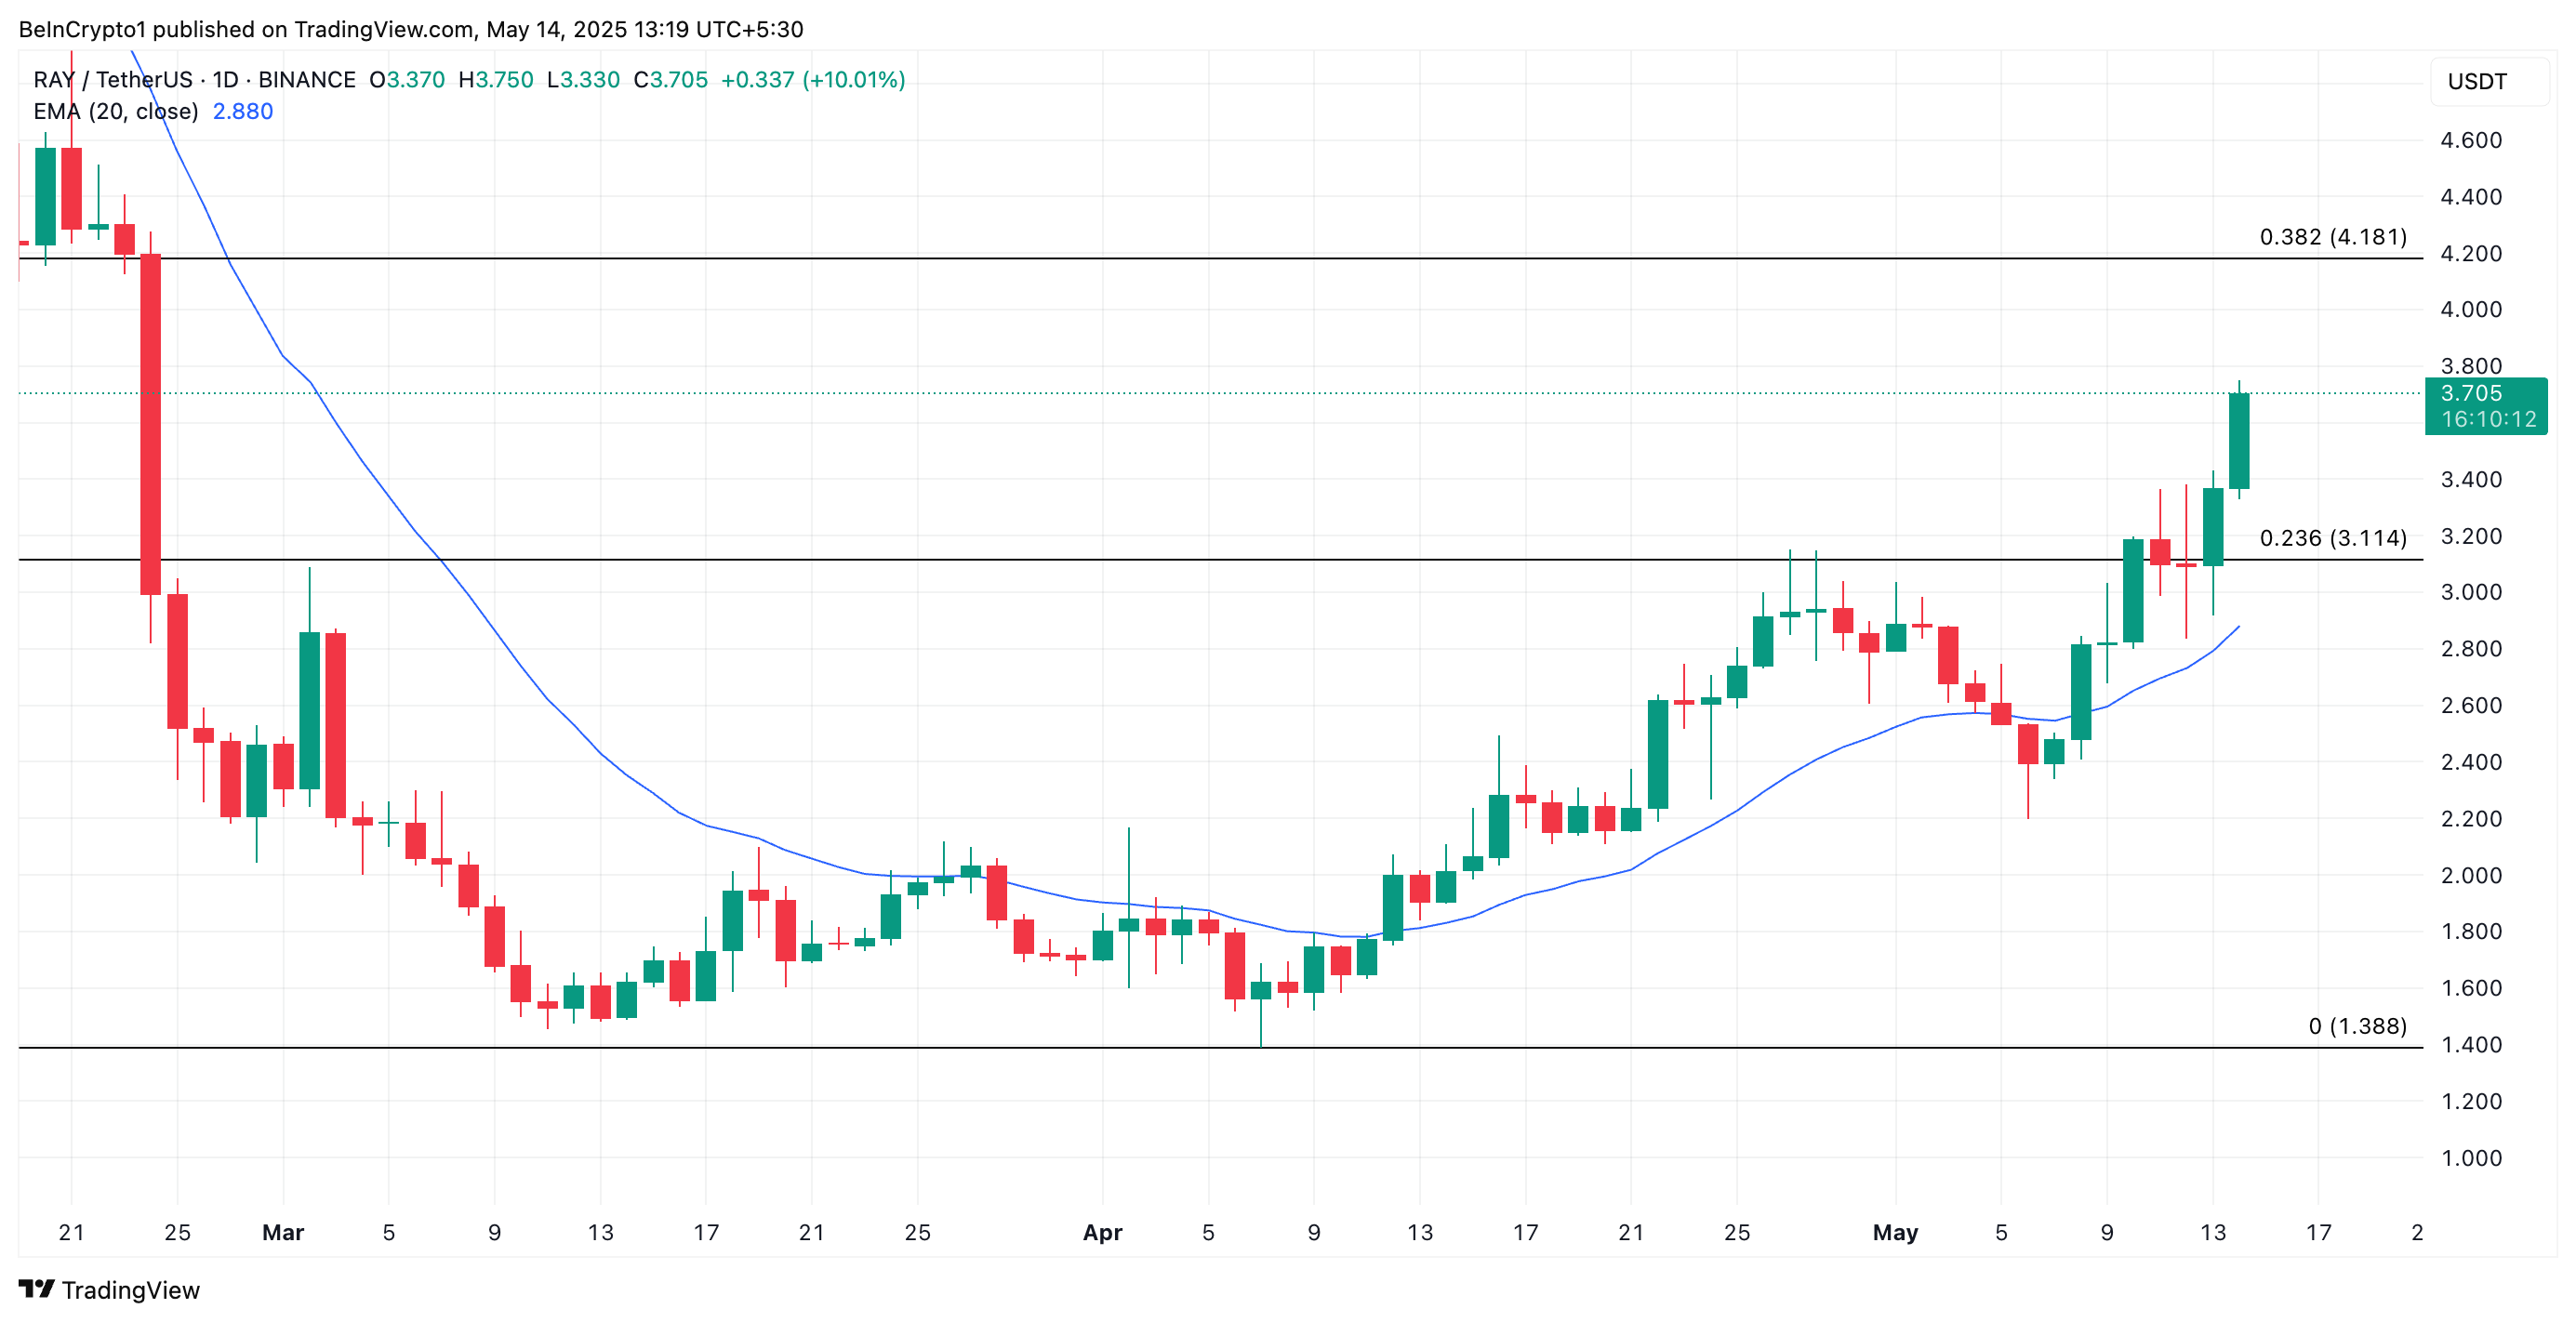
On the other hand, if traders resume profit-taking, this bullish projection will be invalidated. The RAY token price could fall to $3.11. If the bulls fail to defend this level, its decline could reach its 20-day EMA at $2.88.
