Solana’s 30% Surge Sparks $200 Breakout Bets—Greed or Inevitable?

Solana rockets 30% in a month, flirting with $200 as traders pile in. Meme coin mania and institutional whispers fuel the rally—but can it dodge the ’overbought’ bullet?
Technical indicators scream caution while momentum chasers FOMO. The real test? Holding gains when Wall Street ’experts’ suddenly remember volatility exists.
Solana Maintains Bullish Momentum on Ichimoku Cloud Breakout
Solana Ichimoku Cloud chart is currently showing a bullish structure. The price is trading well above the Kumo (cloud), which has turned green—signaling that momentum is favoring the bulls.
The Leading Span A (green cloud boundary) is above Leading Span B (red cloud boundary), confirming a positive trend.
Additionally, the price consistently holds above the Tenkan-sen (blue line) and Kijun-sen (red line), which indicates that short-term and medium-term support levels remain intact.
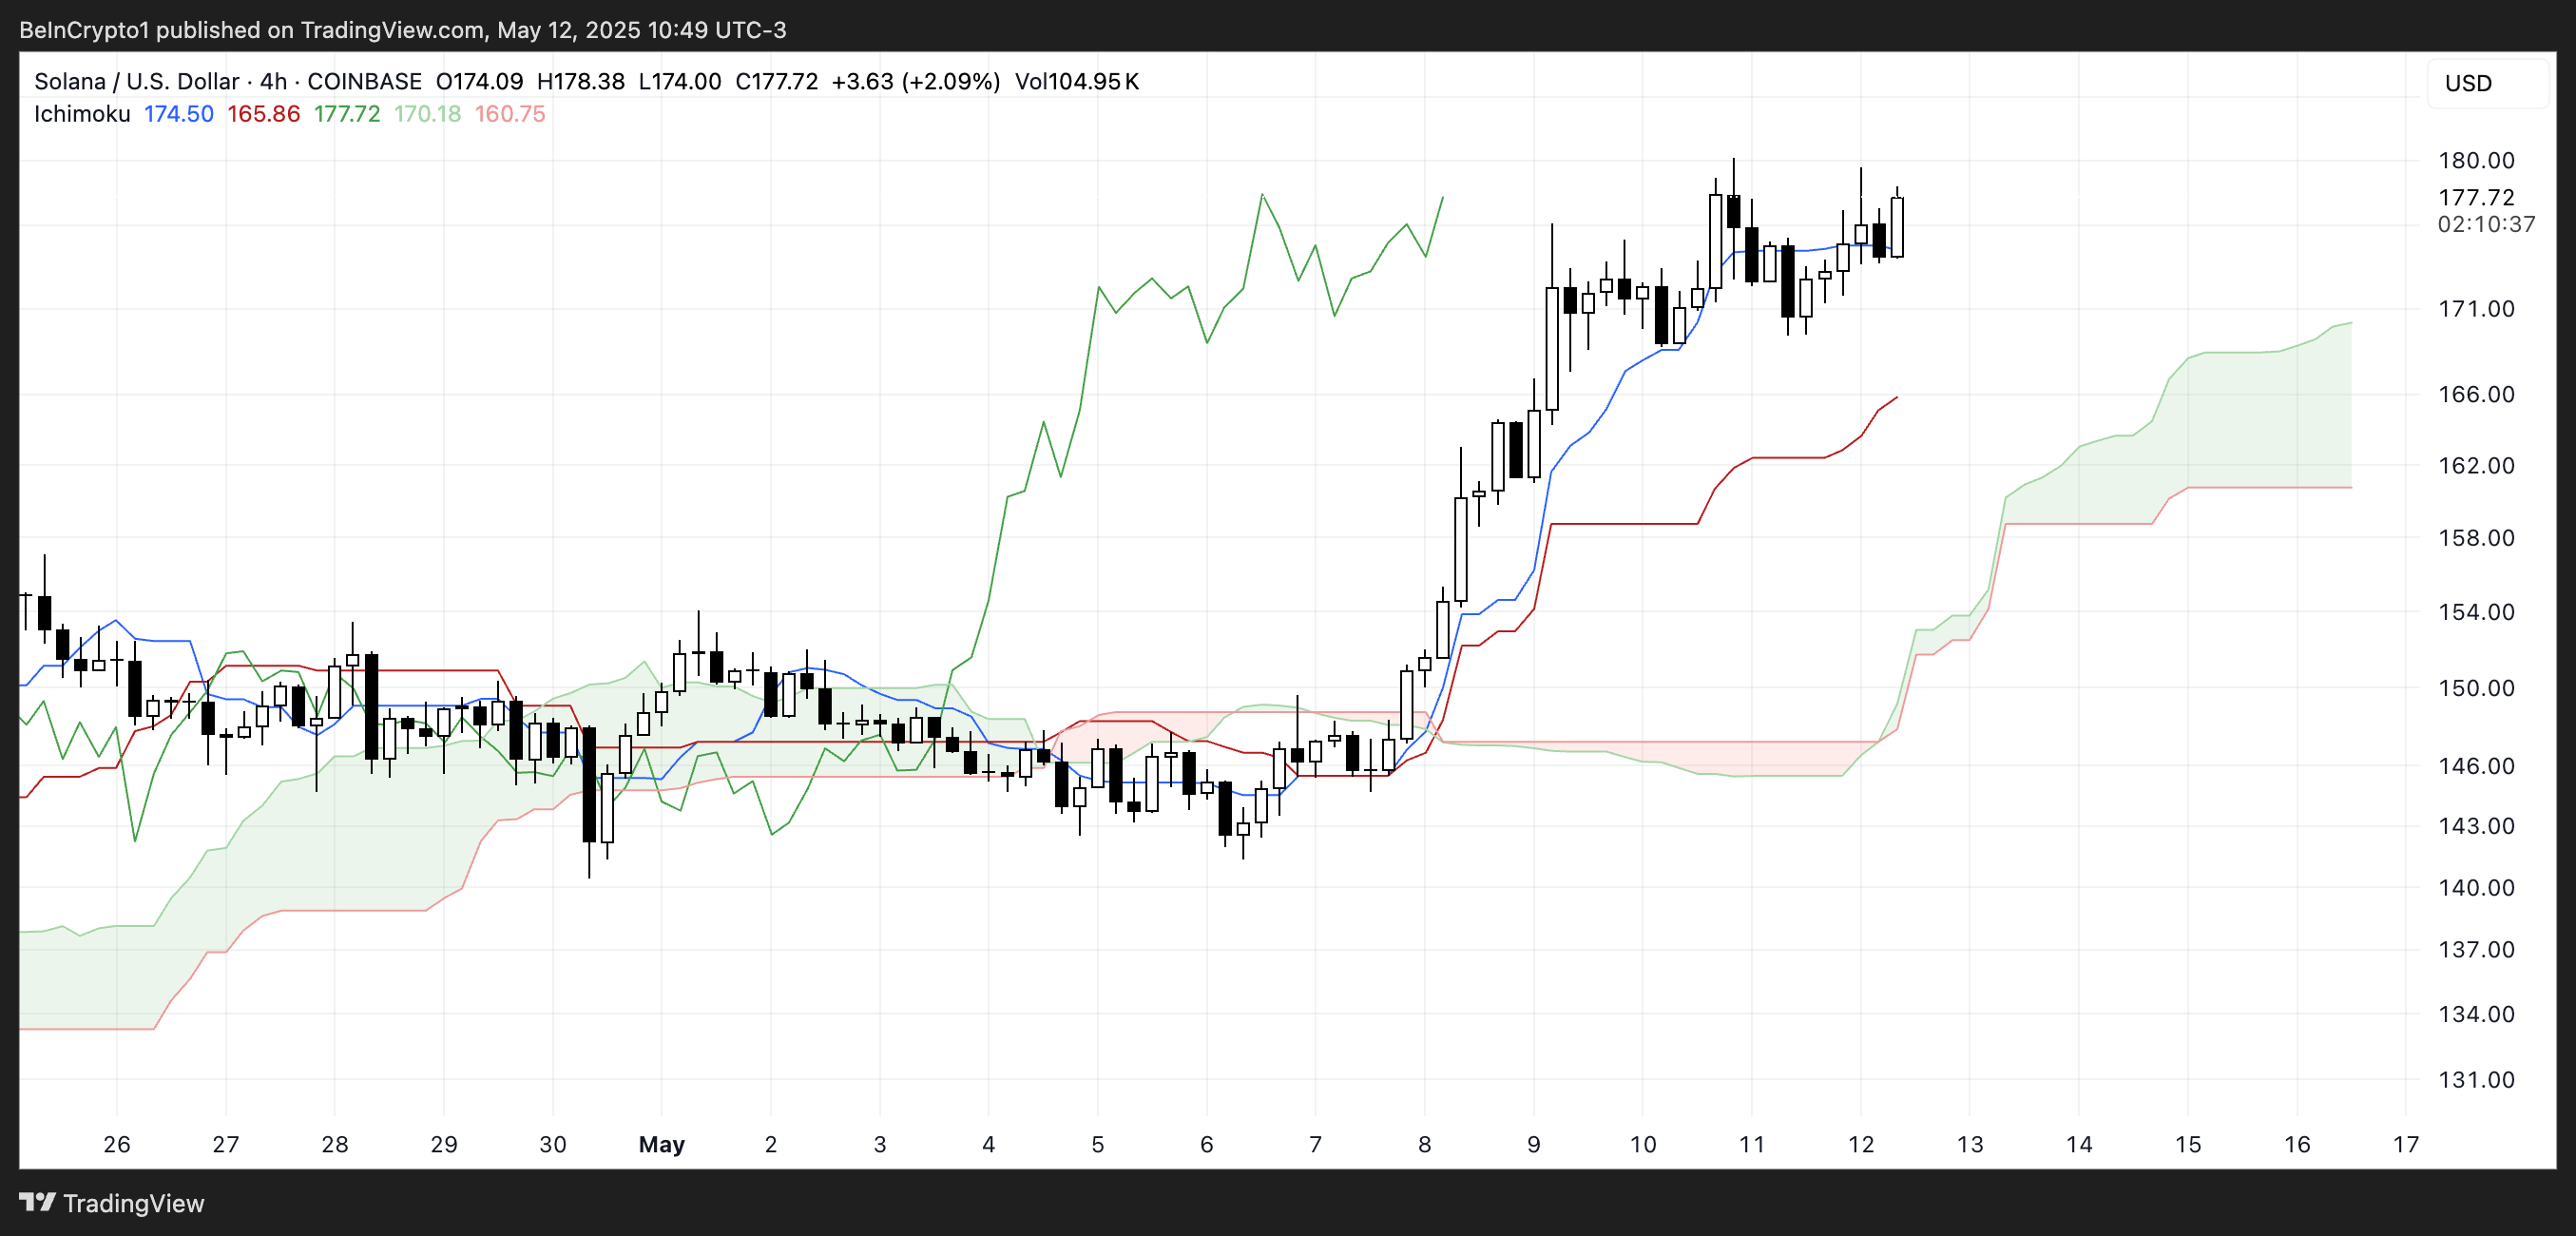
The Lagging Span (green line) is positioned above both the price and the cloud, which confirms the bullish bias further.
The wide gap between the current price and the cloud suggests strong bullish momentum with minimal resistance in the NEAR term.
As long as the price remains above the cloud and key support lines, the trend remains clearly upward. Despite the good momentum, large transfers and unstaking from major wallets, including FTX/Alameda and Pump.fun, have sparked fears of a possible sell-off following SOL’s rapid price surge.
SOL BBTrend Holds Around 16.7, Confirming Strong Bullish Momentum
Solana’s BBTrend (Bollinger Band Trend) indicator has surged sharply from -0.41 to 16.76 in just two days, indicating a strong shift from a consolidating or bearish phase into clear bullish territory.
BBTrend measures the distance between the price and the Bollinger Band centerline, helping identify the strength of a trend. Values above 0 suggest bullish conditions, while negative values point to potential downtrends or sideways movement.
A move as sharp as this signals that SOL has entered a phase of expanding volatility with upward momentum.
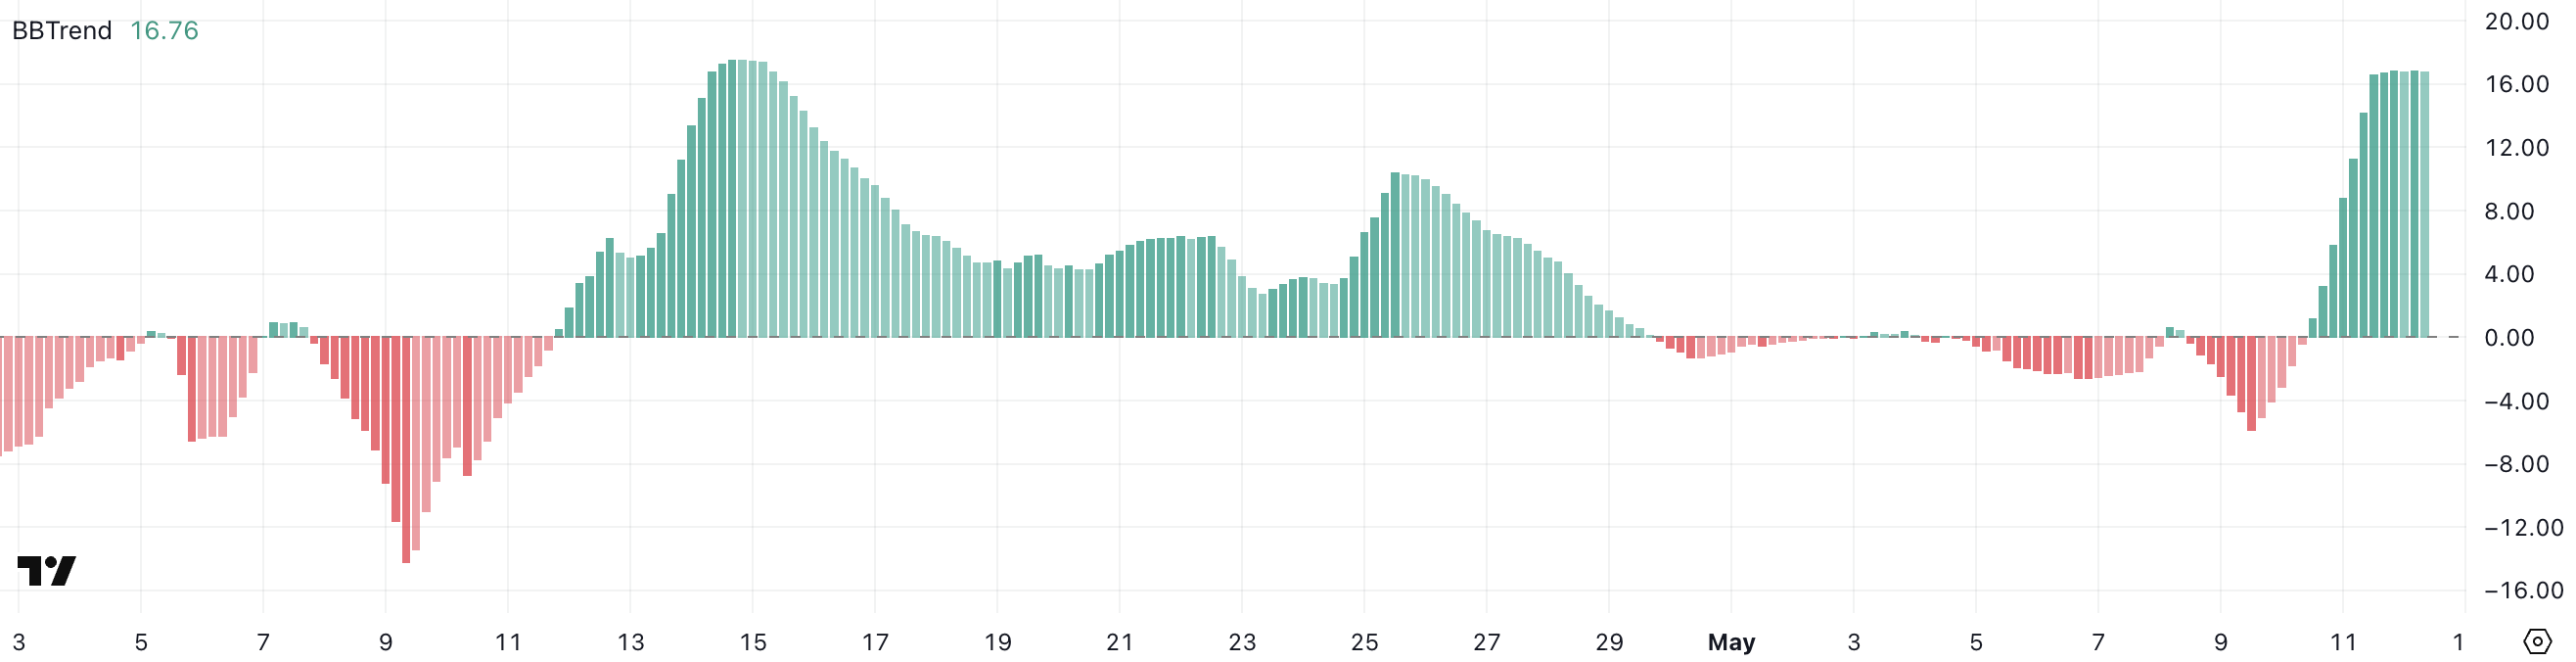
The BBTrend has stabilized around the 16.7 level over the last several hours, suggesting that the strong bullish impulse may now be consolidating.
This could imply two potential scenarios: continued upward movement if momentum builds again, or a cooling-off period as traders assess recent gains.
The sustained high BBTrend value reflects strong trend strength, and unless there’s a sharp reversal, SOL’s price action will likely remain favorable in the short term.
SOL Eyes Break Above $200 as EMA Lines Signal Strength
Solana price is trading just below a key resistance level at $180.54, a zone that has capped its upward movement in recent sessions.
The EMA lines show a clear bullish structure, with short-term averages positioned well above the long-term ones and maintaining healthy separation, indicating a strong and sustained uptrend.
If SOL breaks through this resistance and maintains momentum, it could climb toward $205, marking its first move above $200 since February 10.
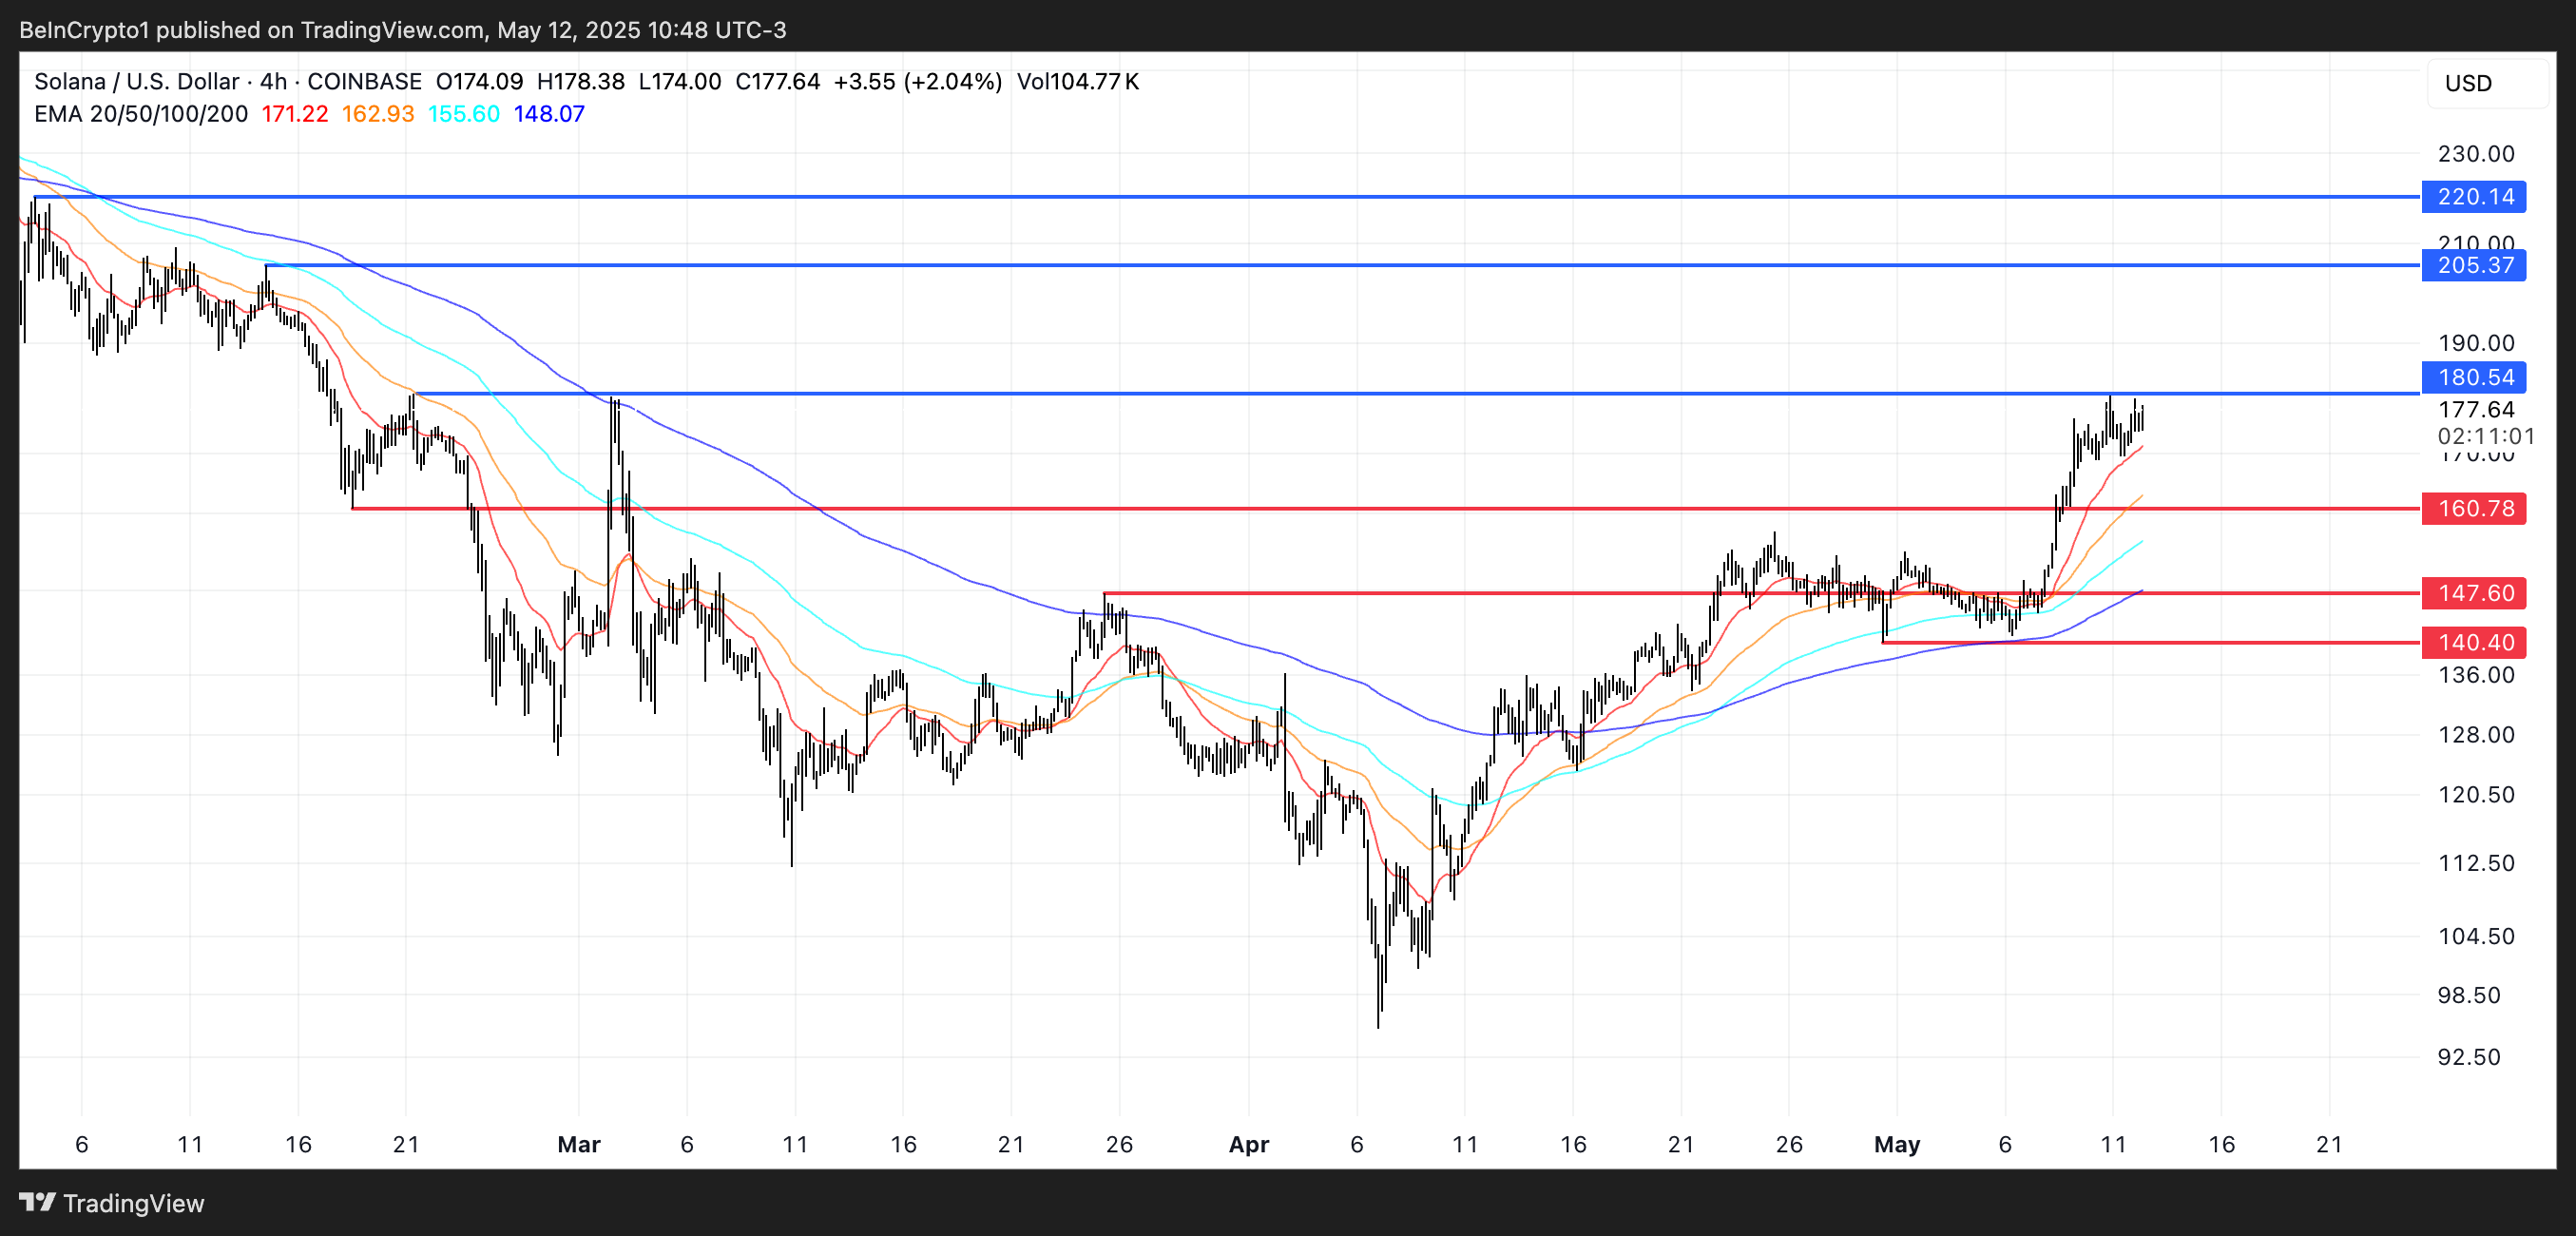
A continued breakout beyond that could take the price to $220, representing a possible 24% upside from current levels.
On the downside, traders should watch the $160.78 support closely. A breakdown below that level WOULD signal weakening momentum and push SOL to $147.6.
If bearish pressure intensifies and support fails, the next key level sits at $140.4.
