XRP Shatters Resistance—Is This the Start of the Next Crypto Bull Market?

After months of sideways action, XRP just blasted through key technical levels—and traders are scrambling to reposition. The 30% surge this week smells like early-stage FOMO, but here’s what the charts aren’t telling you.
The breakout playbook: Volume spiked 200% above average as XRP cleared its 200-day moving average, a classic bull signal. Now, the $0.75 zone becomes the next battleground between bagholders and momentum traders.
Institutional whispers: Behind the scenes, OTC desks report hedge funds accumulating XRP derivatives—probably because they’ve exhausted their usual ’long BTC, short altcoins’ strategy that stopped working in Q1.
Cynical take: Nothing rallies a crypto like impending regulatory clarity... or was that another ’partnership announcement’ with a fintech startup that’ll pivot to NFTs in six months?
Whether this is the real deal or another fakeout, one thing’s certain: The alts are waking up—and the leverage traders are already overexposed.
XRP Clears Key Resistance—Technical Indicators Point to More Upside
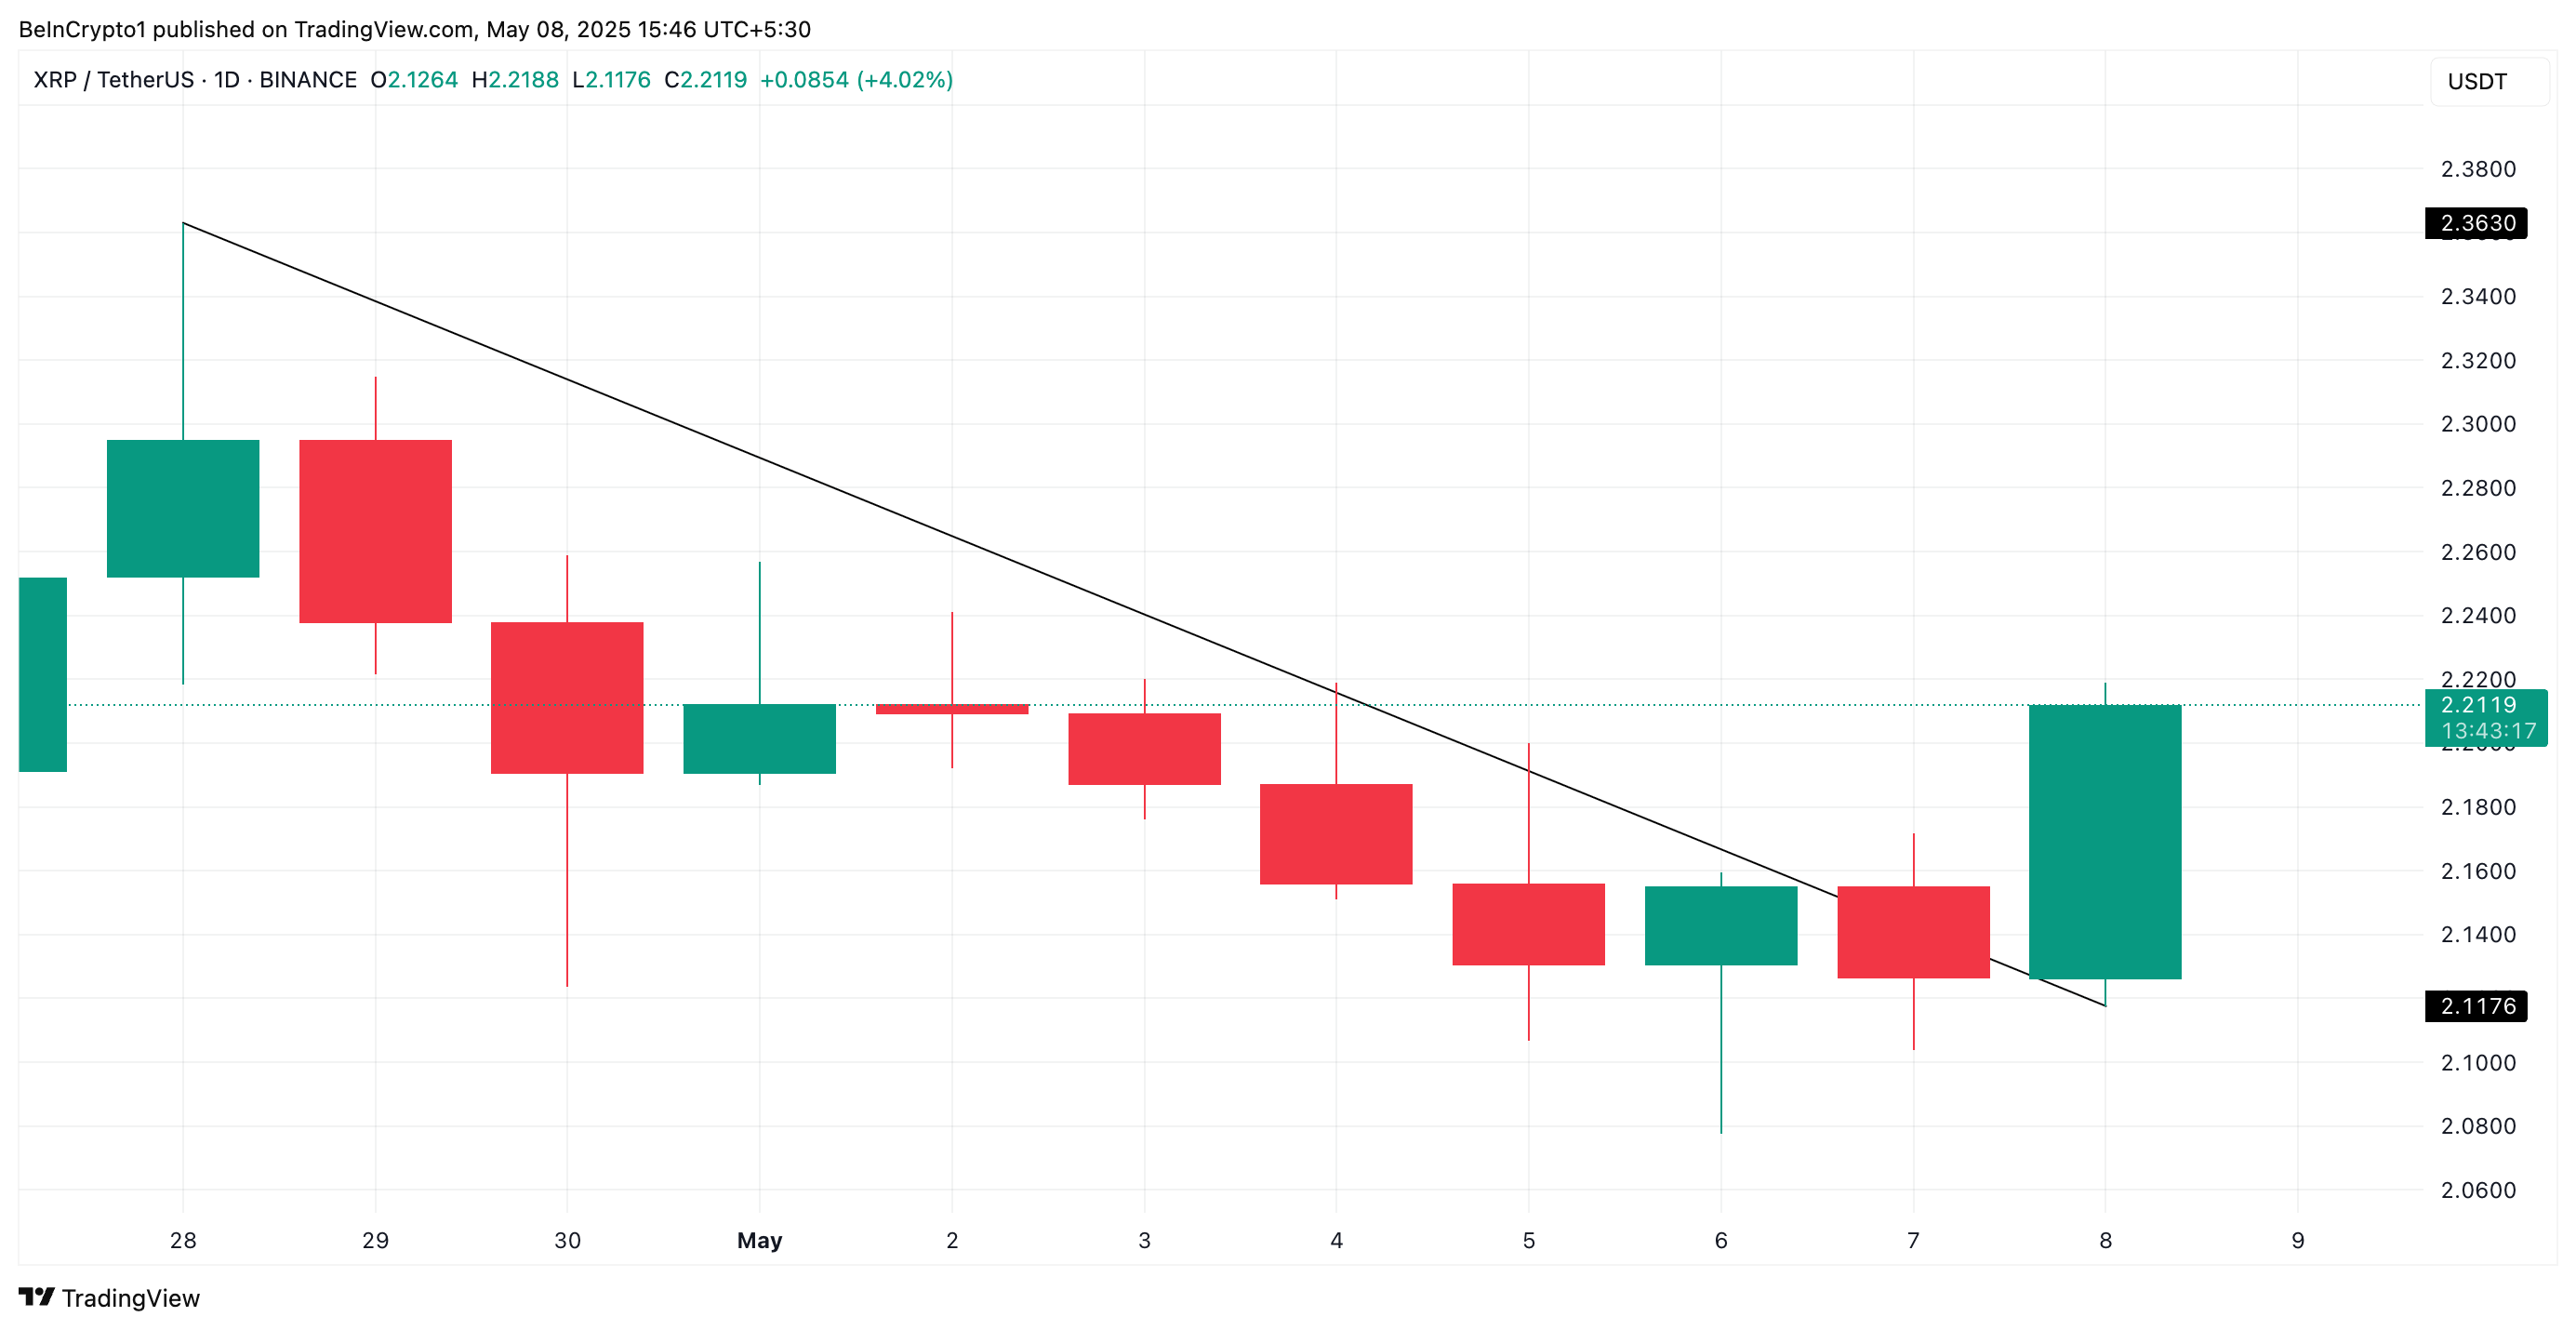
XRP has successfully broken above a descending trendline, overcoming a key resistance level that had capped its upside since the end of April. This MOVE signals a trend reversal and puts XRP in a favorable position for further gains.
Readings from XRP’s Relative Strength Index (RSI) support this bullish outlook. At press time, the momentum indicator is at 54.11, noting a steady uptick.
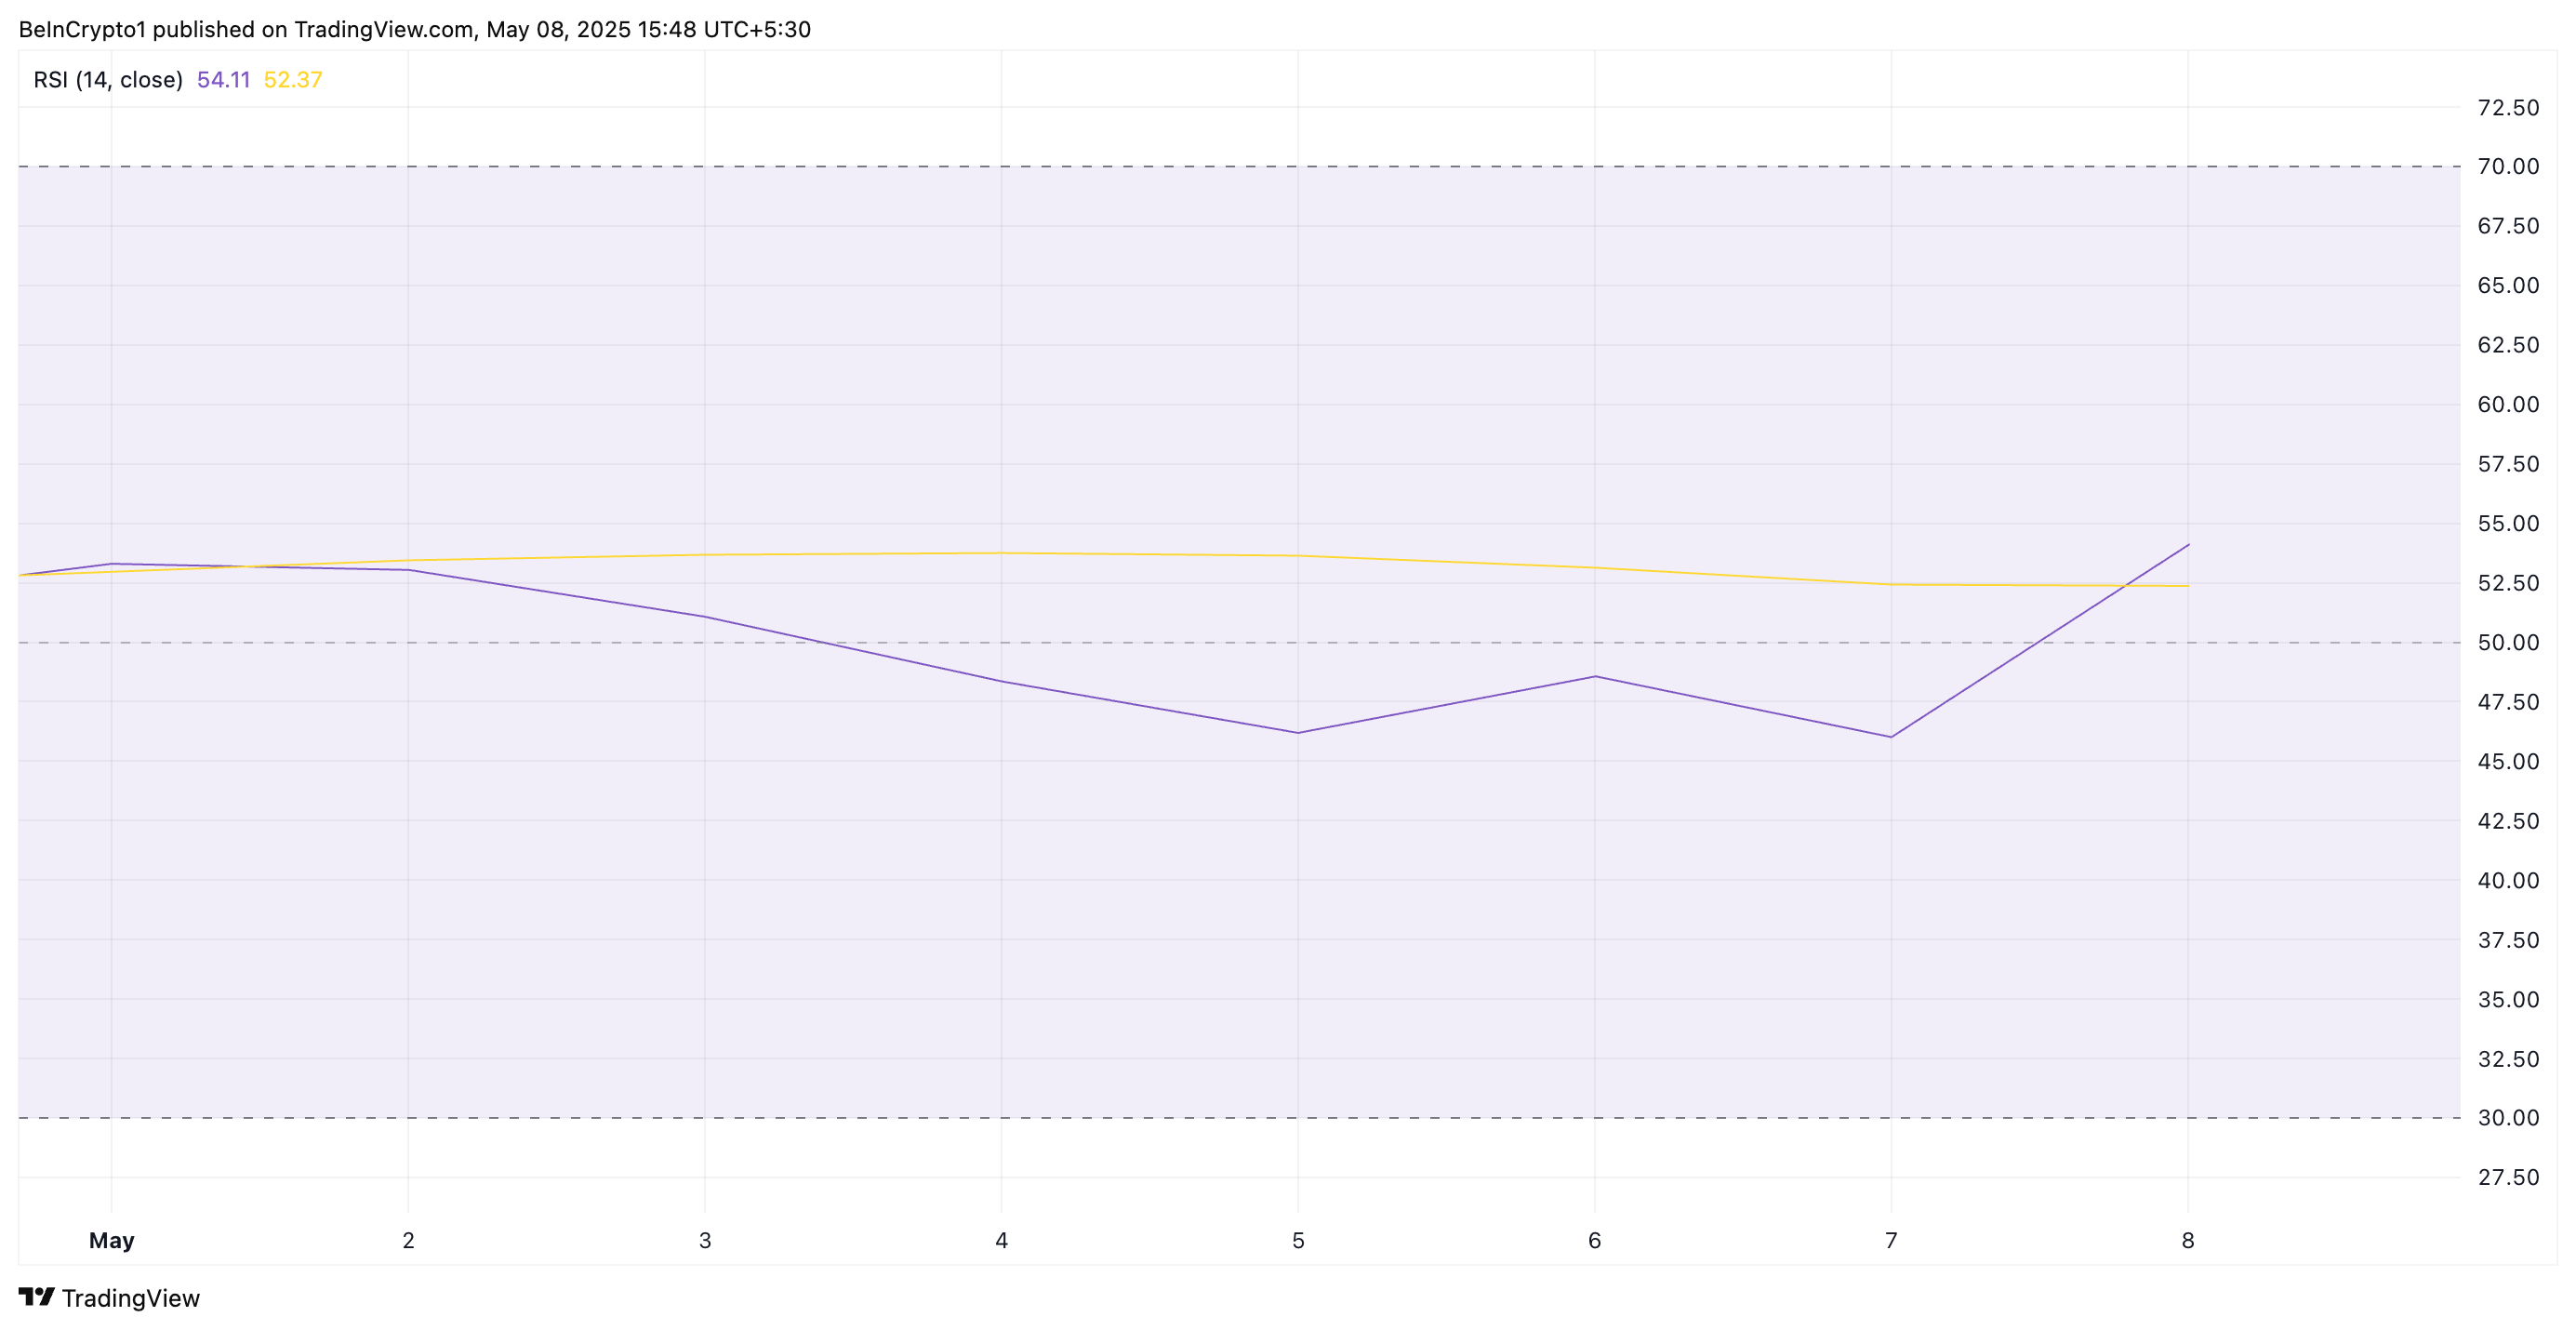
The RSI indicator gauges whether an asset is overbought or oversold. It ranges from 0 to 100, with readings above 70 typically signaling overbought conditions and a potential price decline. Conversely, values below 30 suggest the asset is oversold and may be due for a rebound.
At 54.11 and climbing, XRP’s RSI indicates that buying pressure is strengthening. It also hints at the likelihood of more gains before the token becomes overbought.
Likewise, XRP’s Balance of Power (BoP) returns a positive value at press time, highlighting the bullish bias toward the altcoin. It currently stands at 0.86.
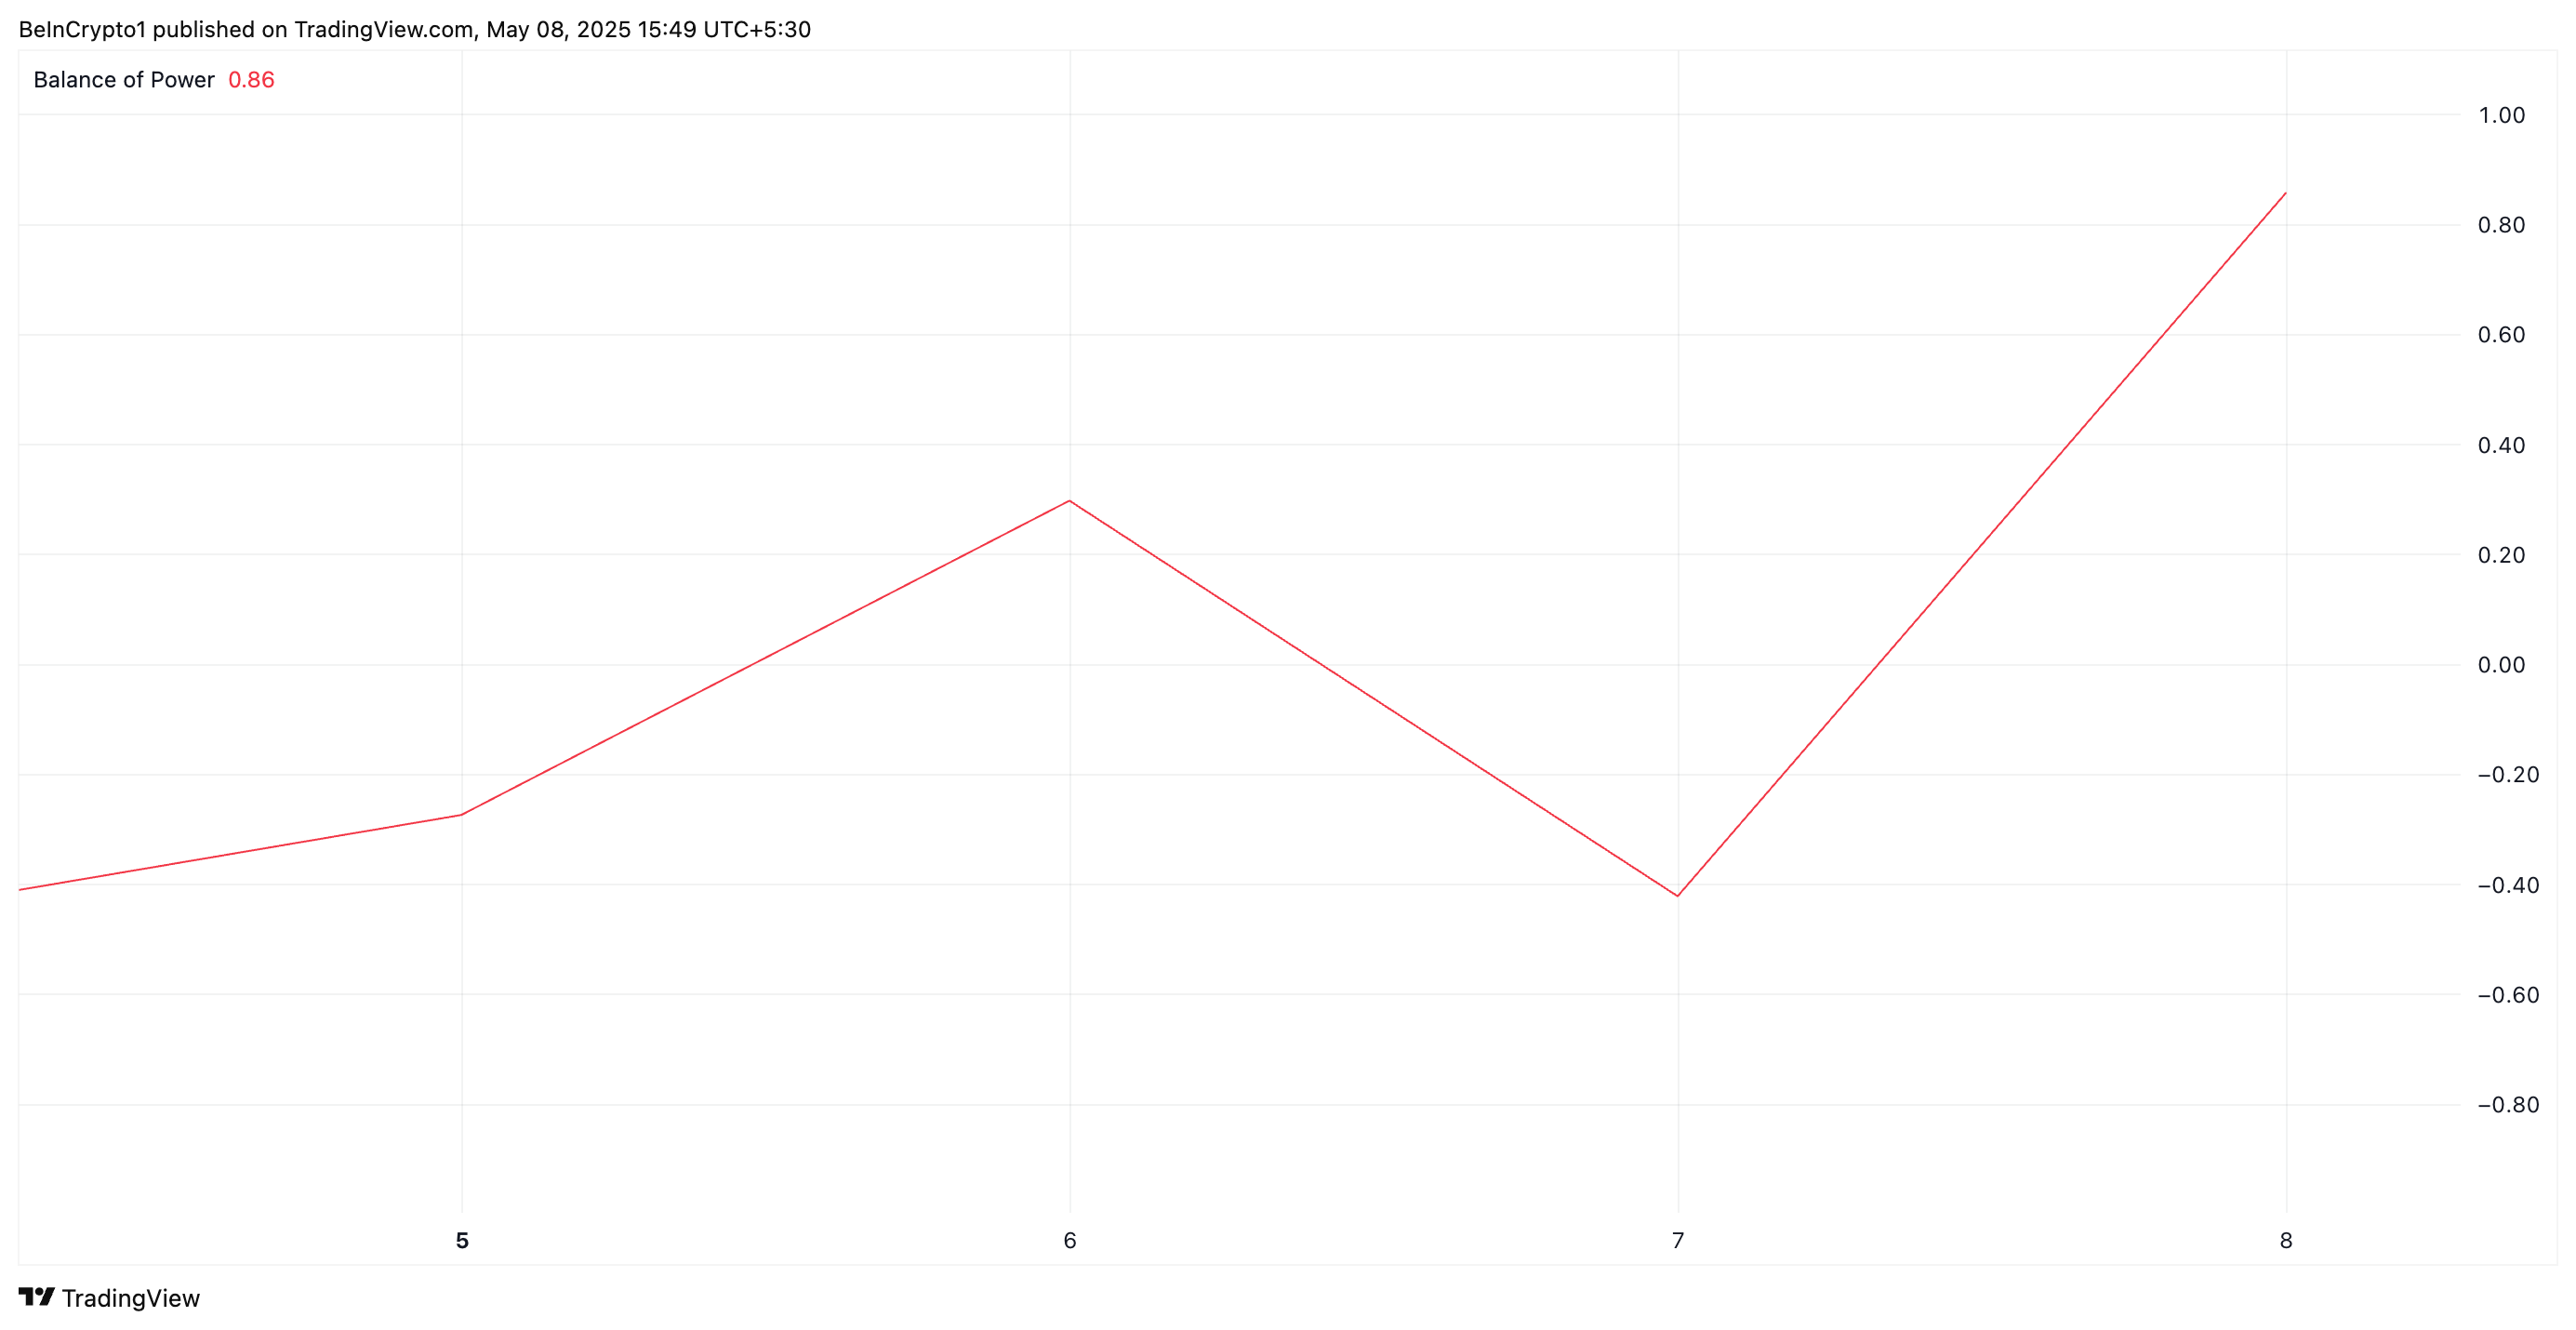
The BoP indicator measures the strength of buying versus selling pressure in an asset’s market. When it climbs this way, buyers dominate the spot markets. This indicates a potential bullish trend for the XRP token and suggests its upward momentum could continue.
XRP Bulls Eye $2.50 After Breakout
XRP rests solidly above the descending trend line at $2.21. If demand strengthens and the breakout sees more bullish momentum, it could drive the token’s price past the resistance at $2.29.
A successful breach of this price level could drive XRP to $2.50.
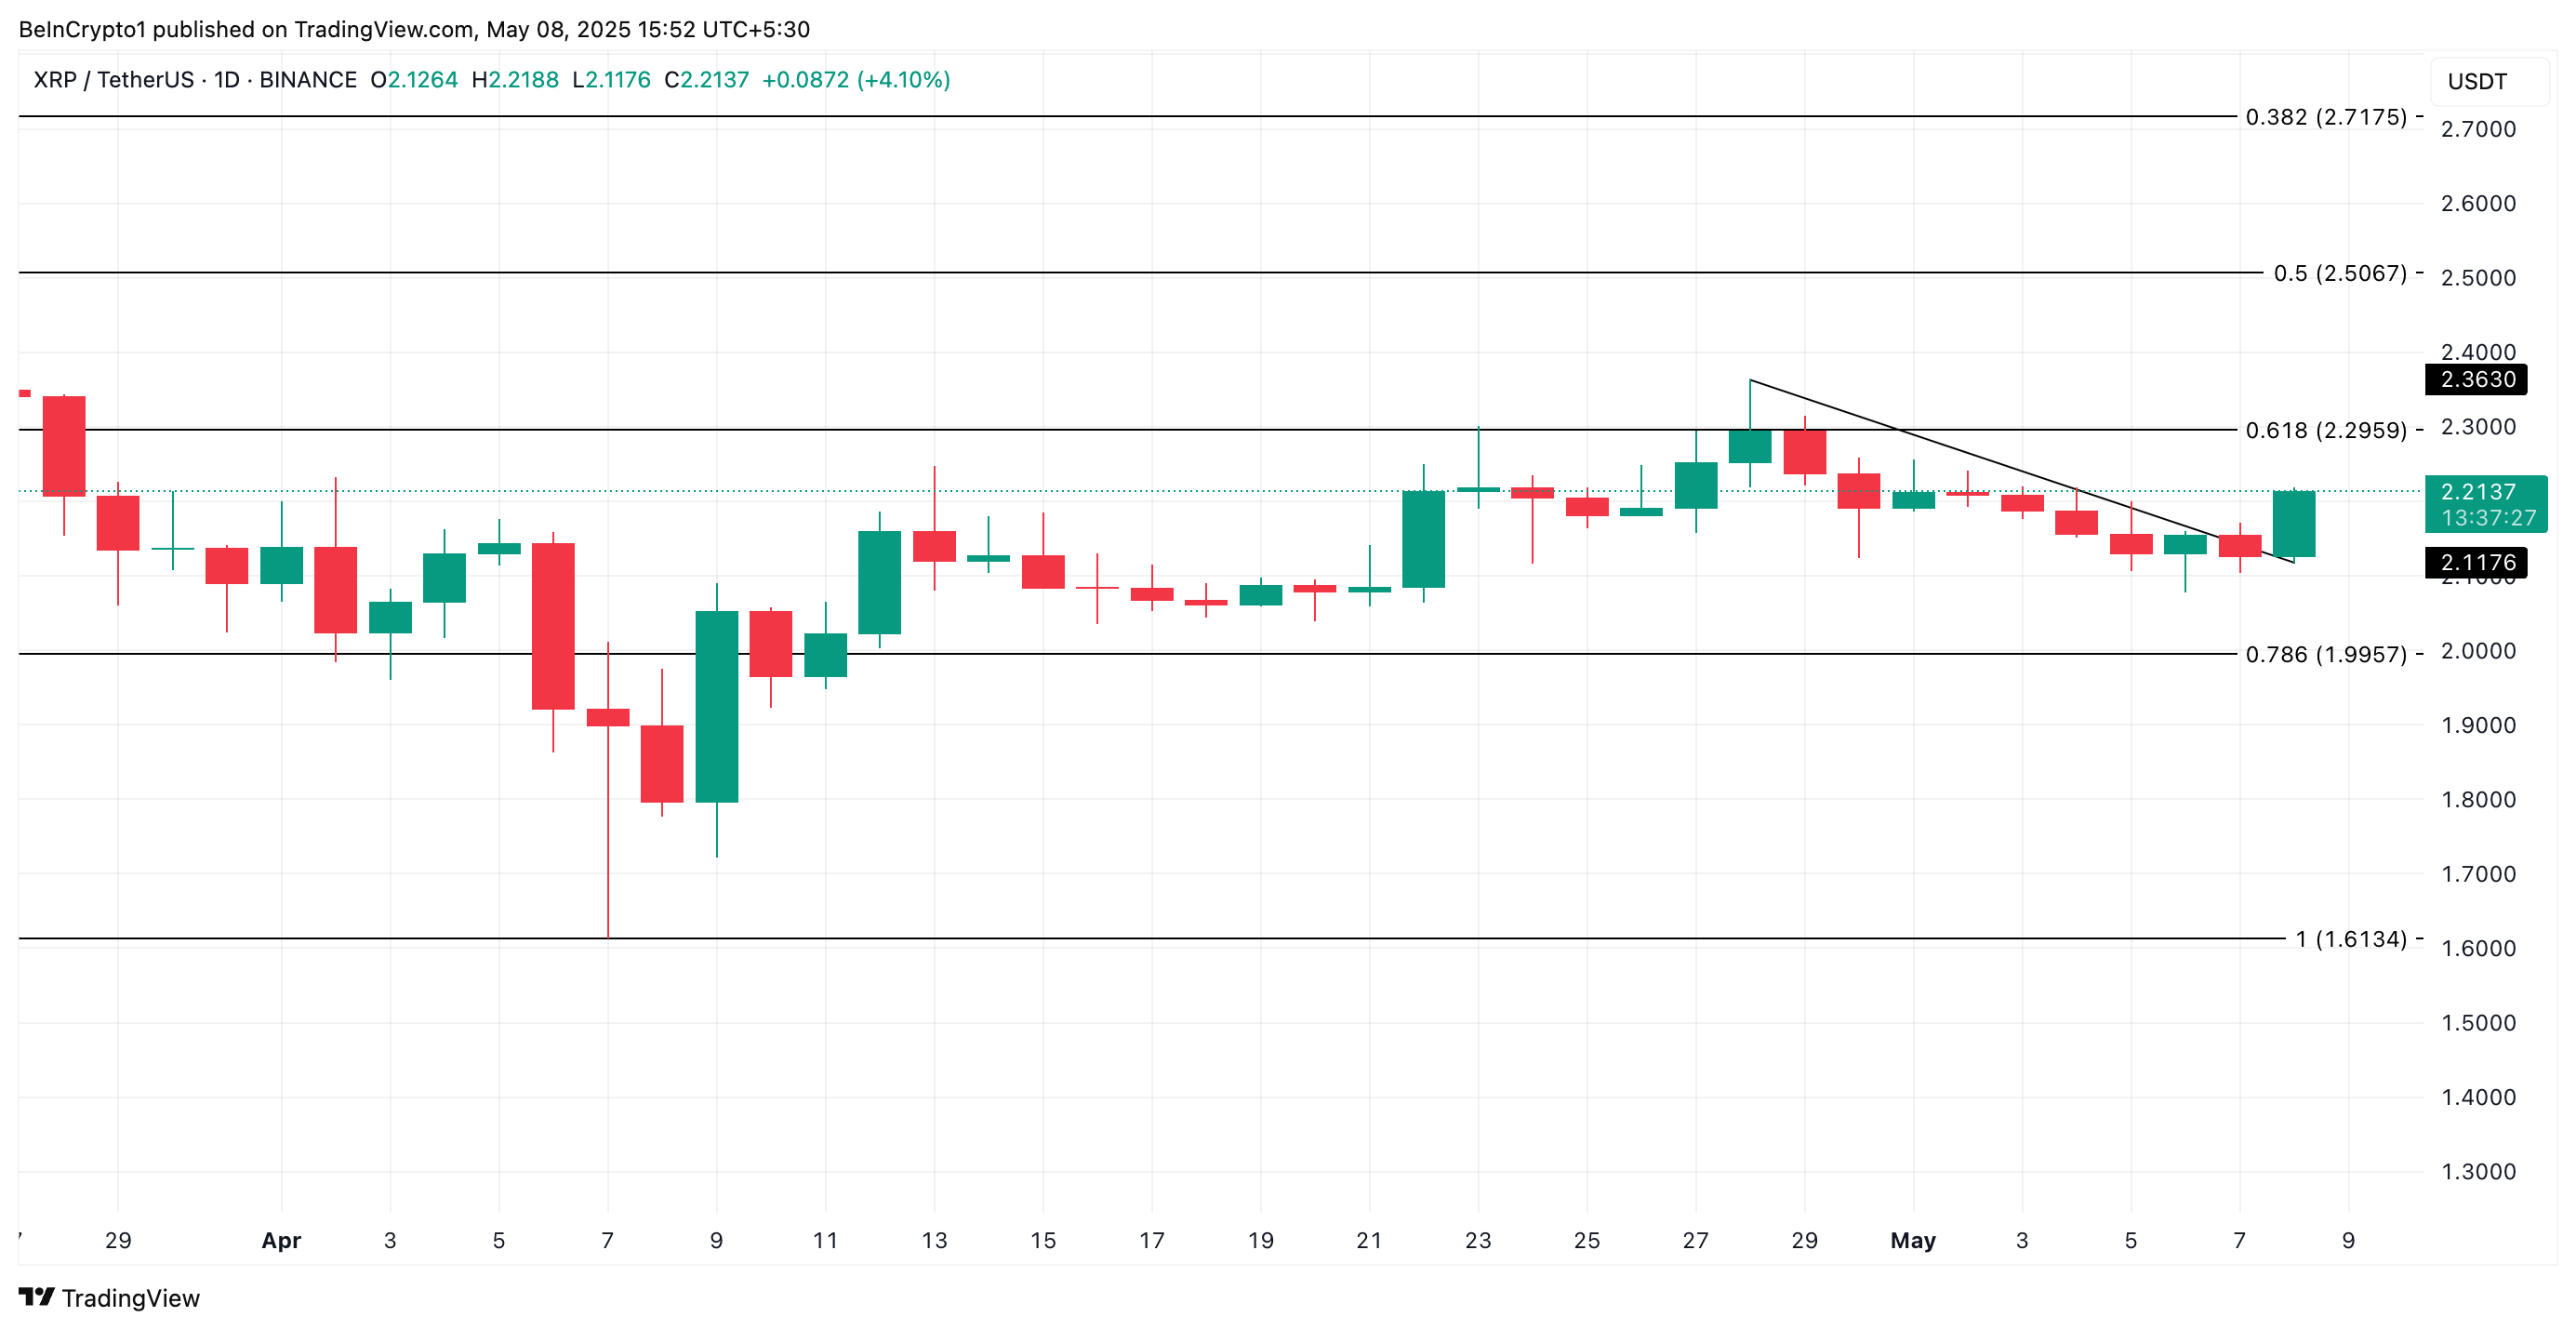
XRP Price Analysis. Source: TradingView
However, if buying stalls and XRP’s retest of the breakout line fails, it could fall to $1.99.

Log in to Reply
Log in to comment your thoughtsComments
Related Articles
|Square
Get the BTCC app to start your crypto journey
Get started today Scan to join our 100M+ users