Ethereum Bulls Charge Back—Buying Frenzy Hits 30-Day Peak

ETH’s bulls are back in the saddle—trading volume just spiked to its highest level this month. Are we seeing the calm before another leg up, or just another round of hopium for bagholders?
The second-largest crypto by market cap is flashing green as whales and retail traders pile in. Key resistance levels? Toasted. Short sellers? Getting squeezed. TradFi analysts? Still trying to explain why they called it ’dead’ three rallies ago.
With the Merge now ancient history and Layer 2 adoption surging, Ethereum’s fundamentals look stronger than your average banker’s alibi. But let’s see if the momentum holds once Wall Street wakes up and tries to short it with your pension fund.
Traders Eye ETH Upside as Buy Pressure and Build
According to CryptoQuant, ETH’s taker-buy-sell ratio is currently at 1.08, marking its highest value since early April.
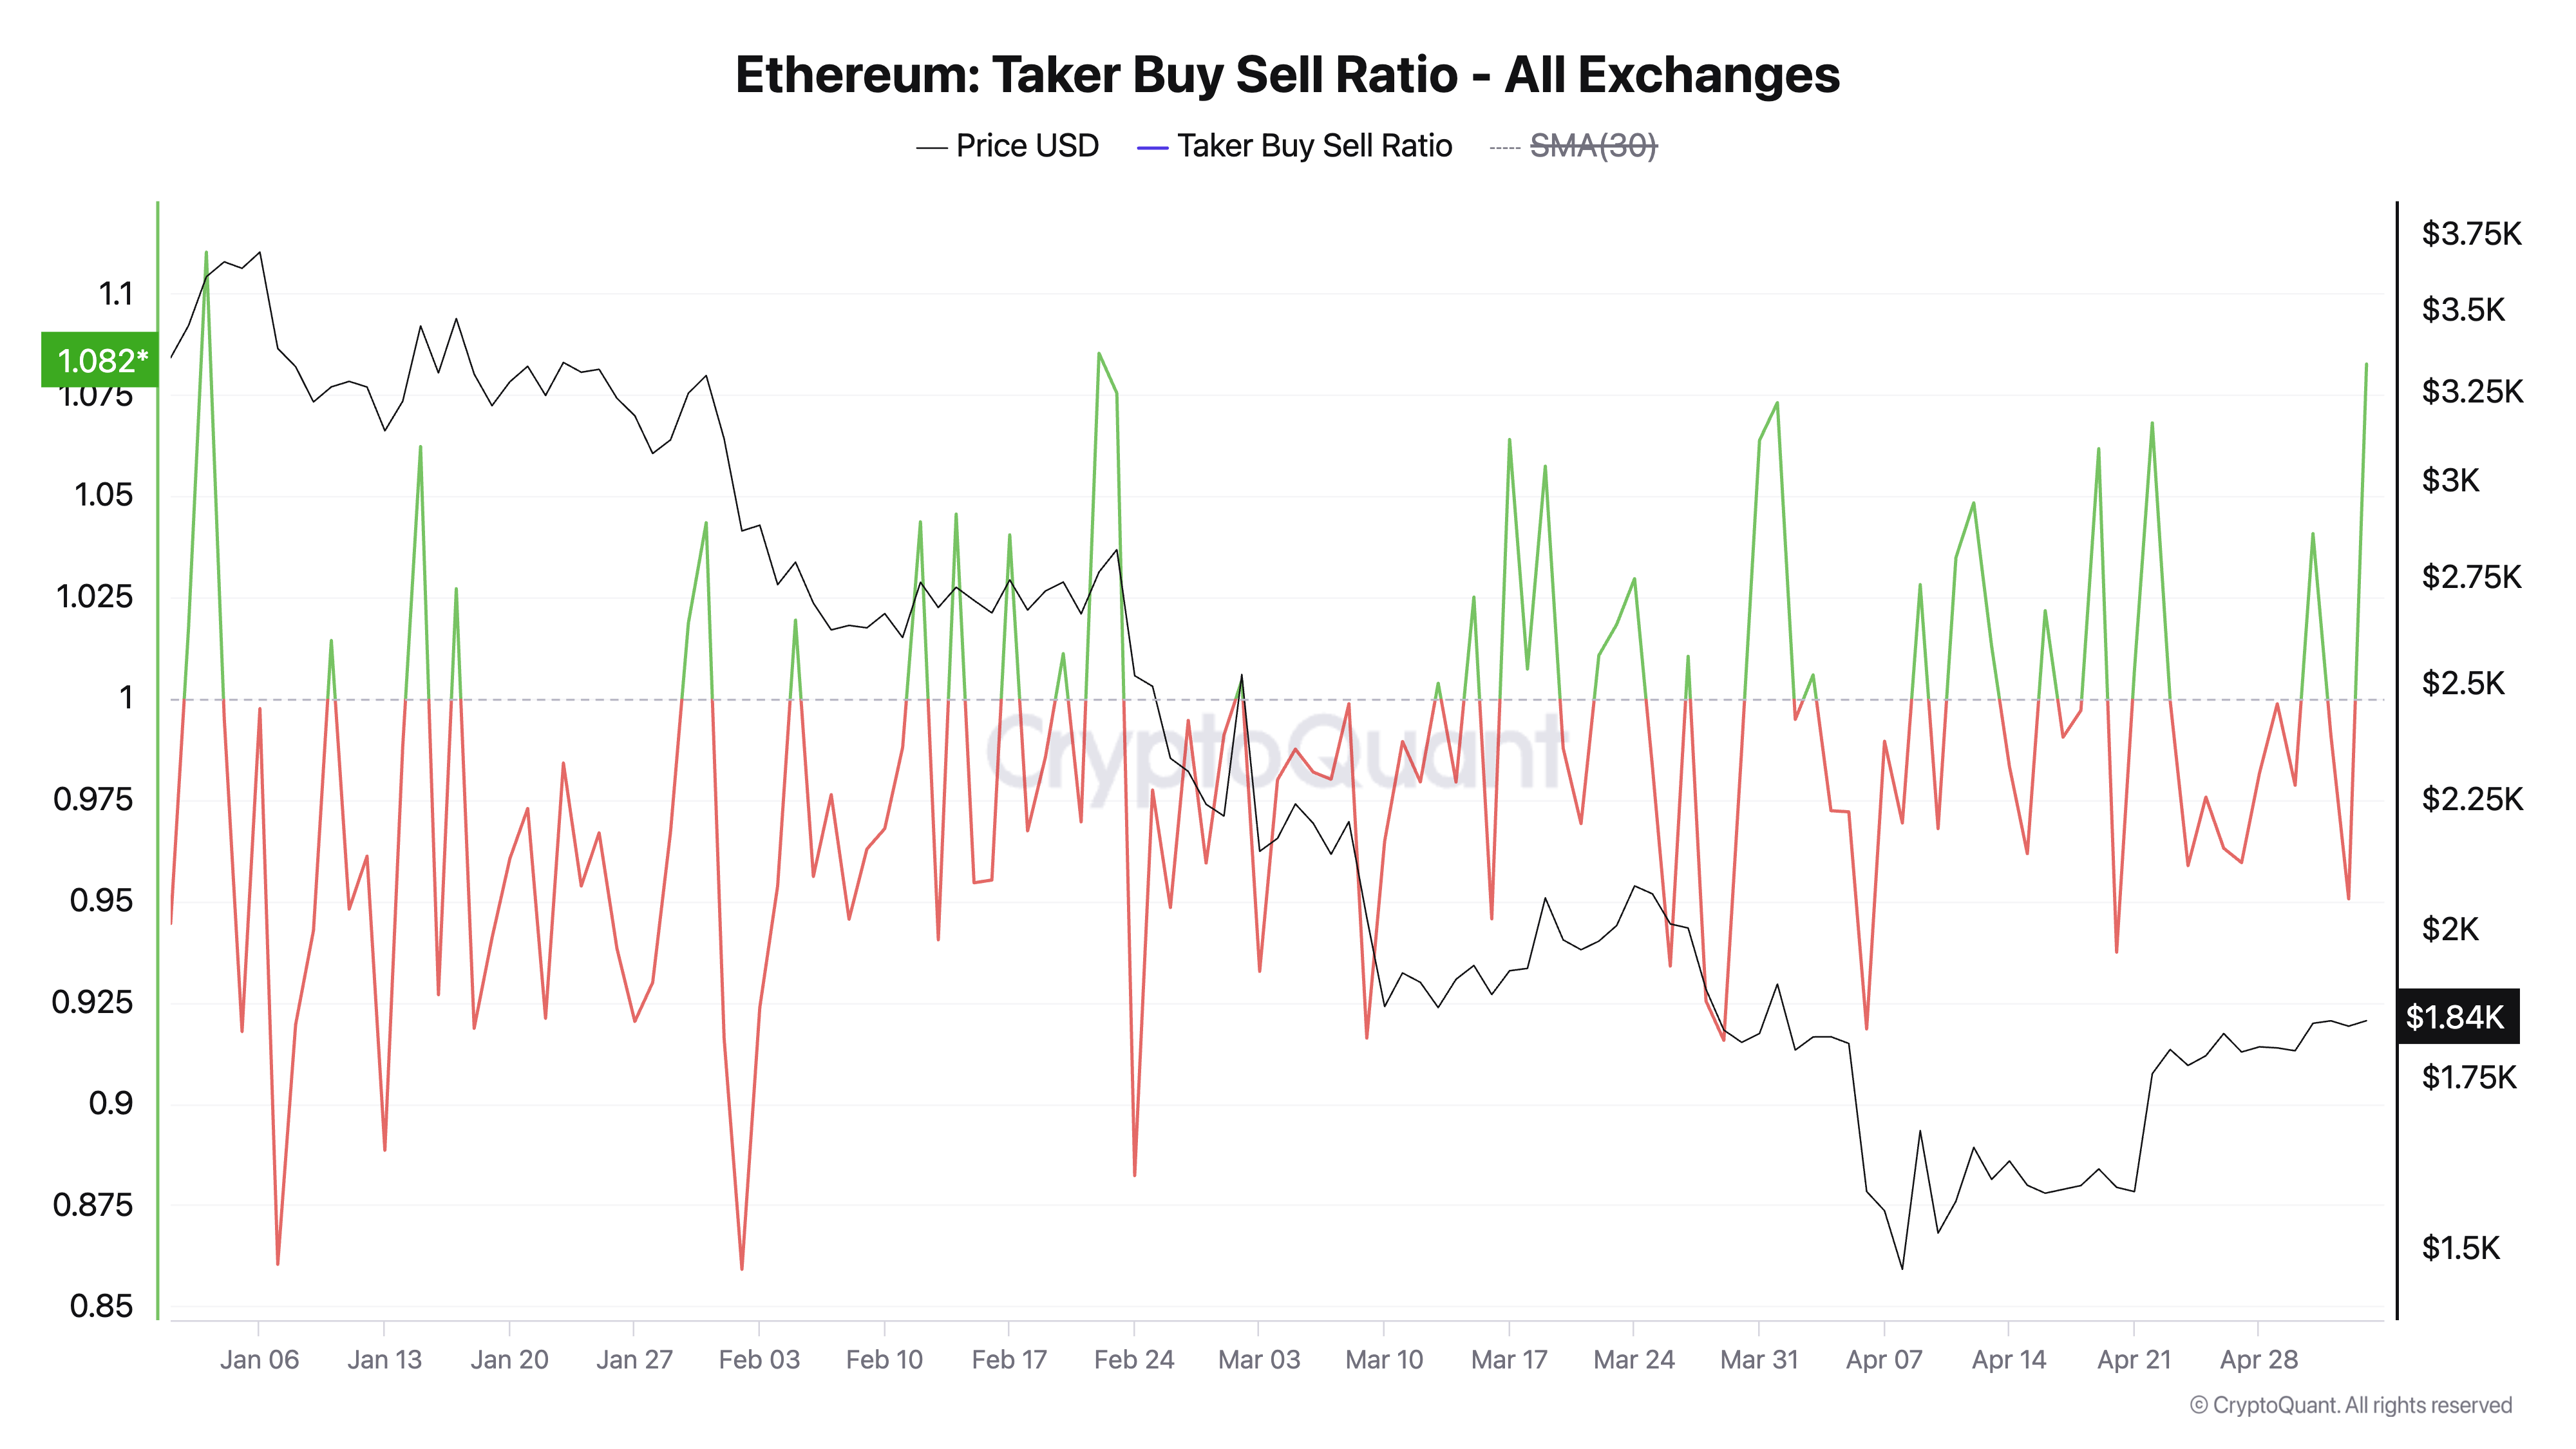
This metric measures the ratio between the buy and sell volumes in ETH’s futures market. A value above 1 suggests that more traders are aggressively buying ETH contracts than selling, while values below 1 indicate dominant sell pressure.
At 1.08, ETH’s taker buy-sell ratio clearly tilts in favor of buyers, reflecting increasing confidence among traders that prices may continue rising.
Moreover, the altcoin’s Relative Strength Index (RSI) continues to trend upward, supporting this bullish narrative. At press time, it is at 58.39 and climbing.
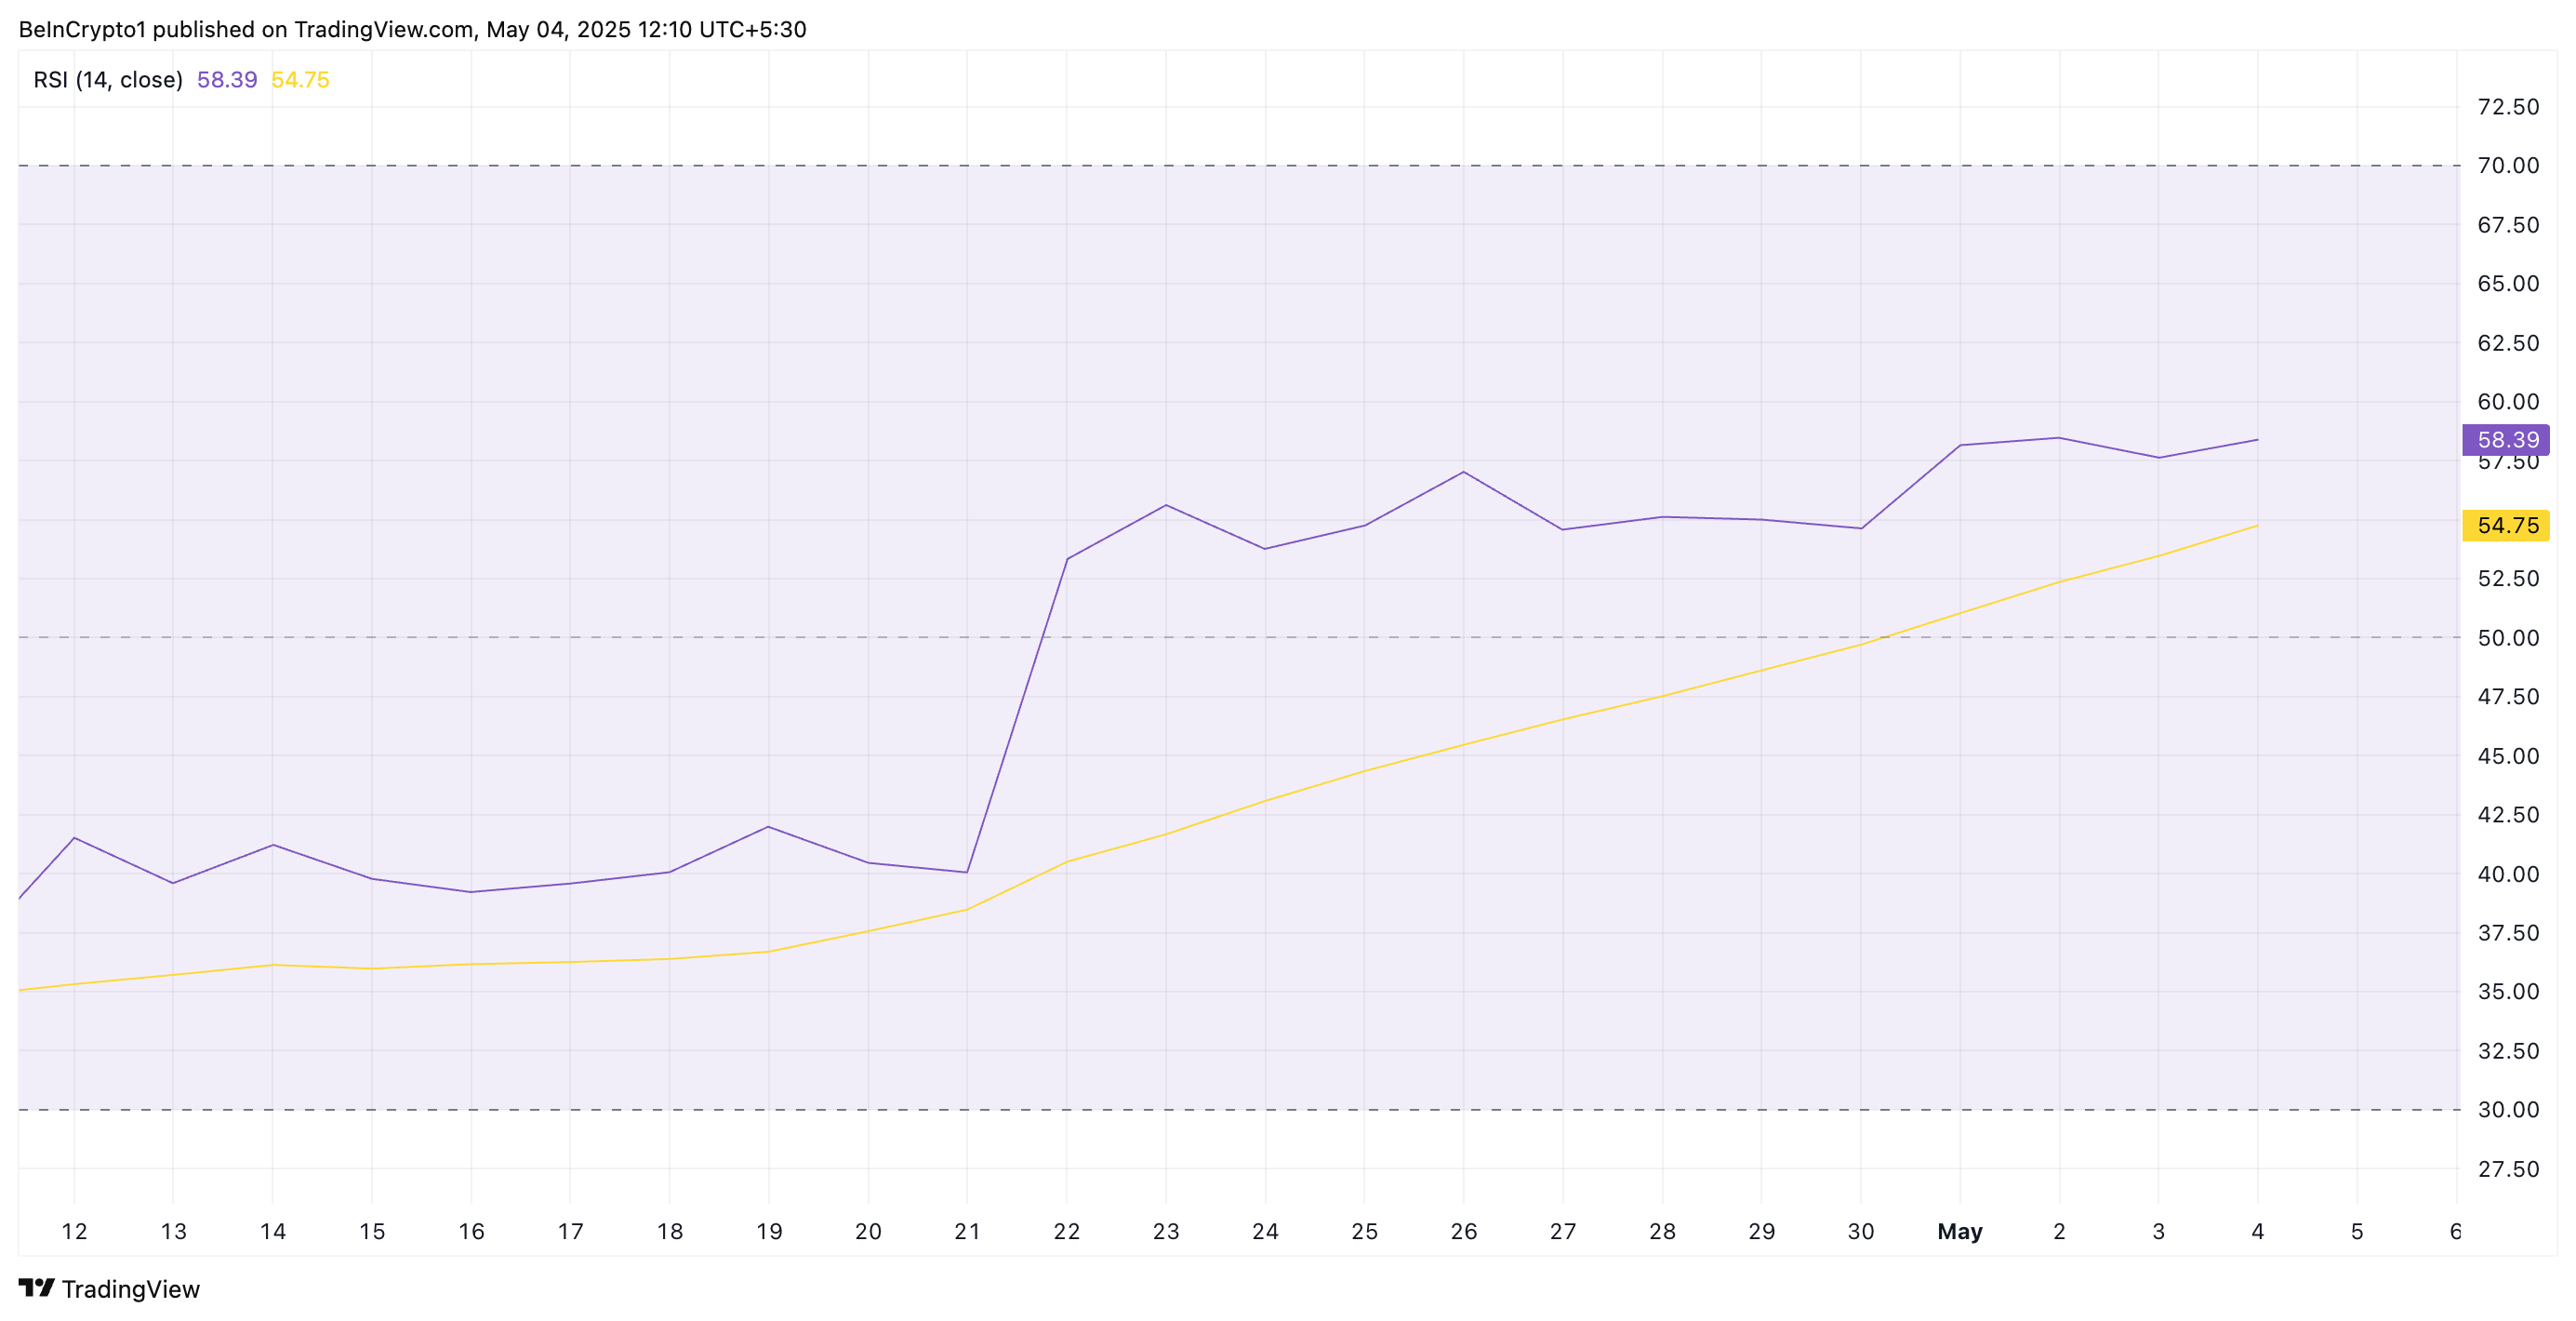
The RSI indicator measures an asset’s overbought and oversold market conditions. It ranges between 0 and 100, with values above 70 indicating that the asset is overbought and due for a decline. Conversely, values under 30 signal that the asset is oversold and could witness a rebound.
ETH’s RSI reading confirms the strengthening bullish bias toward the altcoin, reinforcing the view that it could be primed for further upside.
ETH Builds Strength Above Short-Term Support
At its current price, ETH rests above its 20-day exponential moving average (EMA), which forms dynamic support below its price at $1,770.
The 20-day EMA measures an asset’s average price over the past 20 trading days, giving weight to recent prices. When an asset trades above this key moving average, it signals short-term bullish momentum. This indicates that recent prices are trending higher than the average over the past 20 days. Traders often view this as a sign of underlying strength or an early uptrend.
Therefore, ETH could maintain its rally toward $2,027 if buying pressure gains momentum.
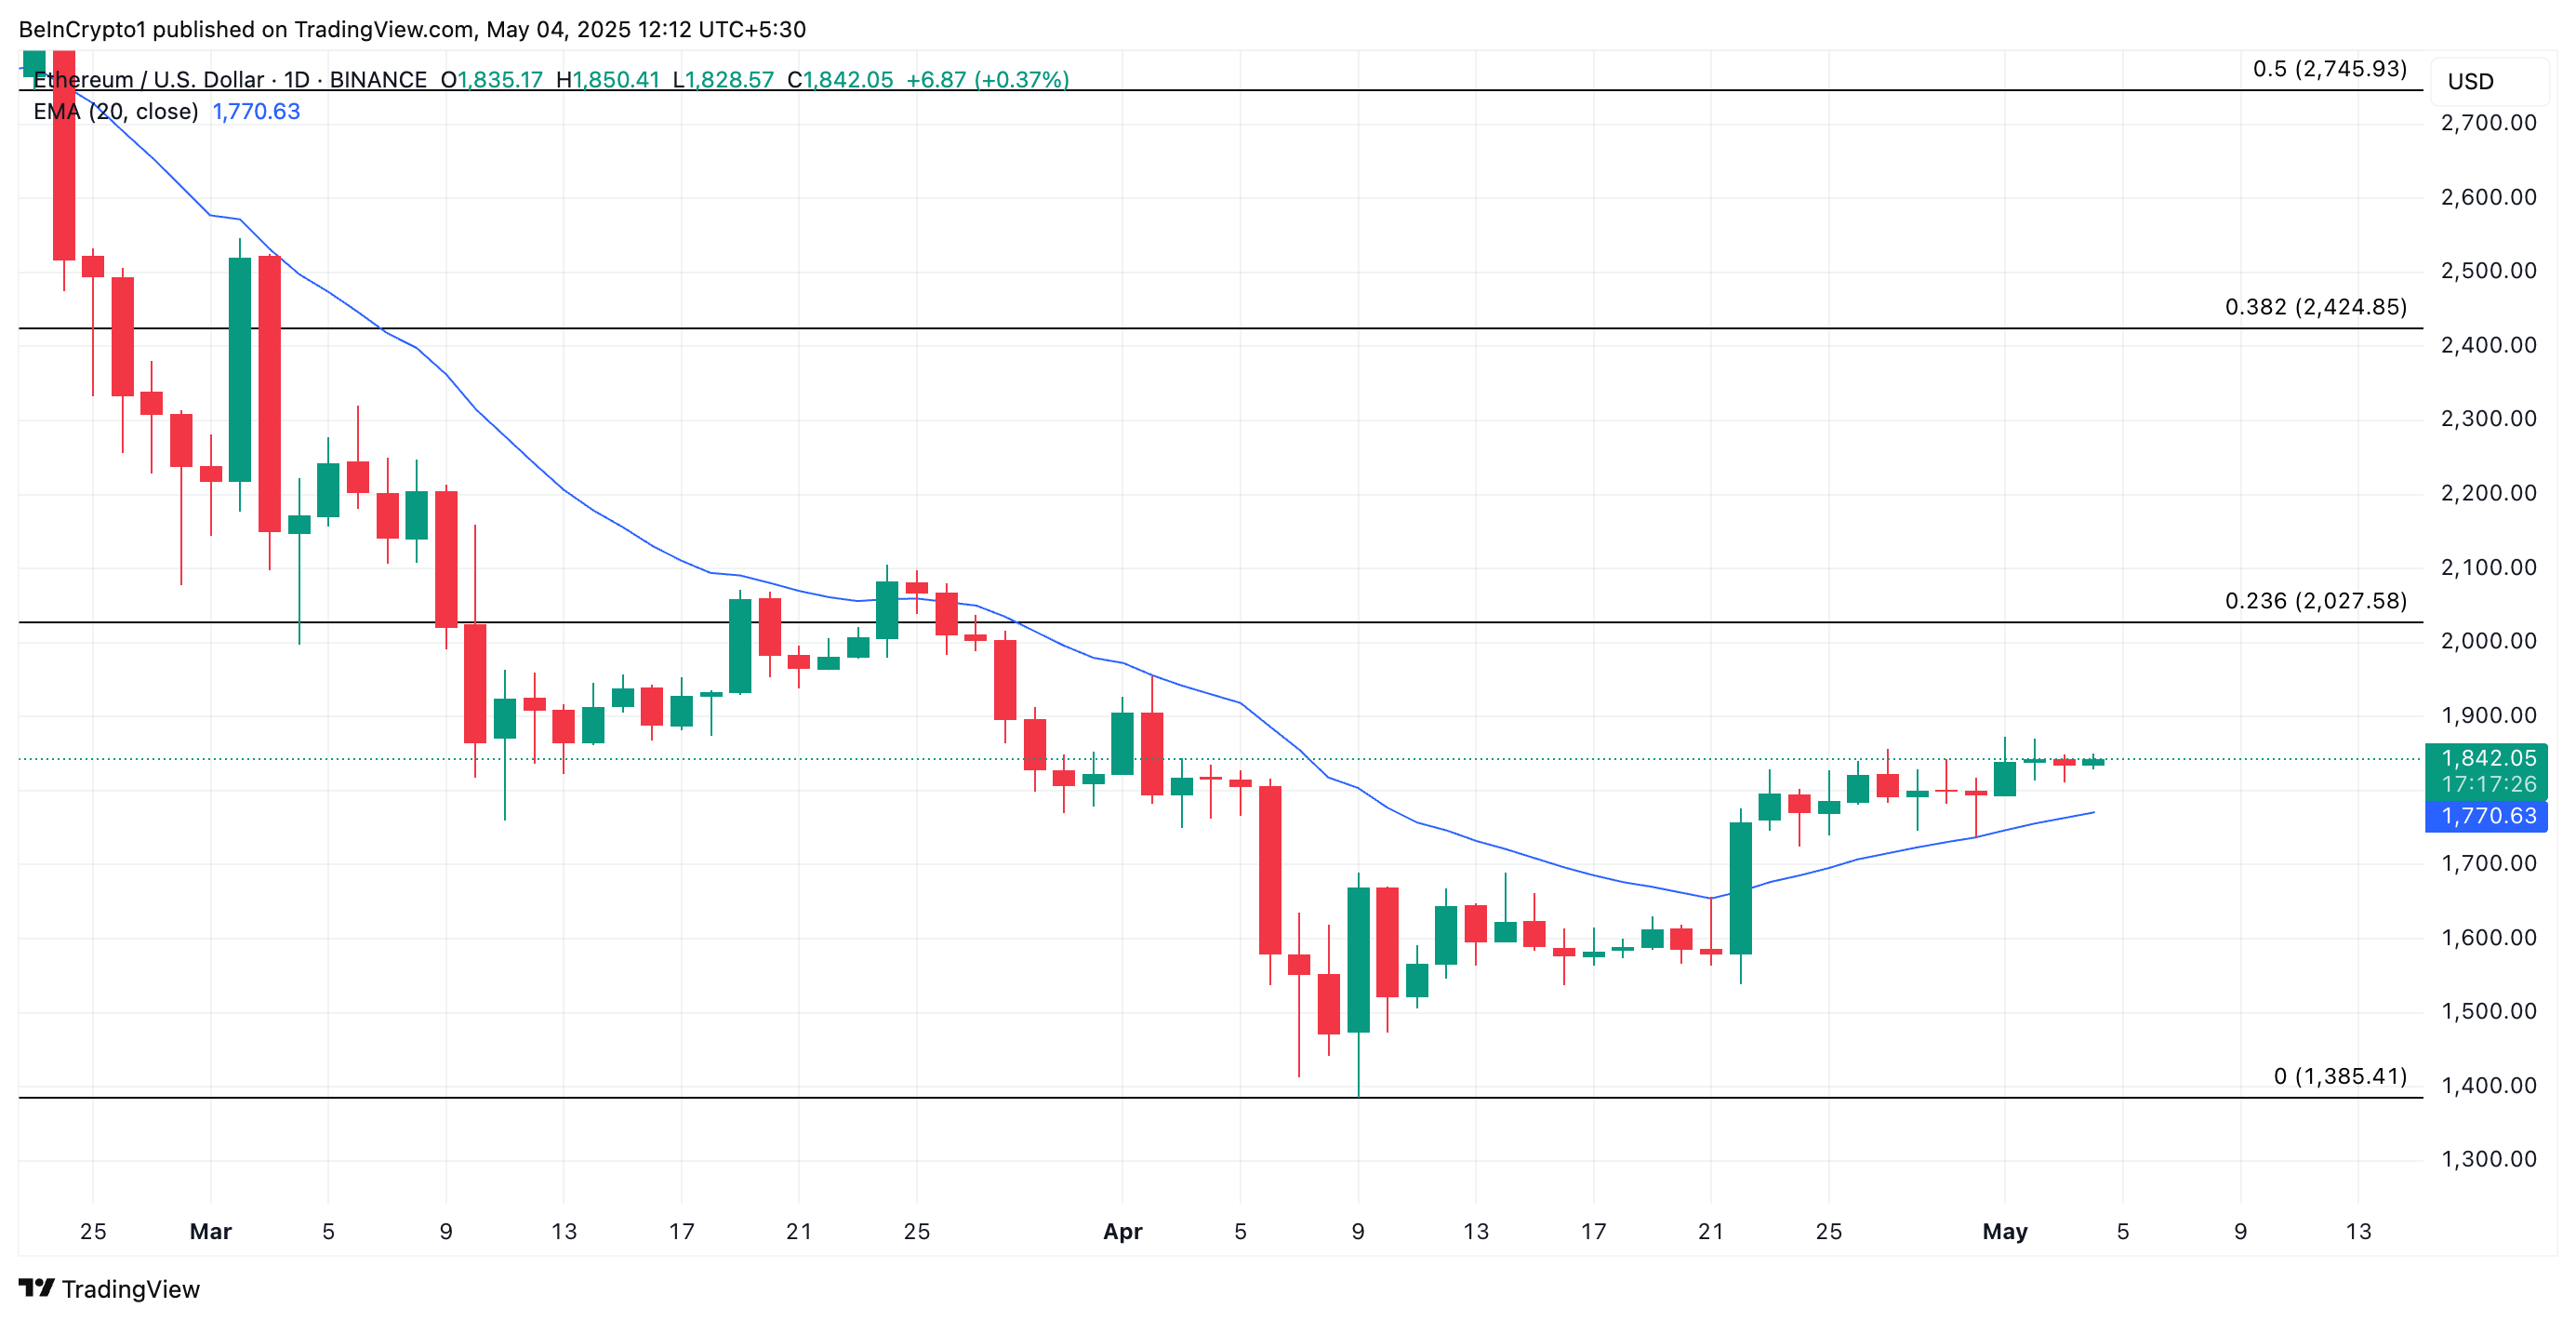
On the other hand, if buying activity wanes, the coin could lose recent gains, break below the 20-day EMA, and fall toward $1,385.

Log in to Reply
Log in to comment your thoughtsComments
Related Articles
|Square
Get the BTCC app to start your crypto journey
Get started today Scan to join our 100M+ users