HBAR Hits Rock Bottom: Hedera Nears 2025’s Lowest Point as Bears Pounce

Hedera’s native token HBAR is flirting with its worst performance of the year—down 68% from its January peak. Technicals scream ’sell,’ but crypto’s never been about rational trading, has it?
RSI plunges into oversold territory while the MACD death cross confirms what chart-watchers already knew: this isn’t a dip, it’s a nosedive. Meanwhile, ’institutional-grade blockchain’ sounds increasingly like one of those hedge fund pitch decks that gets laughed out of Sand Hill Road.
Silver lining? At least the network’s still processing 10,000 TPS. Too bad nobody’s transacting.
HBAR Slides Below Key Indicators
HBAR’s decline comes as many top cryptocurrencies post modest gains this week, reflecting its divergence from general market sentiment.
Readings from the HBAR/USD one-day chart suggest that this bearish trend could persist in the short term. For example, as of this writing, HBAR trades below the dots that make up its Parabolic SAR (Stop and Reverse) indicator.
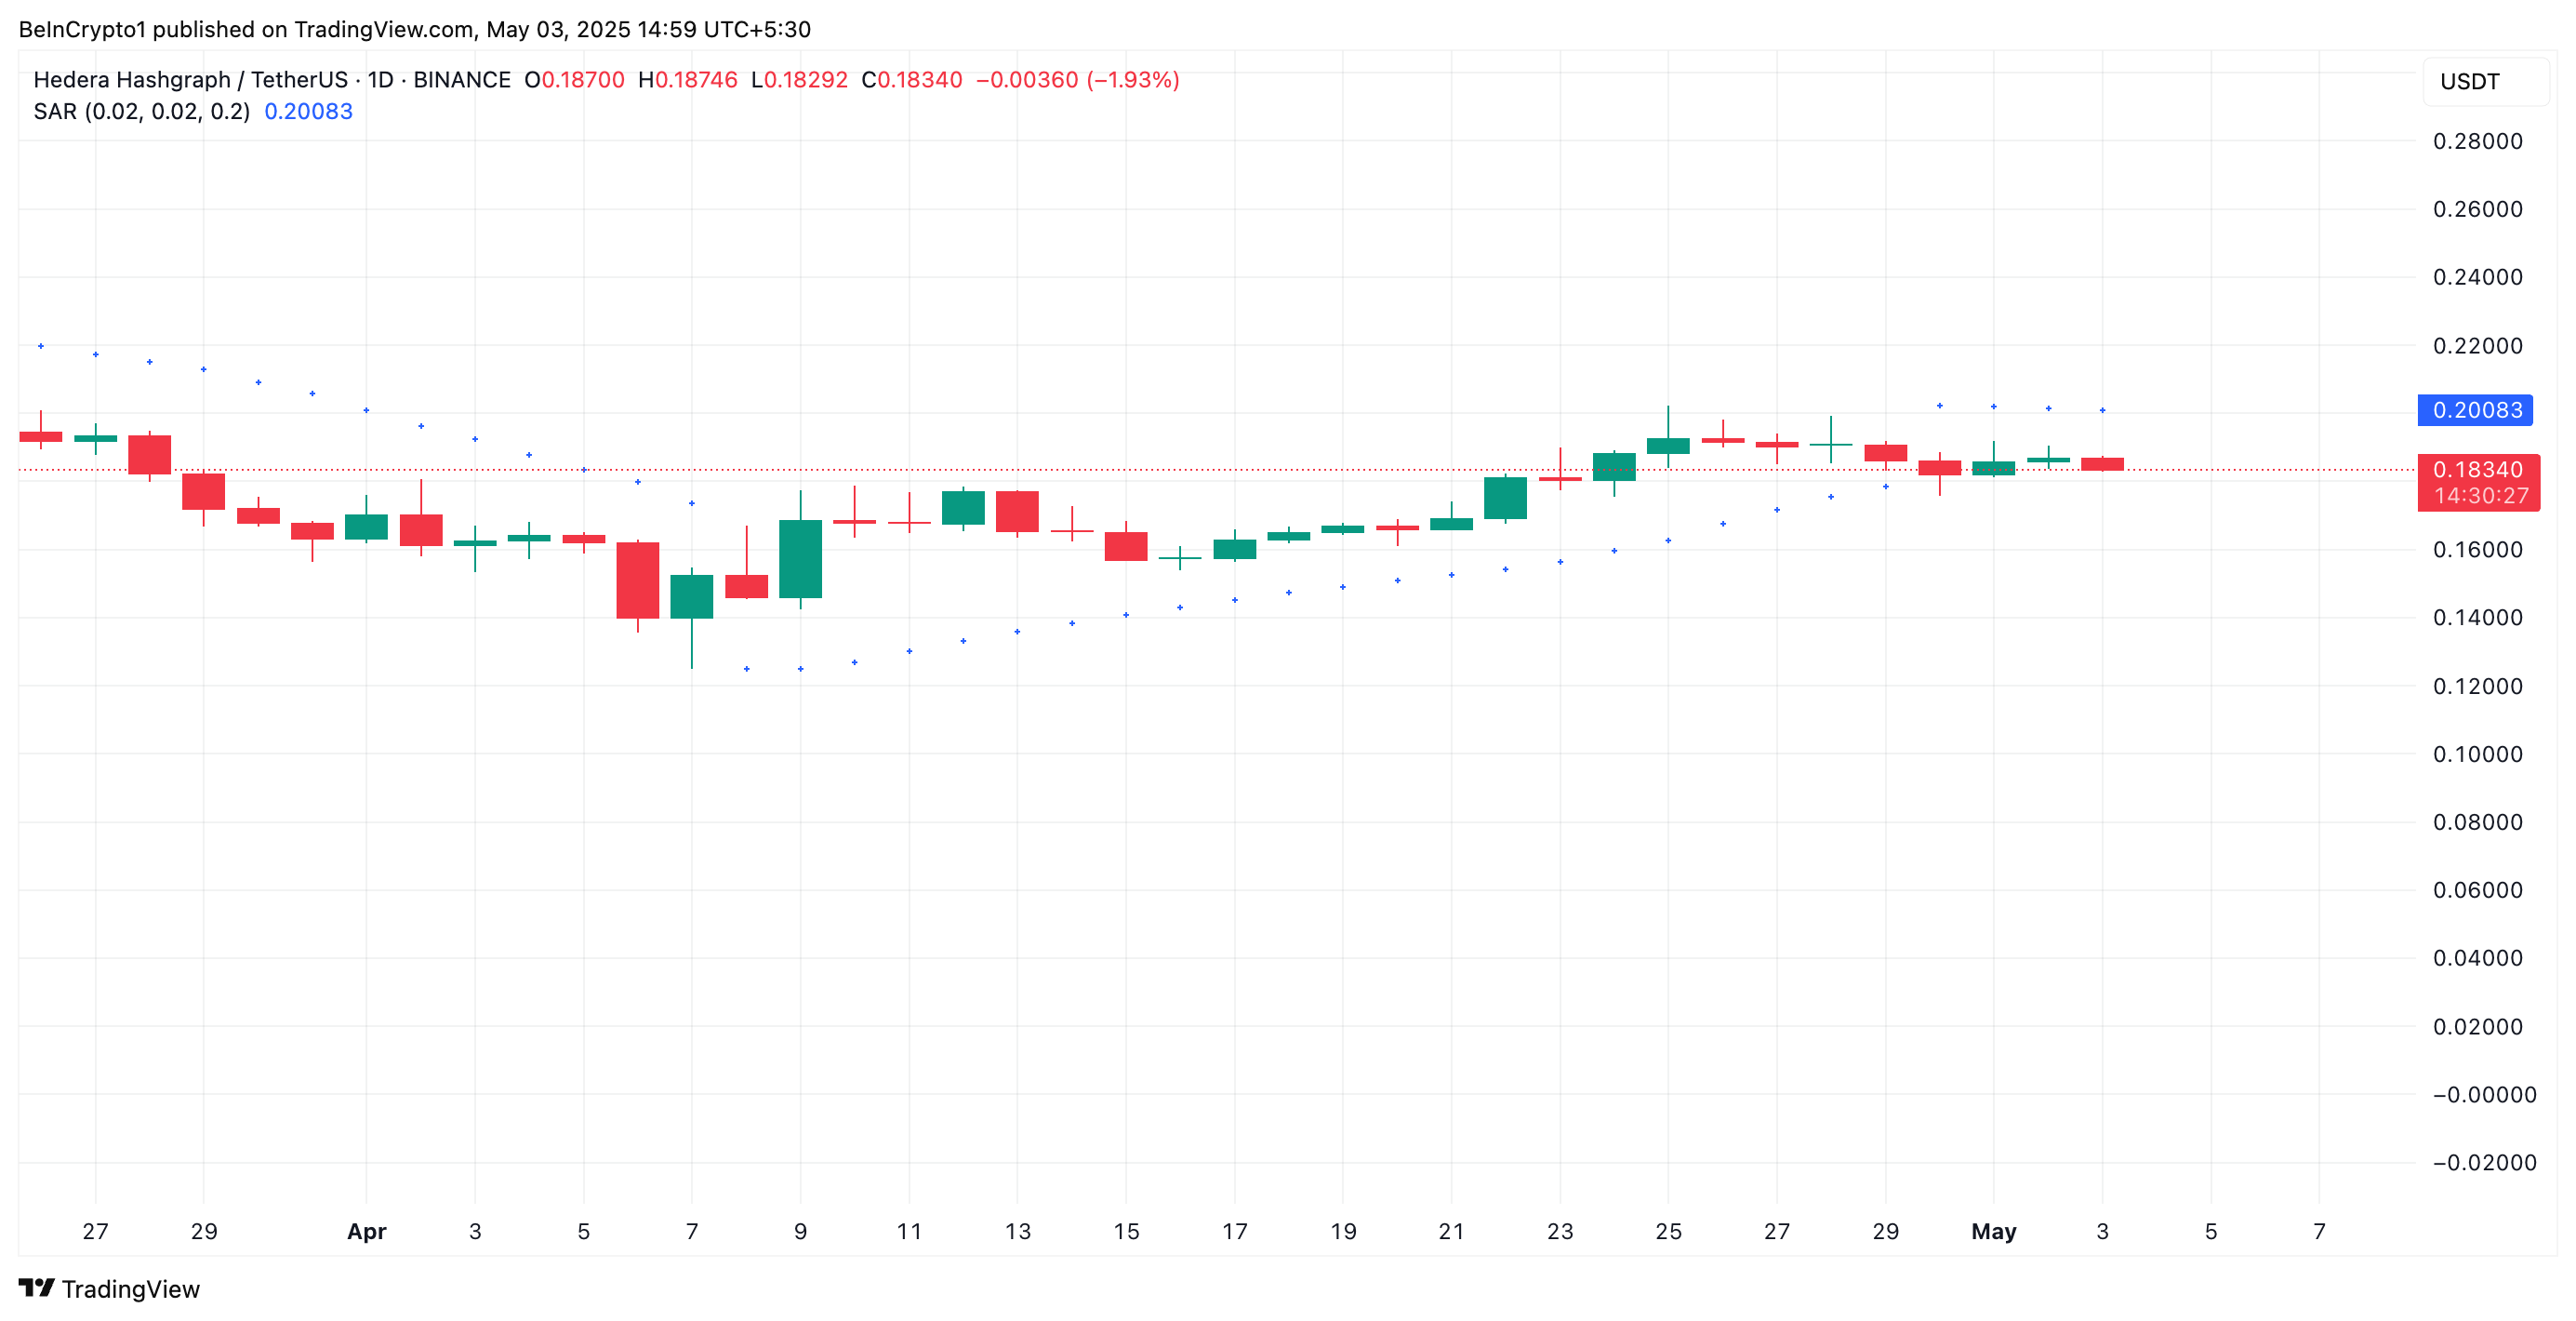
This indicator measures an asset’s price trends and identifies potential entry and exit points. When an asset’s price trades below the SAR, it indicates a downtrend. It suggests the market is in a bearish phase, with the potential for further price dips.
Supporting this bearish outlook, HBAR’s Chaikin Money Flow (CMF) remains in the negative territory, signaling a decline in buying volume and a growing presence of sellers in the market. It currently stands at -0.07.
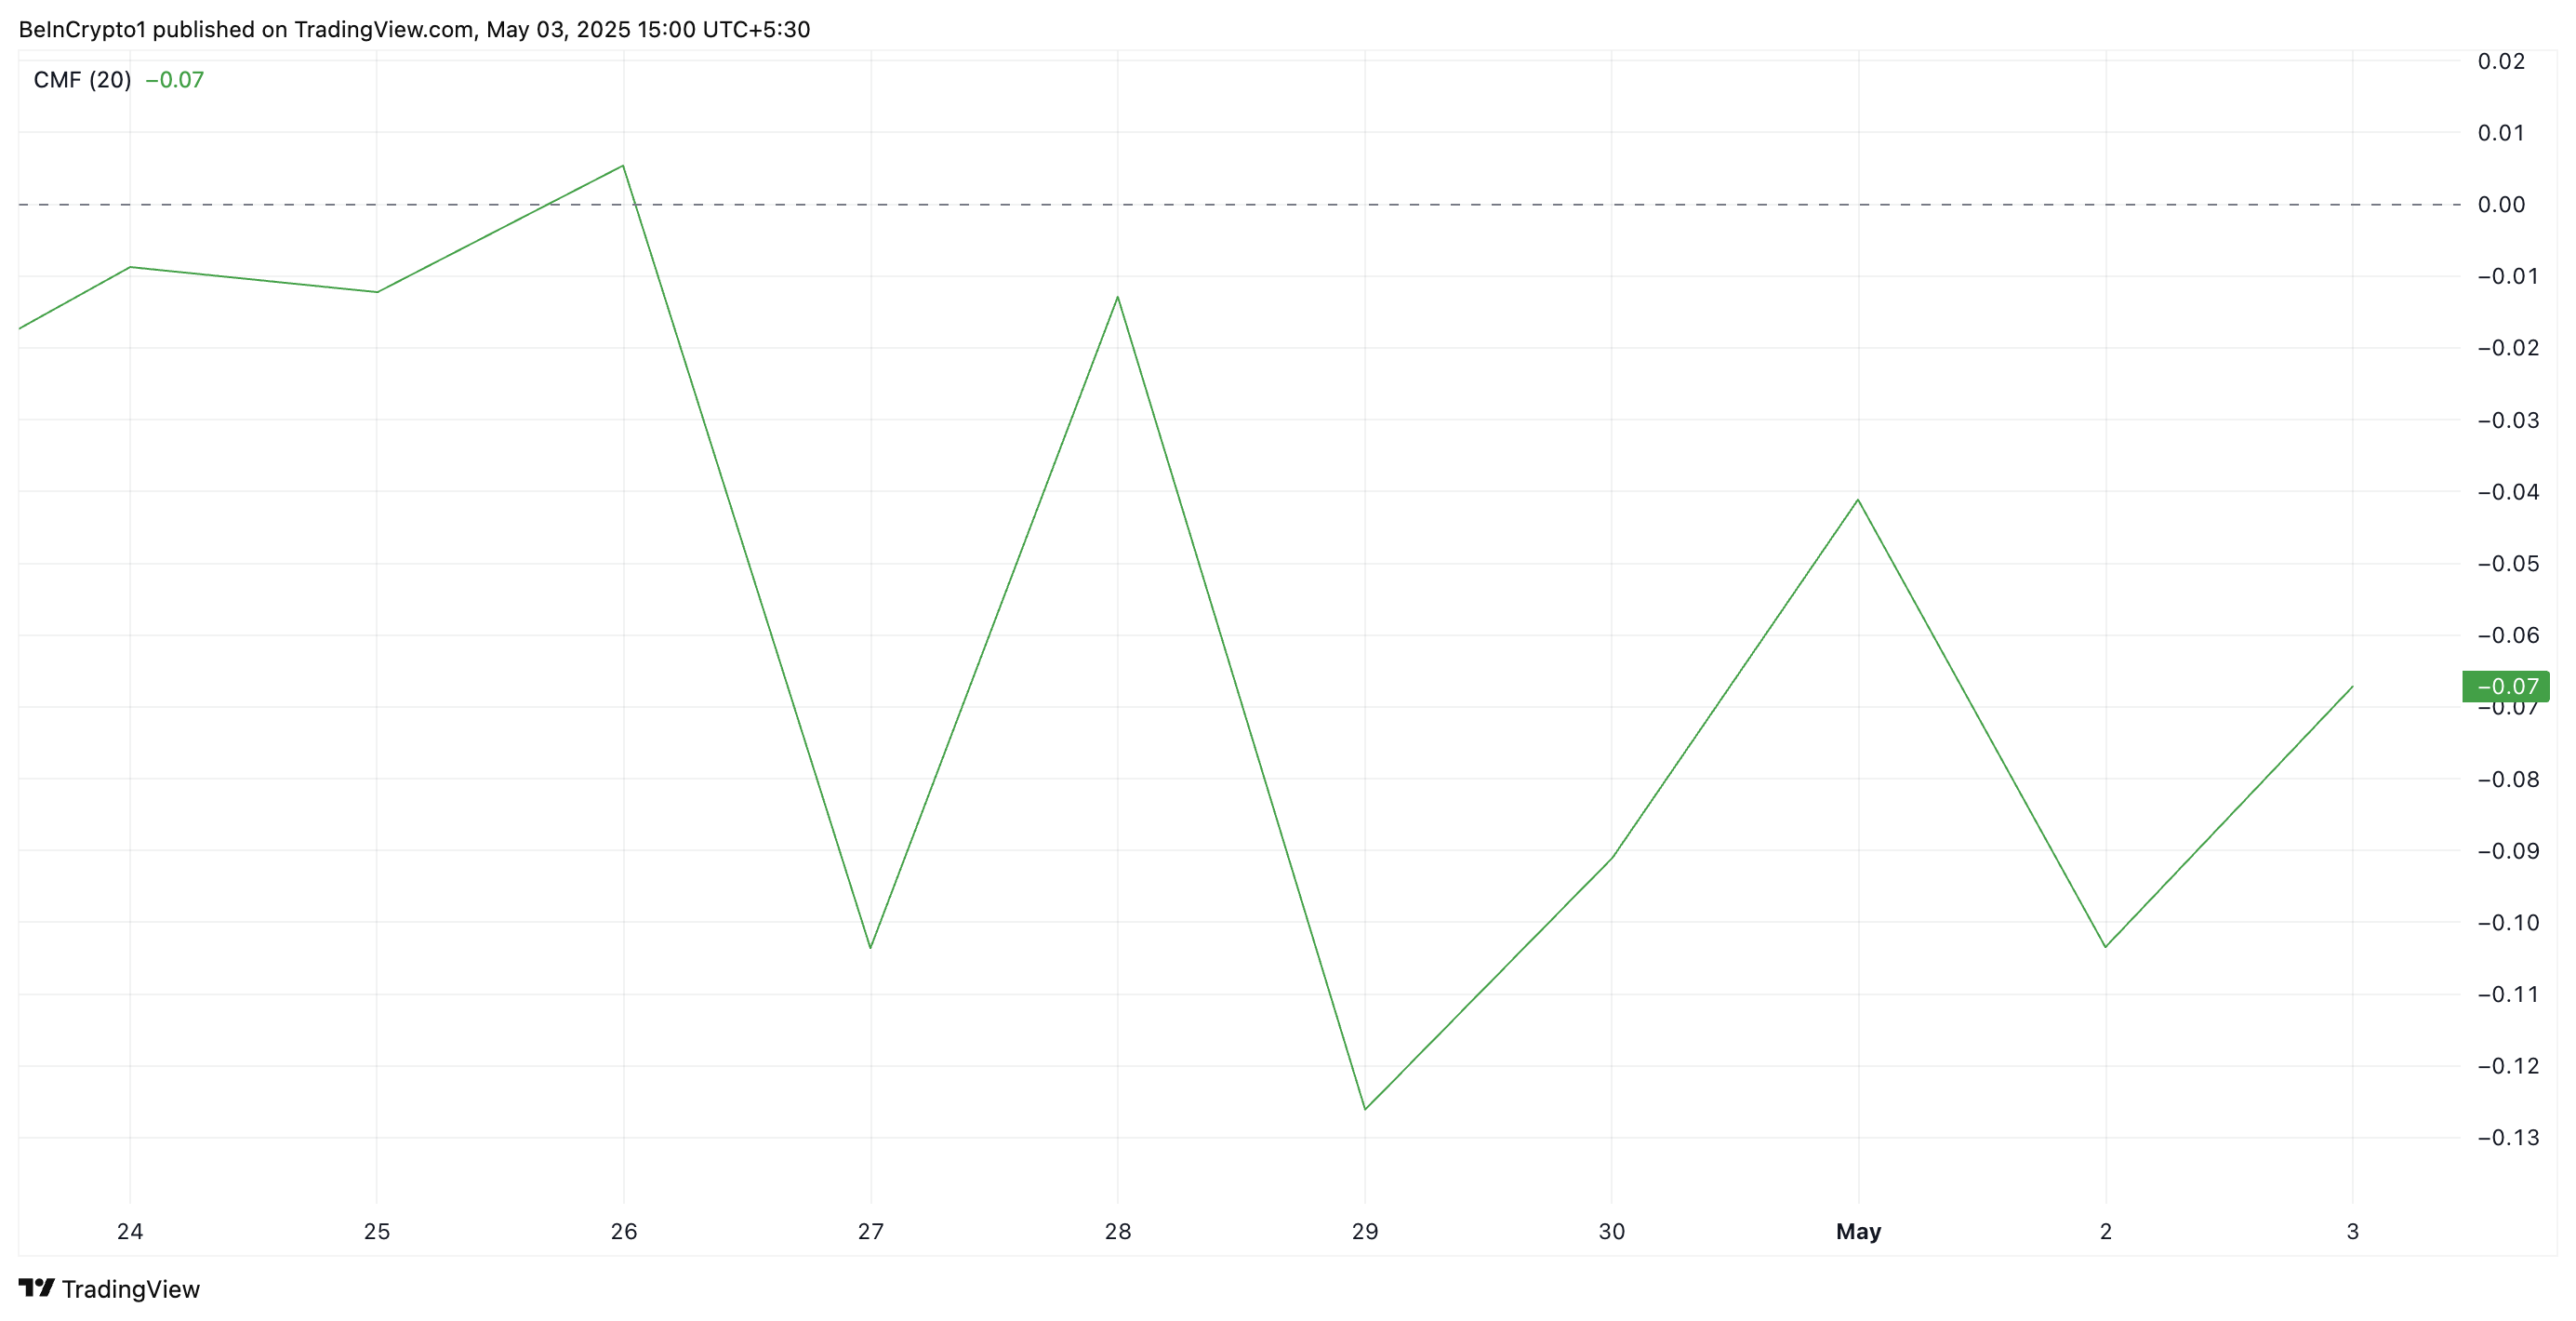
This key momentum indicator measures money flows into and out of an asset. A negative CMF reading, like HBAR’s, signals that selling pressure dominates the market. This means that more investors are offloading the token than accumulating it, a pattern associated with a weakening price trend.
HBAR Tests 20-Day EMA: Will It Hold or Break Toward $0.12?
The daily chart shows HBAR’s decline has pushed it NEAR the 20-day exponential moving average (EMA). This key moving average measures an asset’s average price over the past 20 trading days, giving weight to recent changes.
When the price falls near the 20-day EMA, it signals a potential support level being tested. However, if the price breaks decisively below the EMA, it may confirm sustained bearish momentum and further downside risk.
Therefore, HBAR’s break below the 20-day EMA could lower its price to its year-to-date low of $0.12.
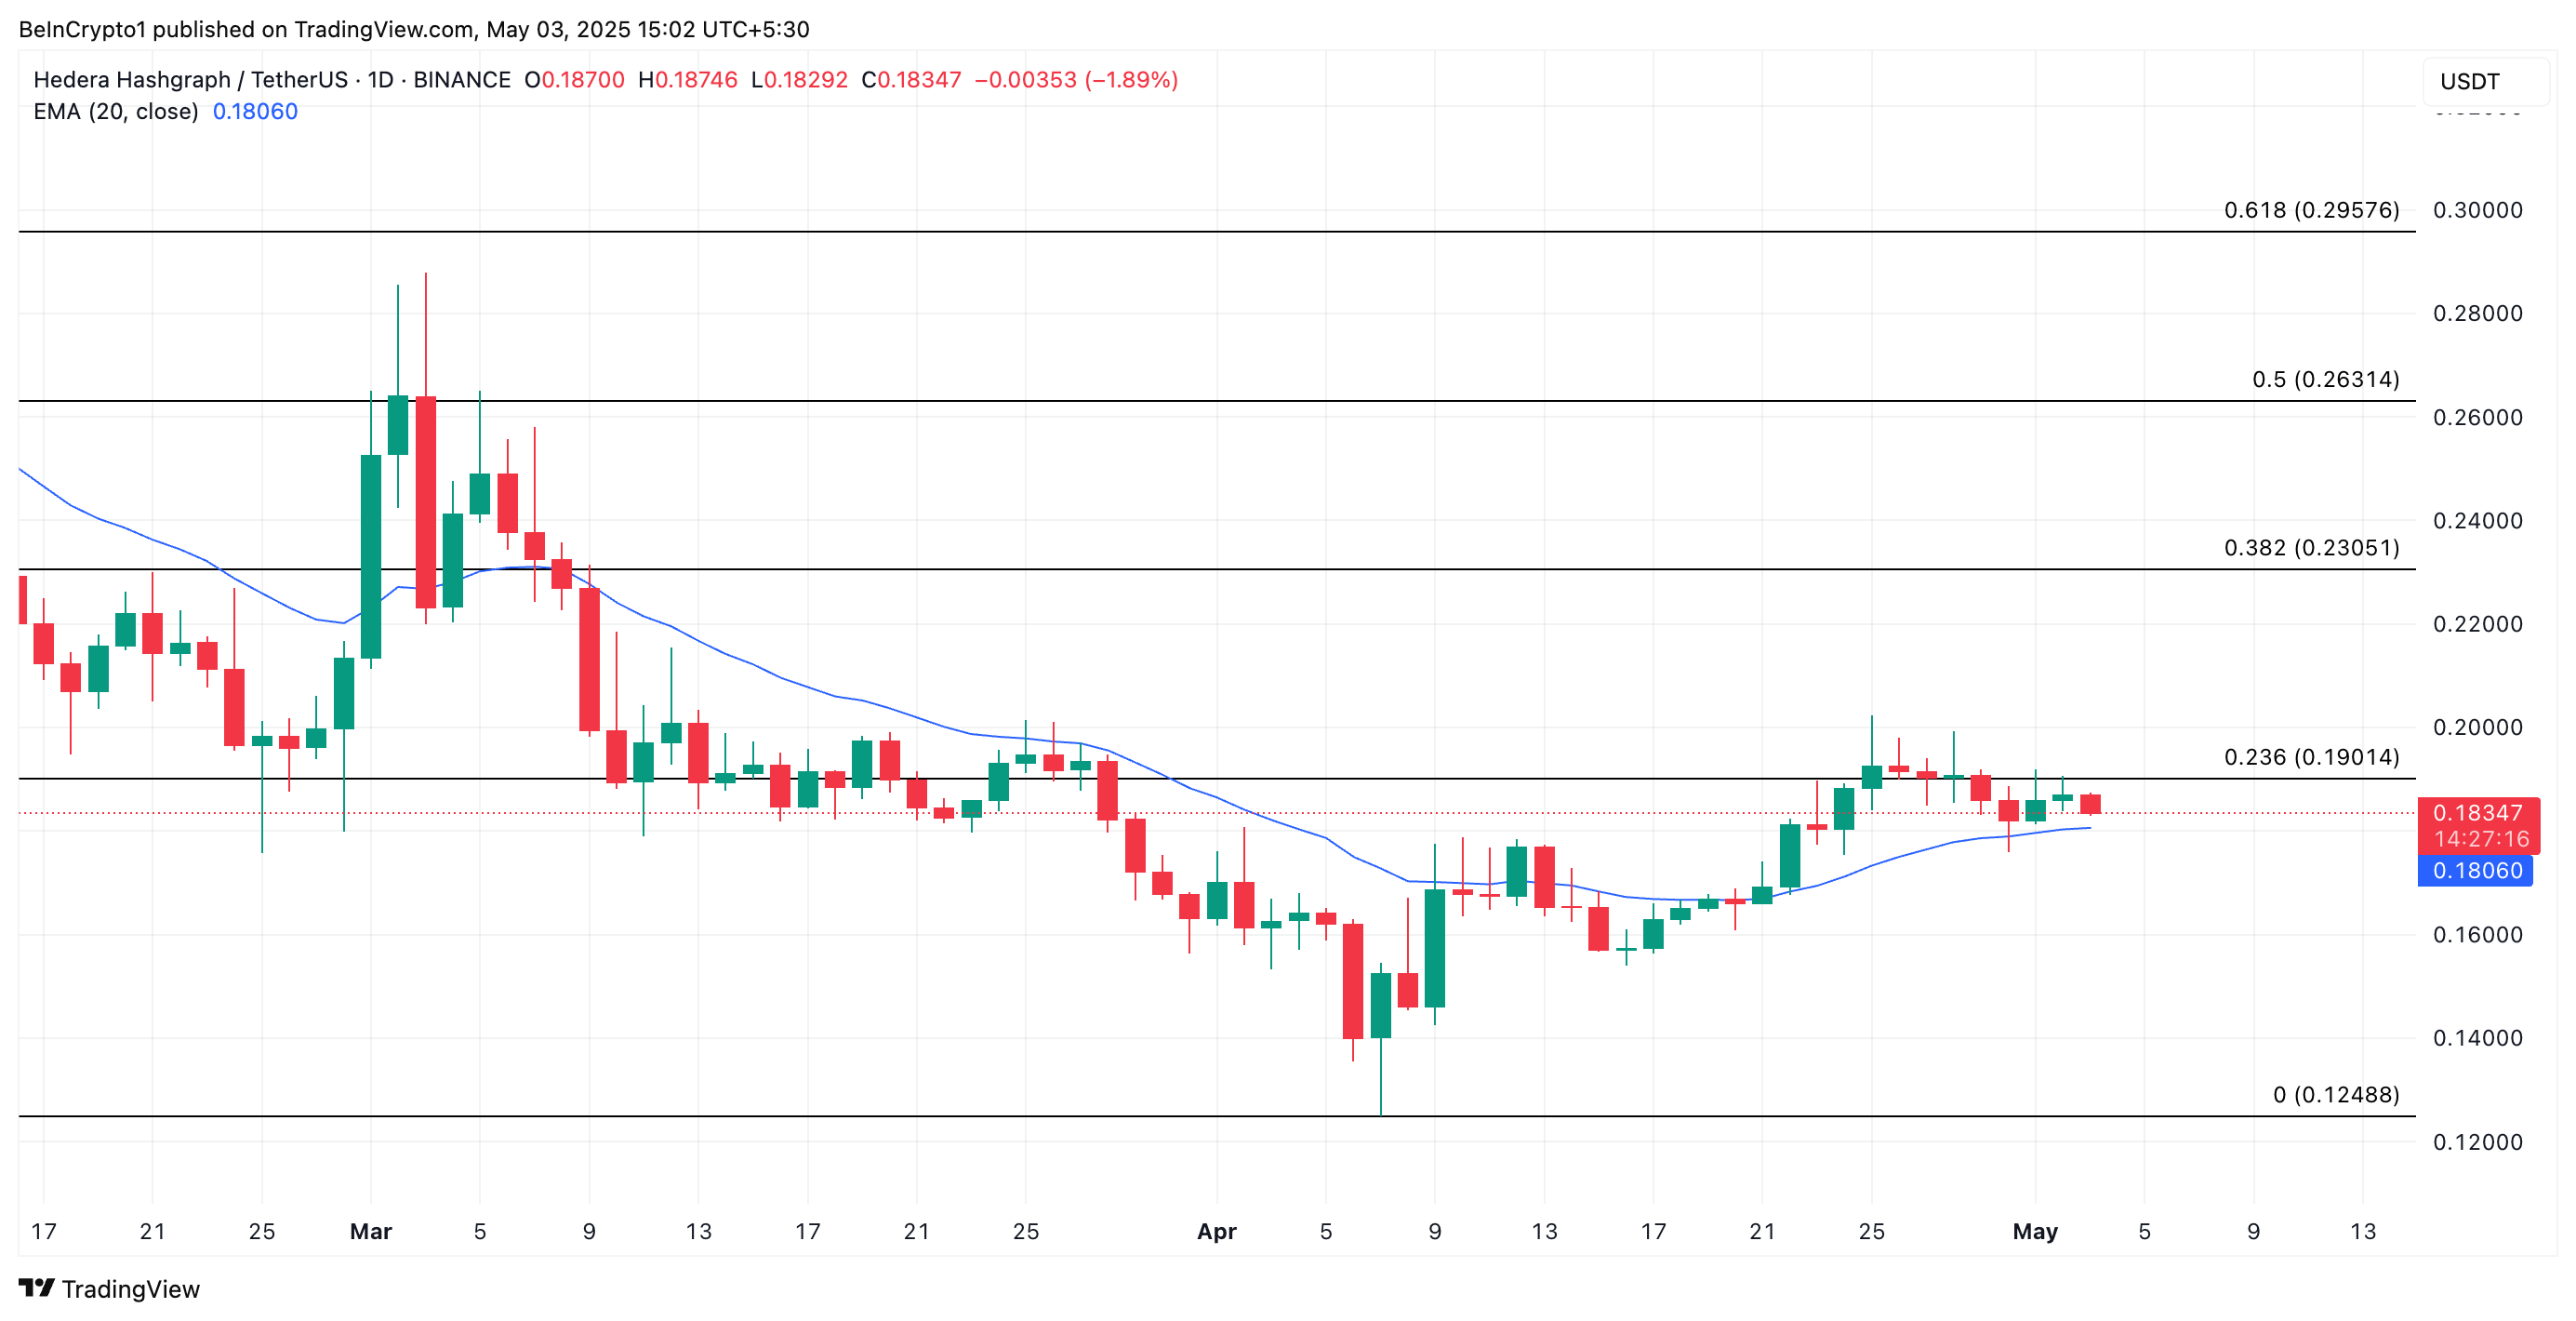
However, if demand rockets and HBAR bounces off its 20-day EMA, its price could rally above $0.19.
