Solana Teeters on Edge of ’Death Cross’ as SOL Stalls Below $150

Solana’s price action flashes warning signs as the dreaded ’death cross’ pattern emerges—just what crypto traders needed alongside their morning coffee. The $150 level has become a battleground where bulls and hedge funds play chicken with leveraged positions.
Technical traders are sweating over the 50-day MA threatening to cross below the 200-day—a classic bearish signal that makes risk managers reach for the Xanax. Meanwhile, SOL’s network activity hasn’t matched the hype, proving once again that in crypto, fundamentals are just something to ignore until the next influencer pump.
Will this be another ’buy the dip’ opportunity or the start of a deeper correction? Place your bets—the house always wins.
Solana Faces Breakdown Risk as Sellers Tighten Grip
SOL’s Moving Average Convergence Divergence (MACD) indicator is poised to form a death cross, a bearish crossover where the MACD line dips below the signal line.
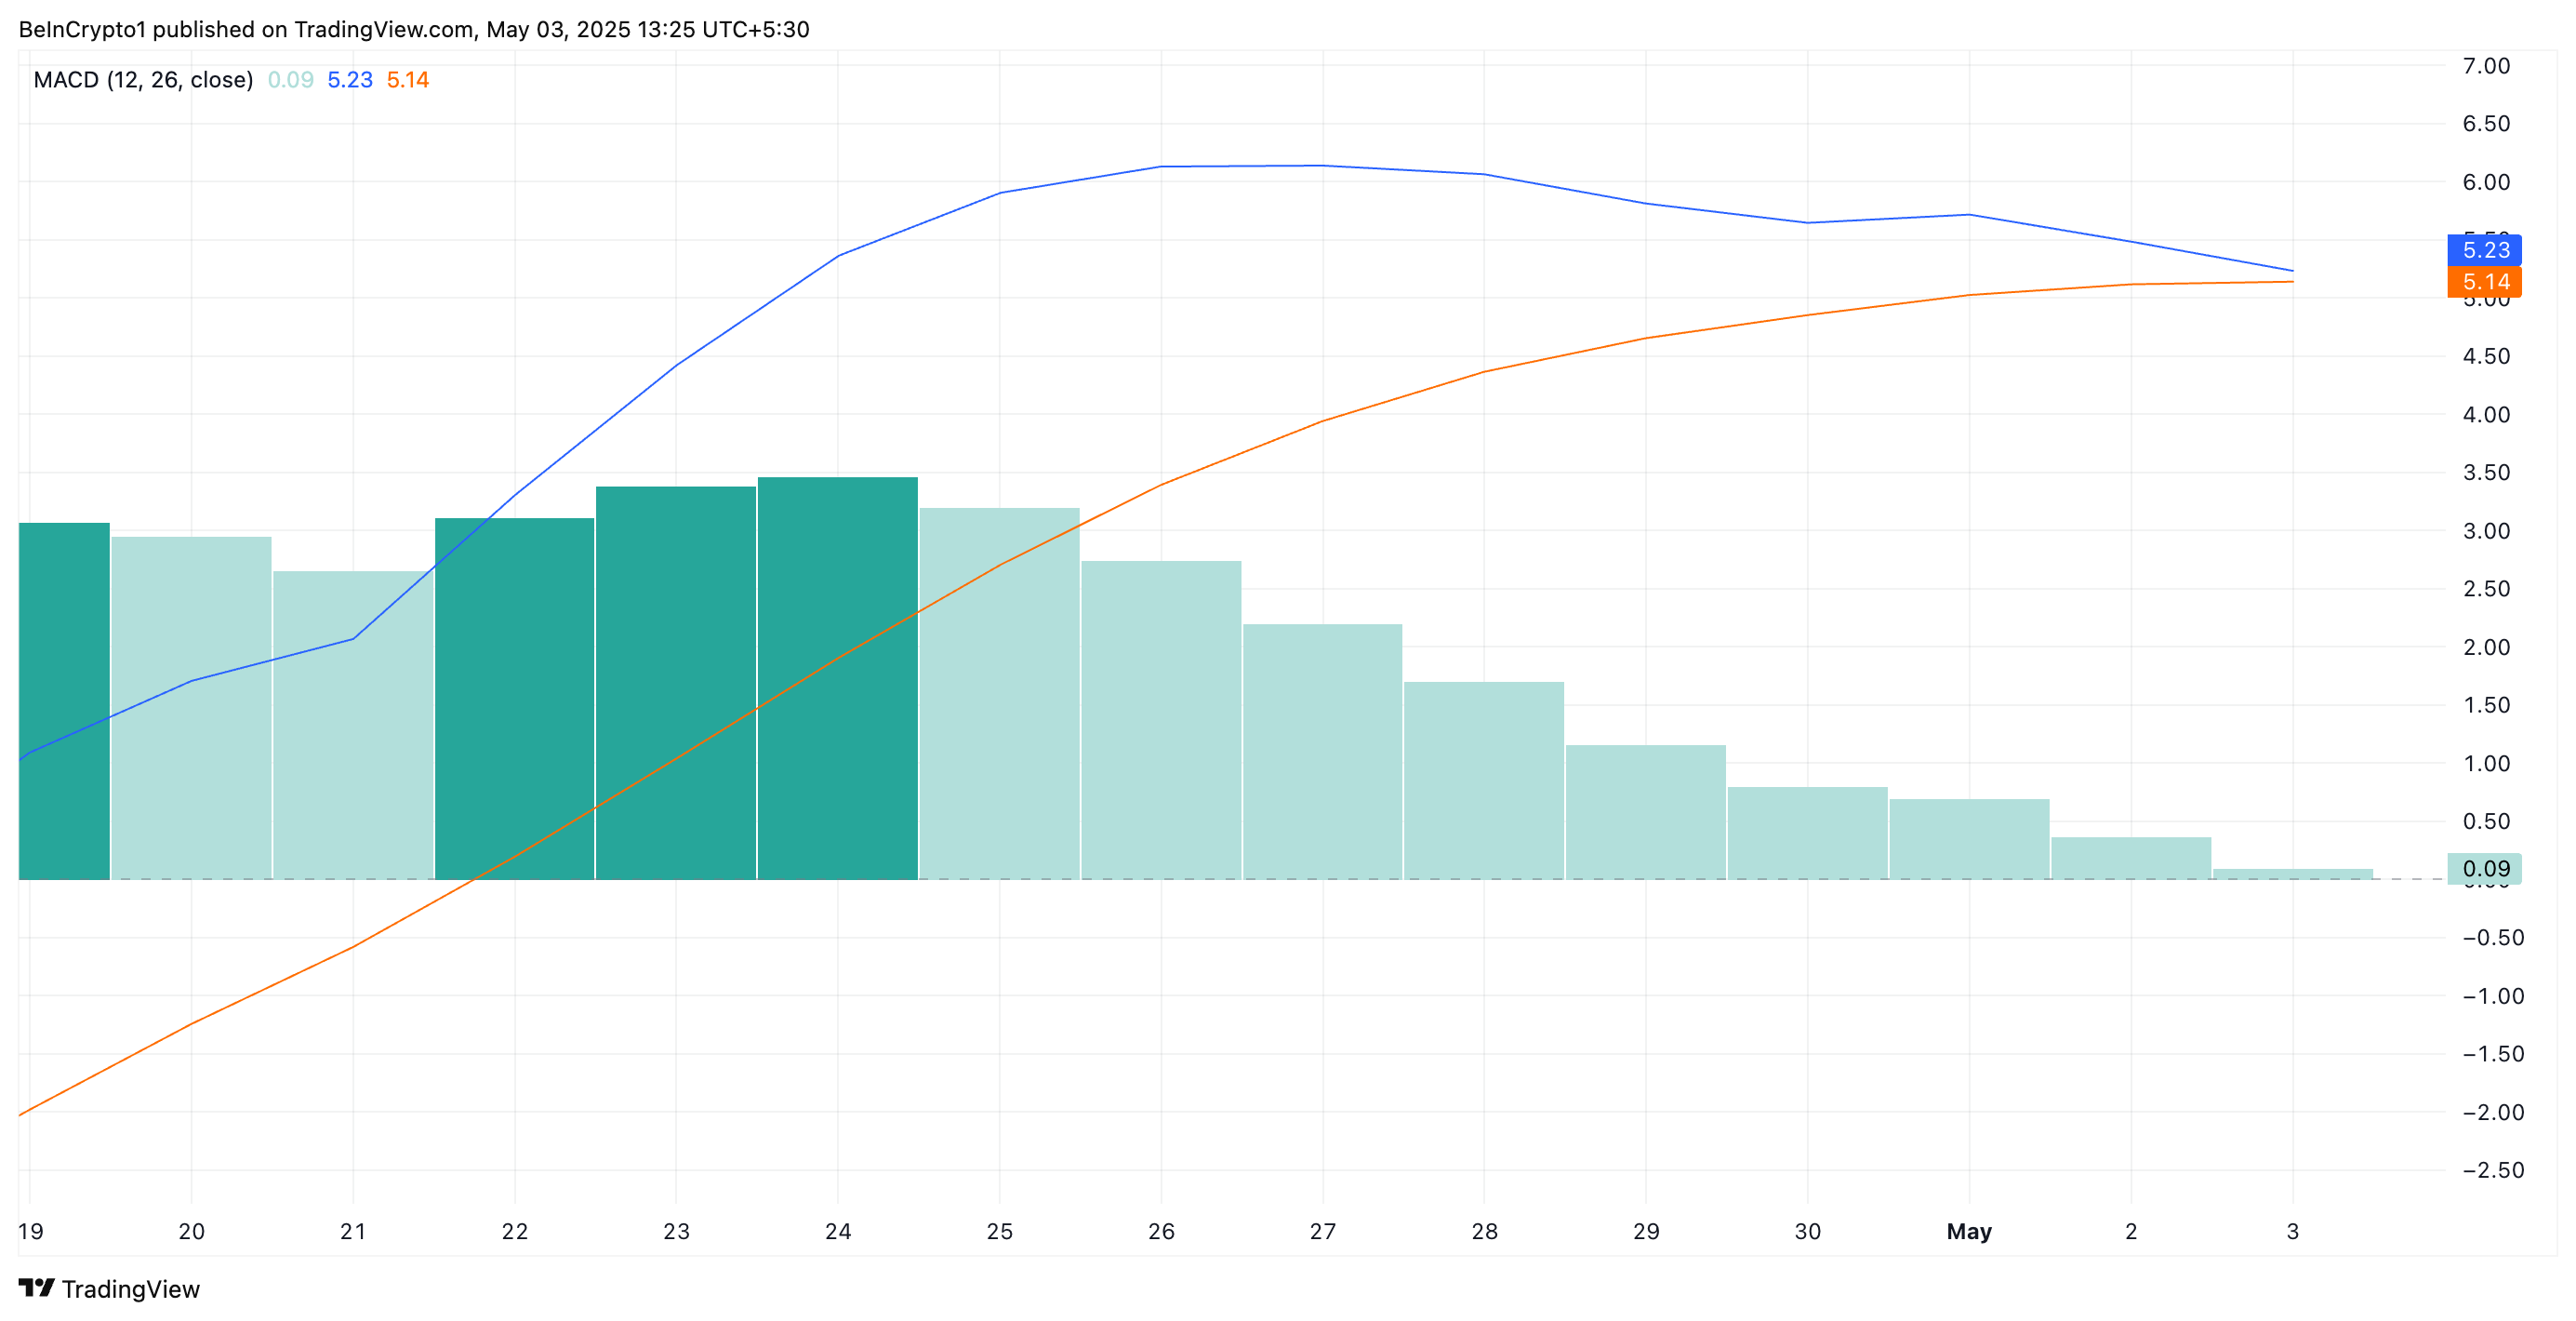
As of this writing, the coin’s MACD line (blue) rests NEAR the signal line (orange), awaiting a catalyst to push it under. This pattern often precedes a sustained downtrend and is widely viewed by traders as a sign of weakening price strength.
Further, SOL’s Balance of Power (BoP) is currently negative, reinforcing the downtrend. This indicates that sellers have gained market control. At press time, this stands at -0.12.
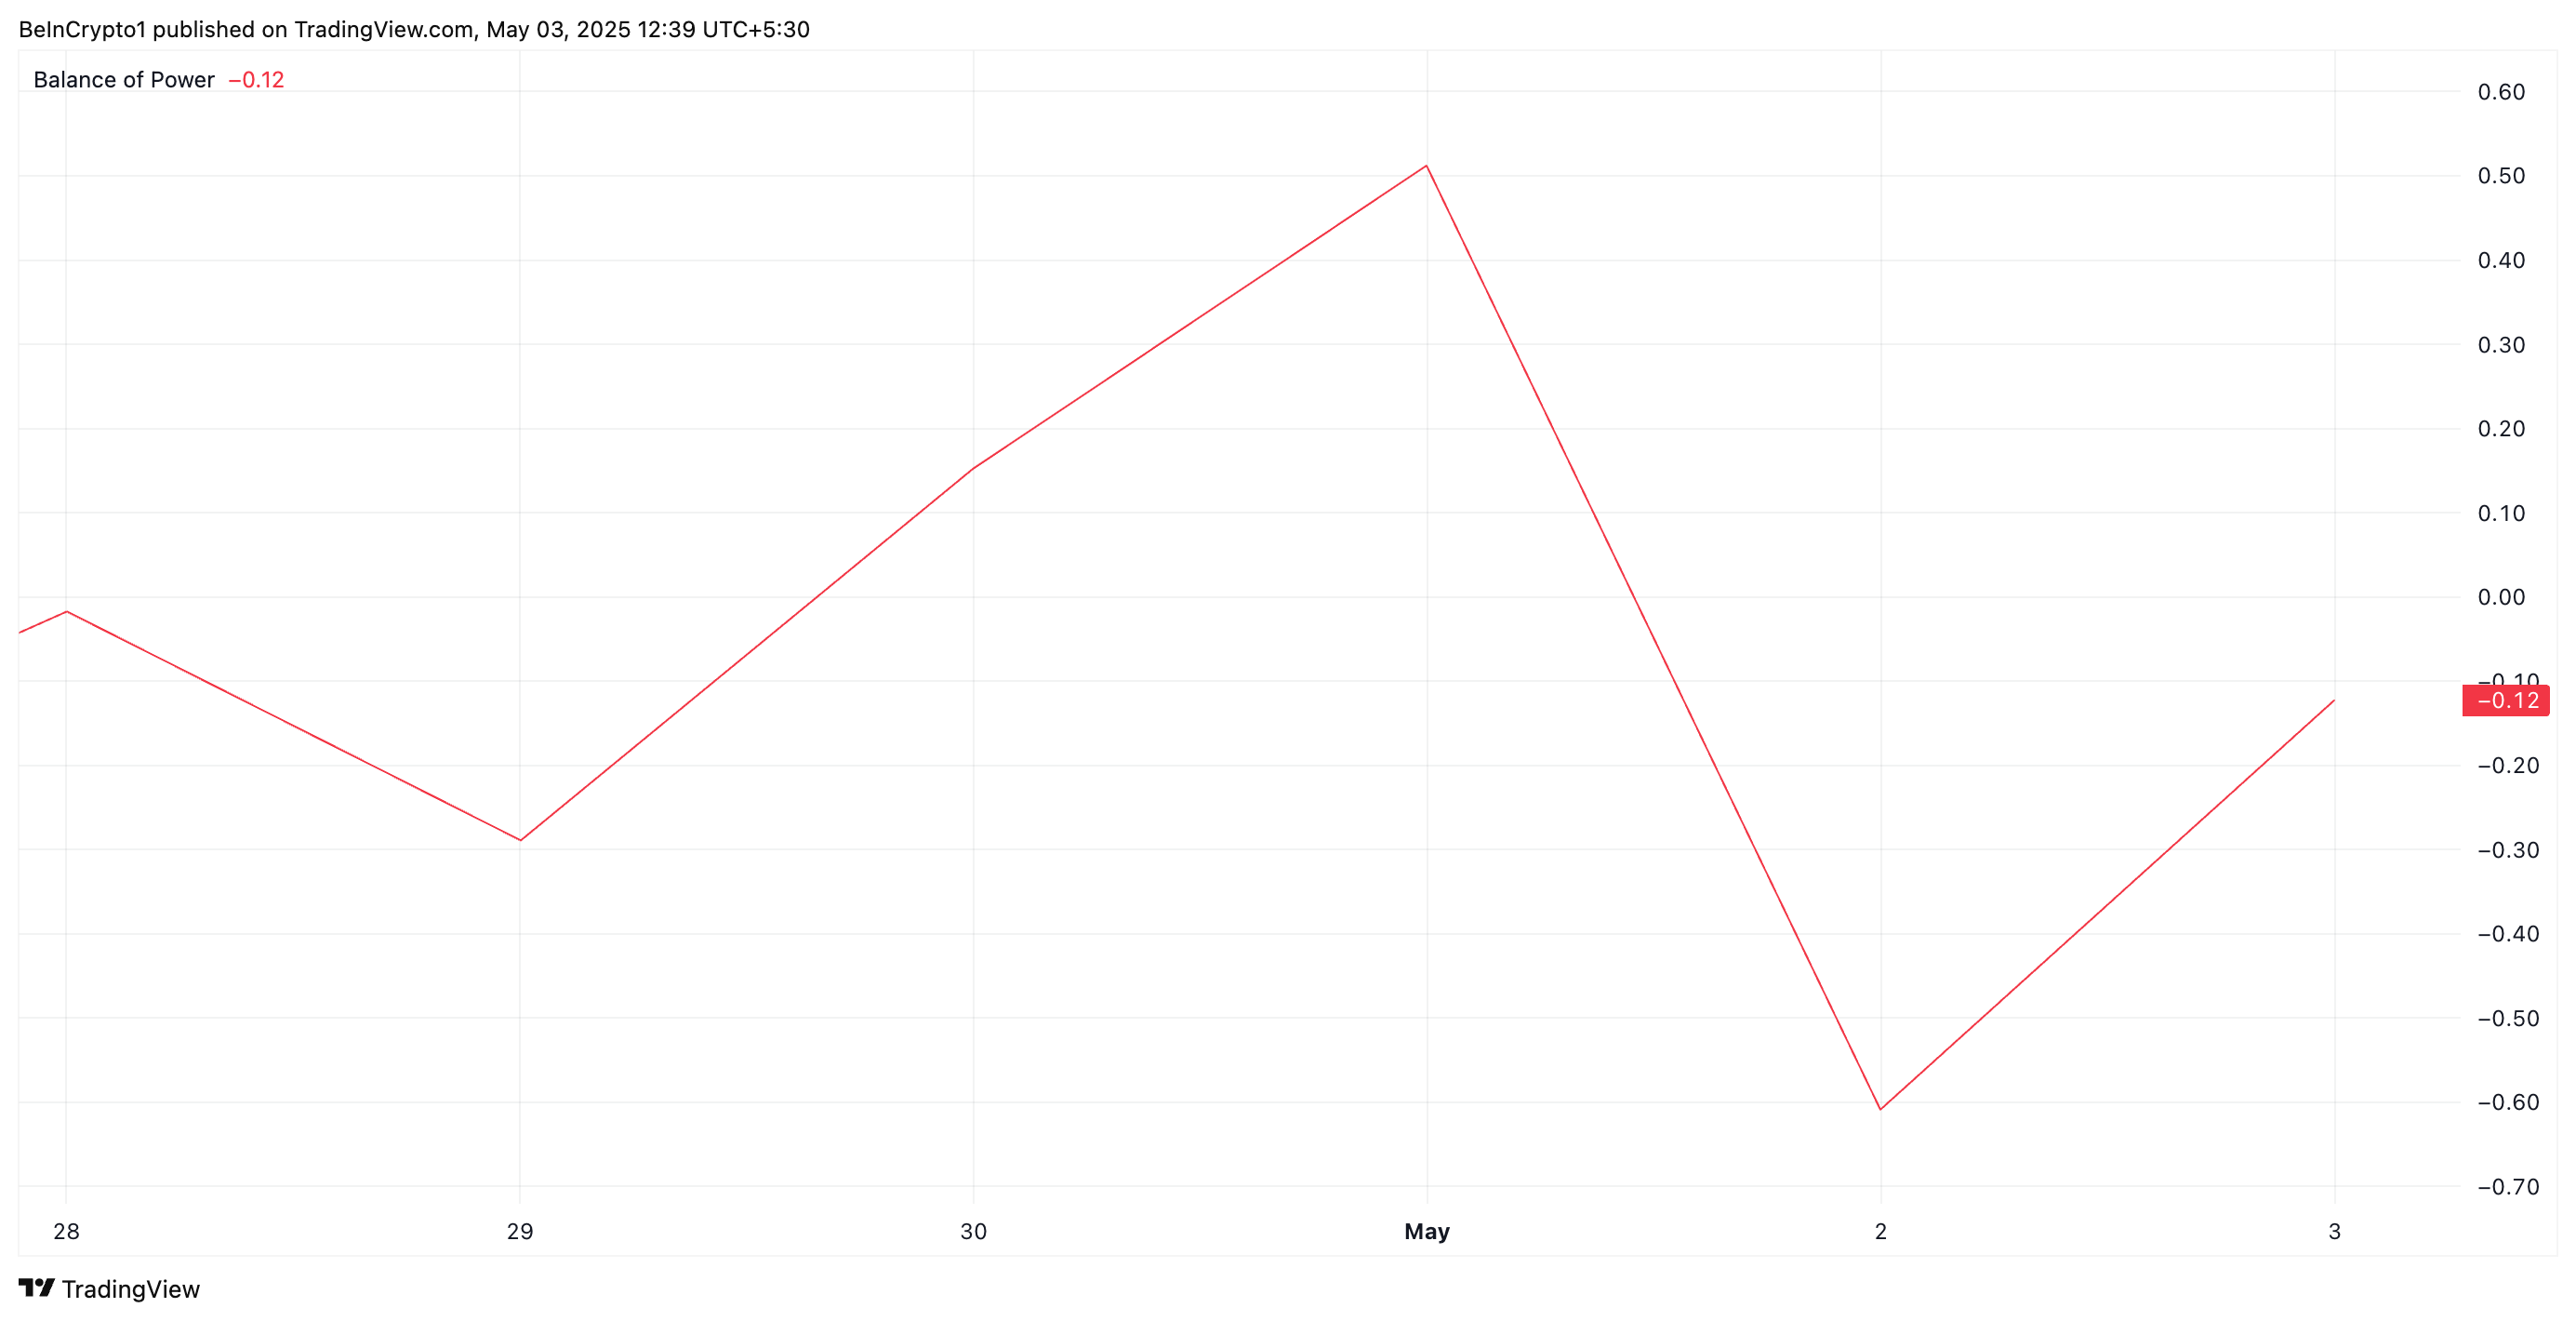
The BoP indicator measures the strength of buying versus selling pressure by comparing the closing price to the trading range over a given period.
When an asset’s BoP is positive, it signals that buyers are in control, indicating strong upward momentum and potential for continued price gain.
On the other hand, as with SOL, a negative BoP value indicates that sellers dominate the market. It suggests an increase in downward pressure on SOL and hints at the potential commencement of a new decline phase.
SOL Faces Key Support Test Amid Mounting Sell Pressure
As bearish momentum builds, SOL risks breaking below the support level at $145.68. A decisive break beneath this threshold would confirm a short-term downtrend and potentially trigger a deeper decline toward $142.32.
Should buyers fail to regain control at that point, SOL could slide further to test the lower support at $133.94.
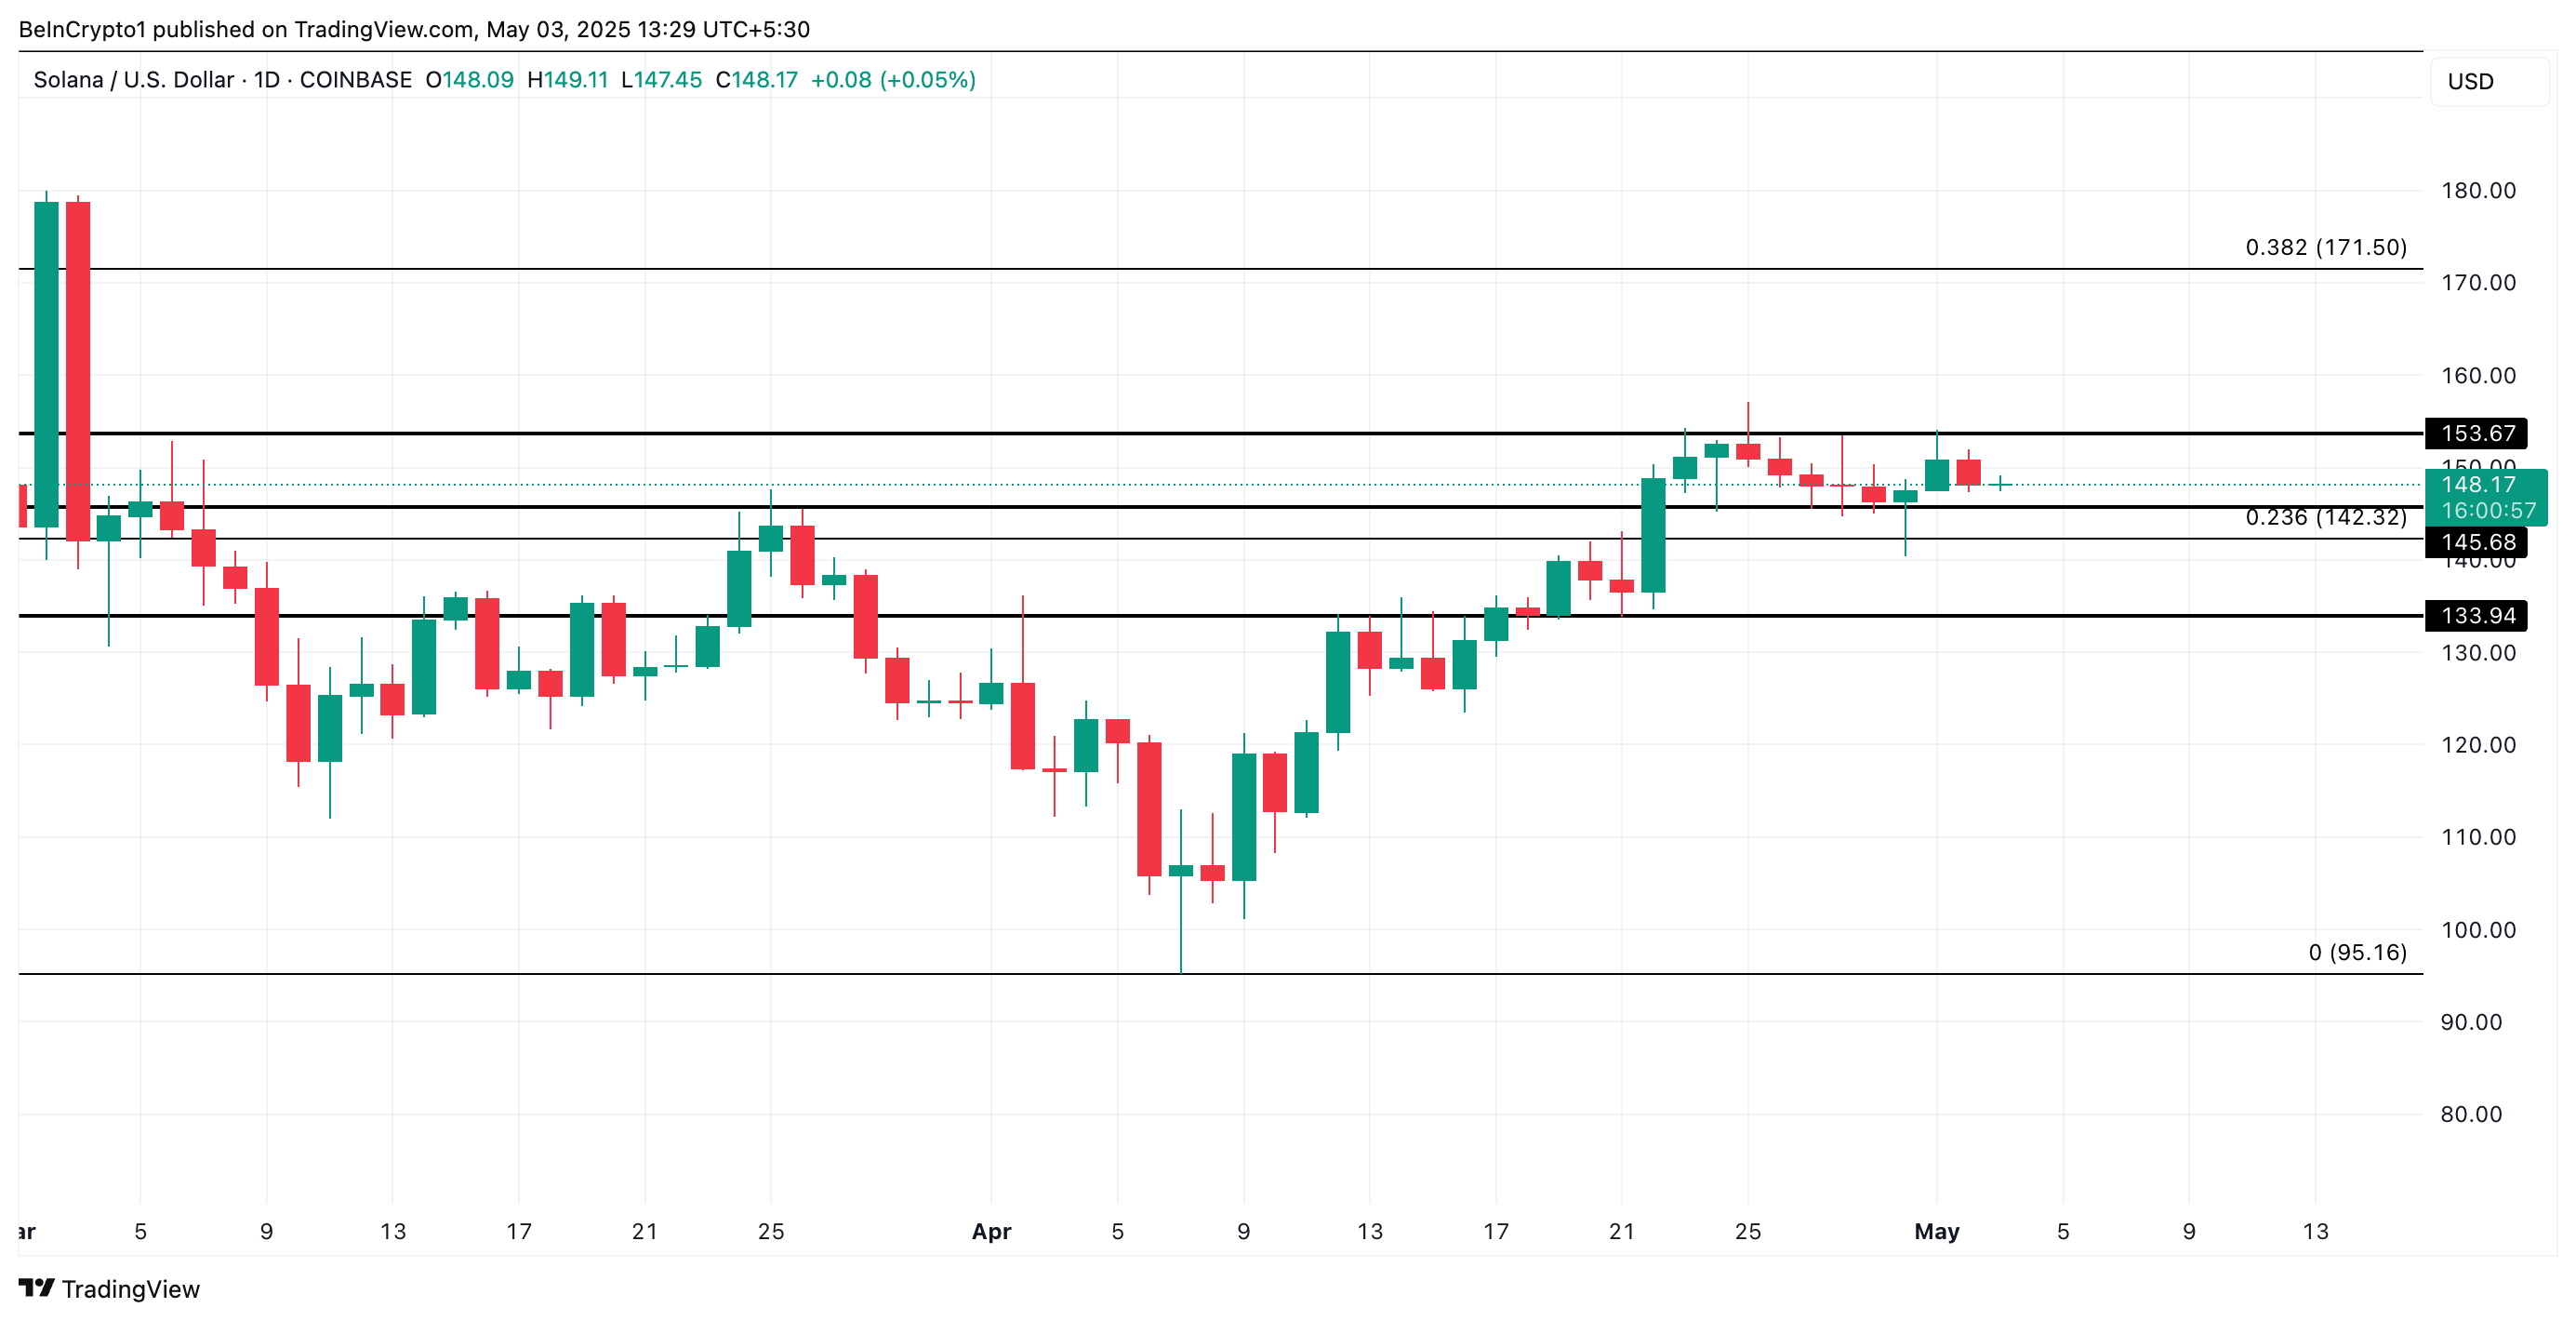
However, this bearish outlook could be invalidated if fresh demand emerges and buying interest strengthens. In that bullish scenario, SOL may overcome resistance at $153.67, opening the door for a rally toward $171.50.
