VIRTUAL Token Rockets 183%—Wall Street’s Late to the Party Again

Virtuals Protocol (VIRTUAL) isn’t just pumping—it’s mooning with a 183% surge as institutional FOMO finally kicks in. Here’s why this isn’t just another dead-cat bounce.
Institutional Money Wakes Up
Hedge funds are scrambling to ape into VIRTUAL after ignoring it at $2.50—now trading above $7.20. Classic case of ’buy high, panic higher’ from the suits.
Technical Tailwinds
The token smashed through its ATH resistance like a hot knife through butter. RSI shows room to run before overbought—no signs of exhaustion yet.
The Cynic’s Corner
Watch the ’smart money’ dump bags on retail once the SEC starts asking questions. Until then? Enjoy the ride.
Smart Money Fuels VIRTUAL’s Rally
VIRTUAL initiated its uptrend on April 22 and has consistently marked new daily price highs since then. As its price climbs, there has been a corresponding rise in its Smart Money Index (SMI), which currently stands at 3.07.
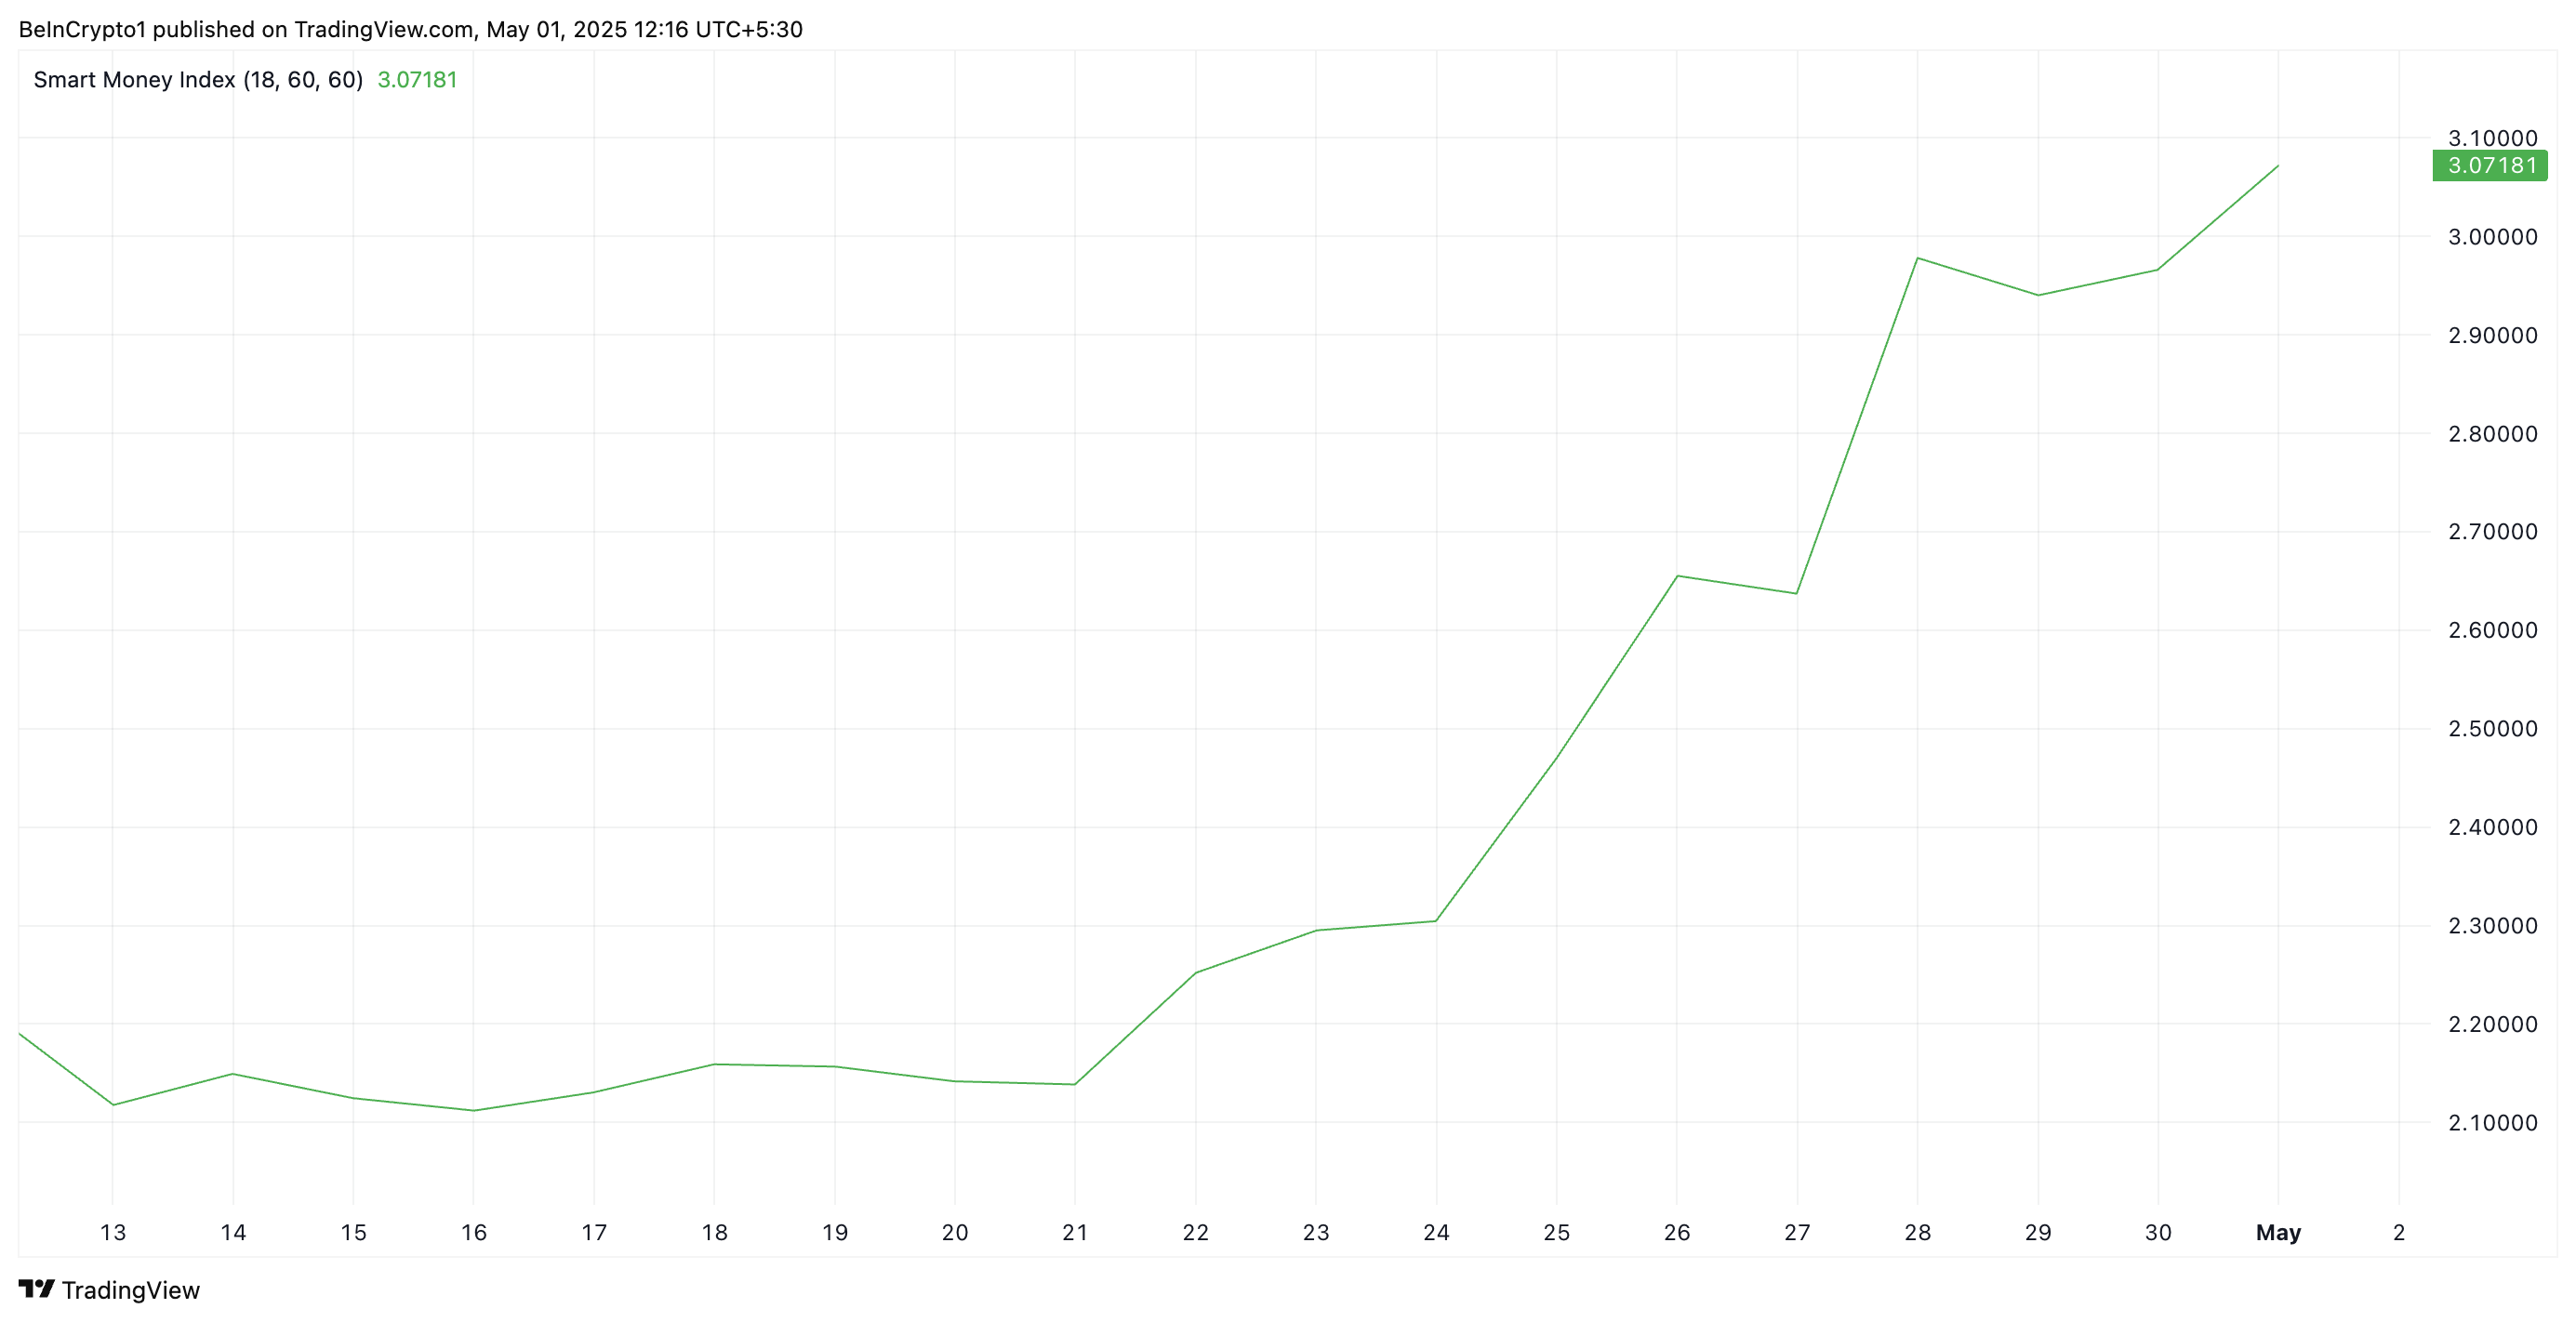
The SMI indicator tracks the trading activity of institutional investors, often referred to as the “smart money.” It analyzes intraday price movements, focusing on the first and last trading hours.
When the SMI rises with an asset’s price, major investors are accumulating positions, reflecting growing confidence in the asset’s upward momentum. The current uptick in VIRTUAL’s SMI suggests that institutional players are actively accumulating the token, likely positioning for further gains.
Further supporting the bullish outlook is the token’s rising Chaikin Money Flow (CMF). As of this writing, this momentum indicator stands at 0.25 and remains in an upward trend.
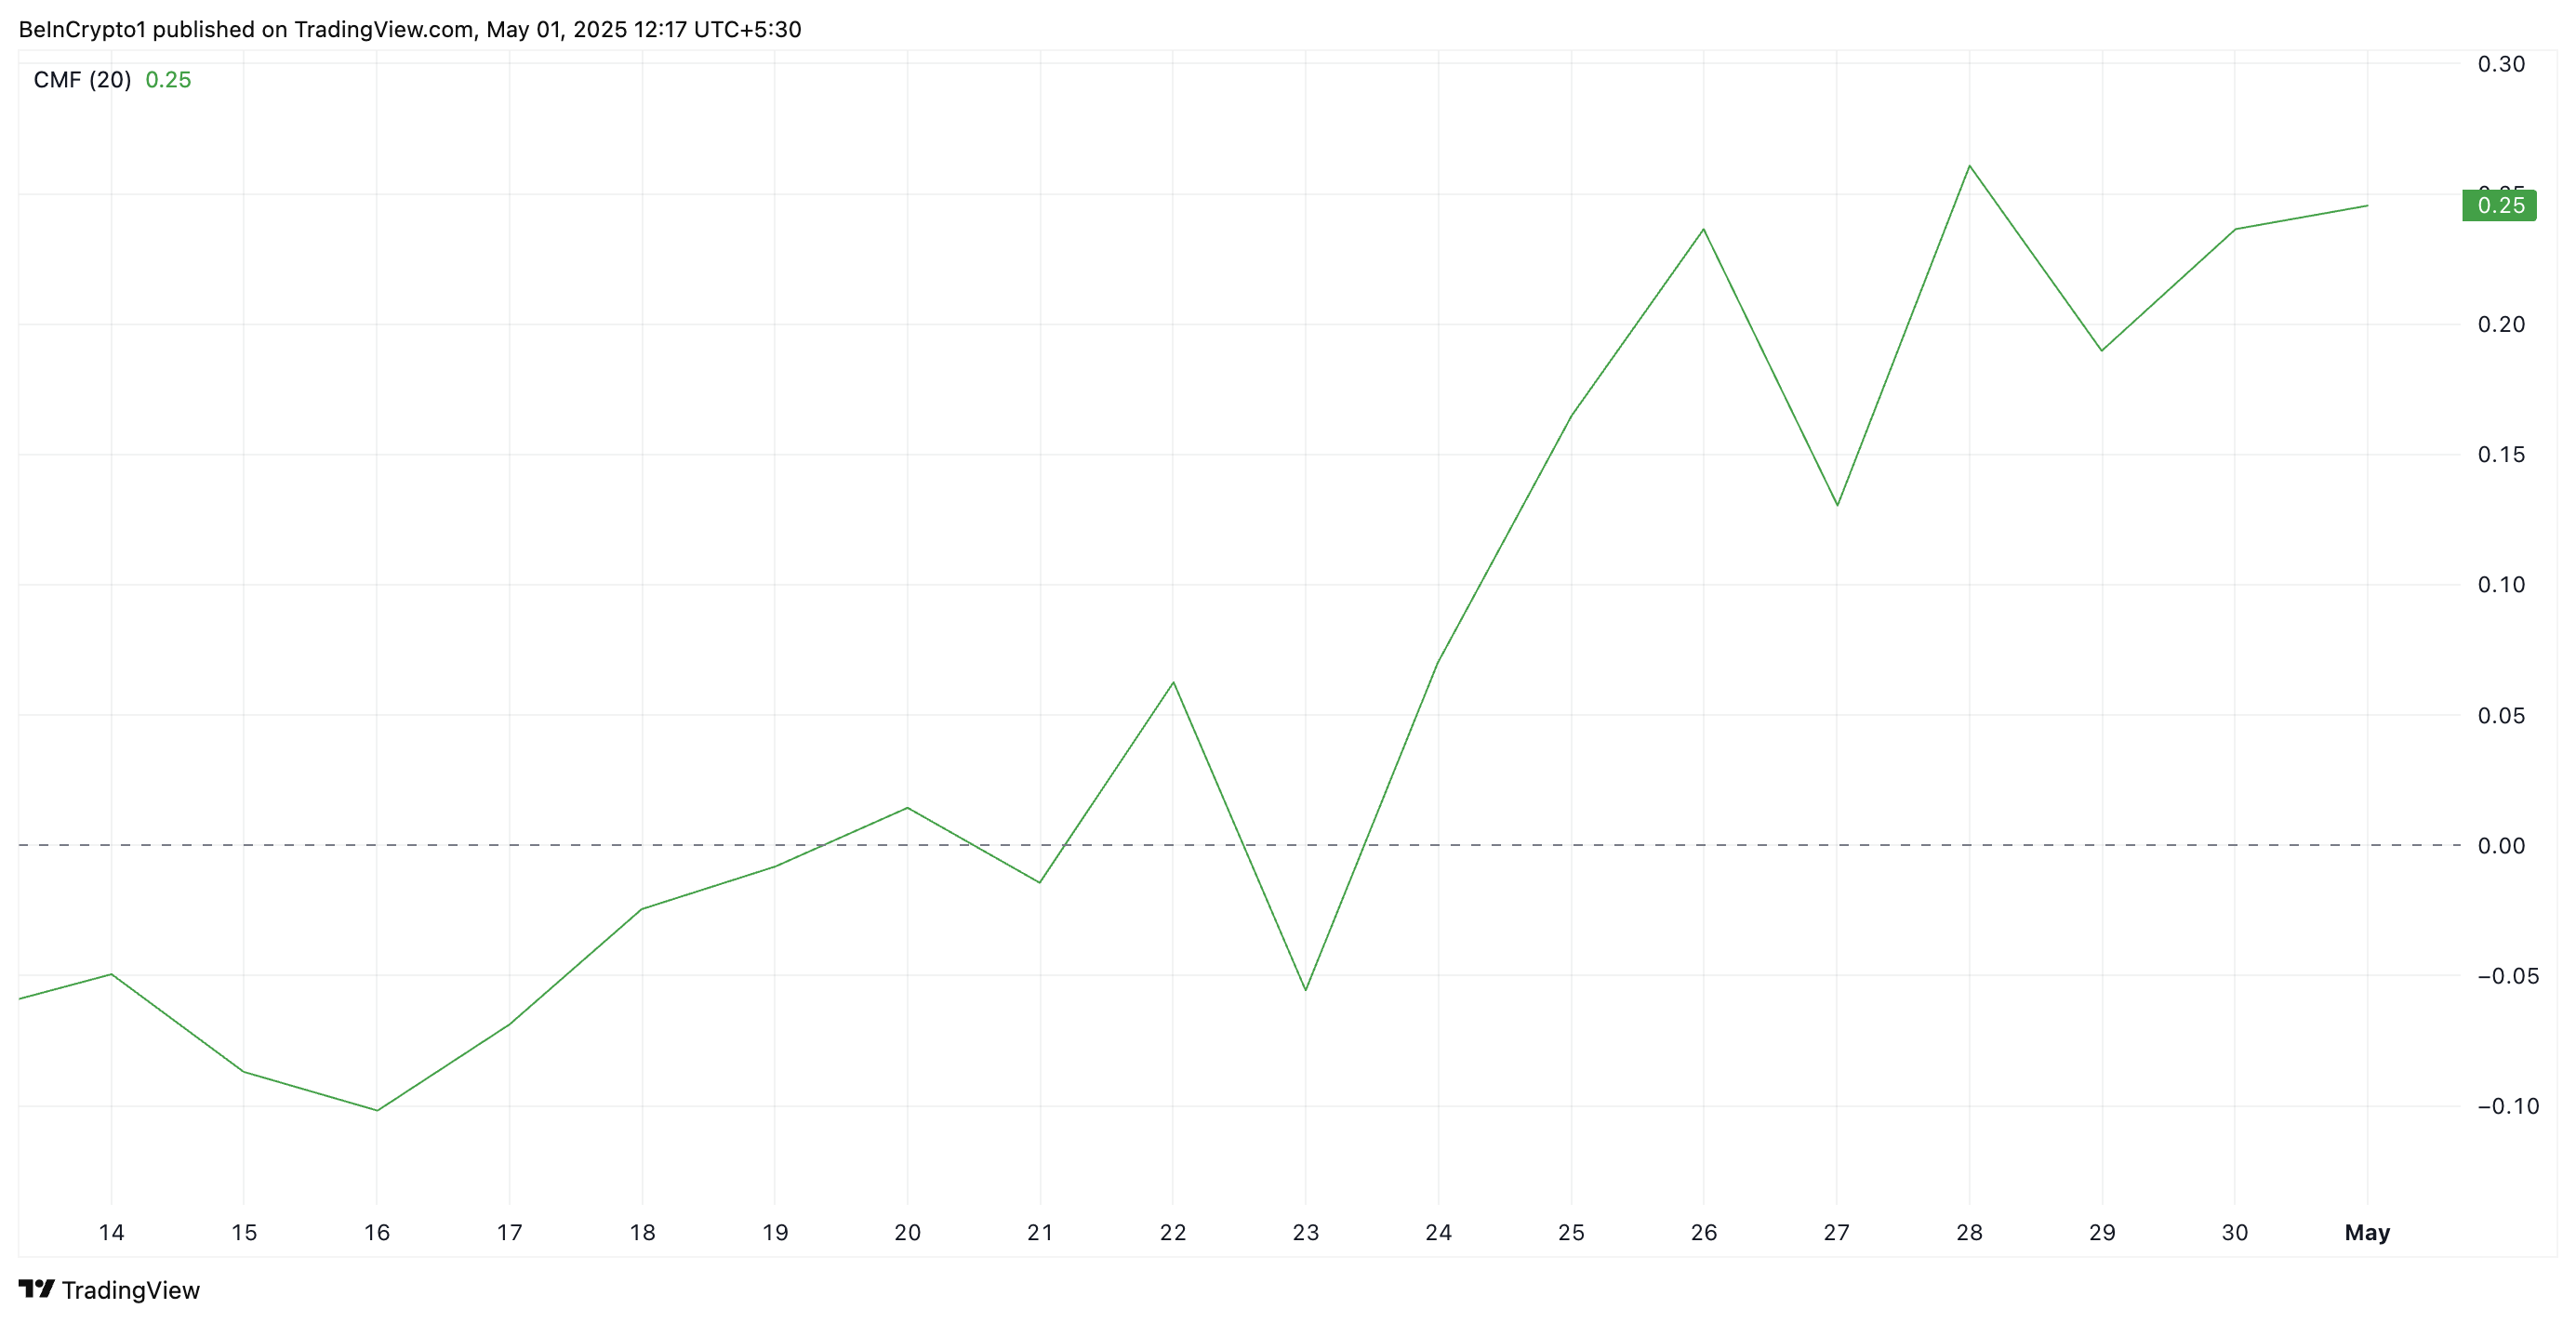
The CMF indicator measures money flow into and out of an asset. A rising CMF like this reflects increased capital inflows and positive sentiment among traders.
Therefore, VIRTUAL’s CMF reading reinforces its price surge and hints at the potential for a continued rally in the short term.
VIRTUAL’s Price Action Hints at Further Upside
VIRTUAL’s triple-digit rally since April 22 has caused it to trade within an ascending parallel channel. This pattern is formed when an asset’s price consistently makes higher highs and higher lows, moving within two upward-sloping, parallel trendlines.
It signals a bullish trend, suggesting that the asset’s price may continue rising as long as it stays within the channel. If demand strengthens and VIRTUAL climbs, remaining within the channel, it could trade at $2.26.
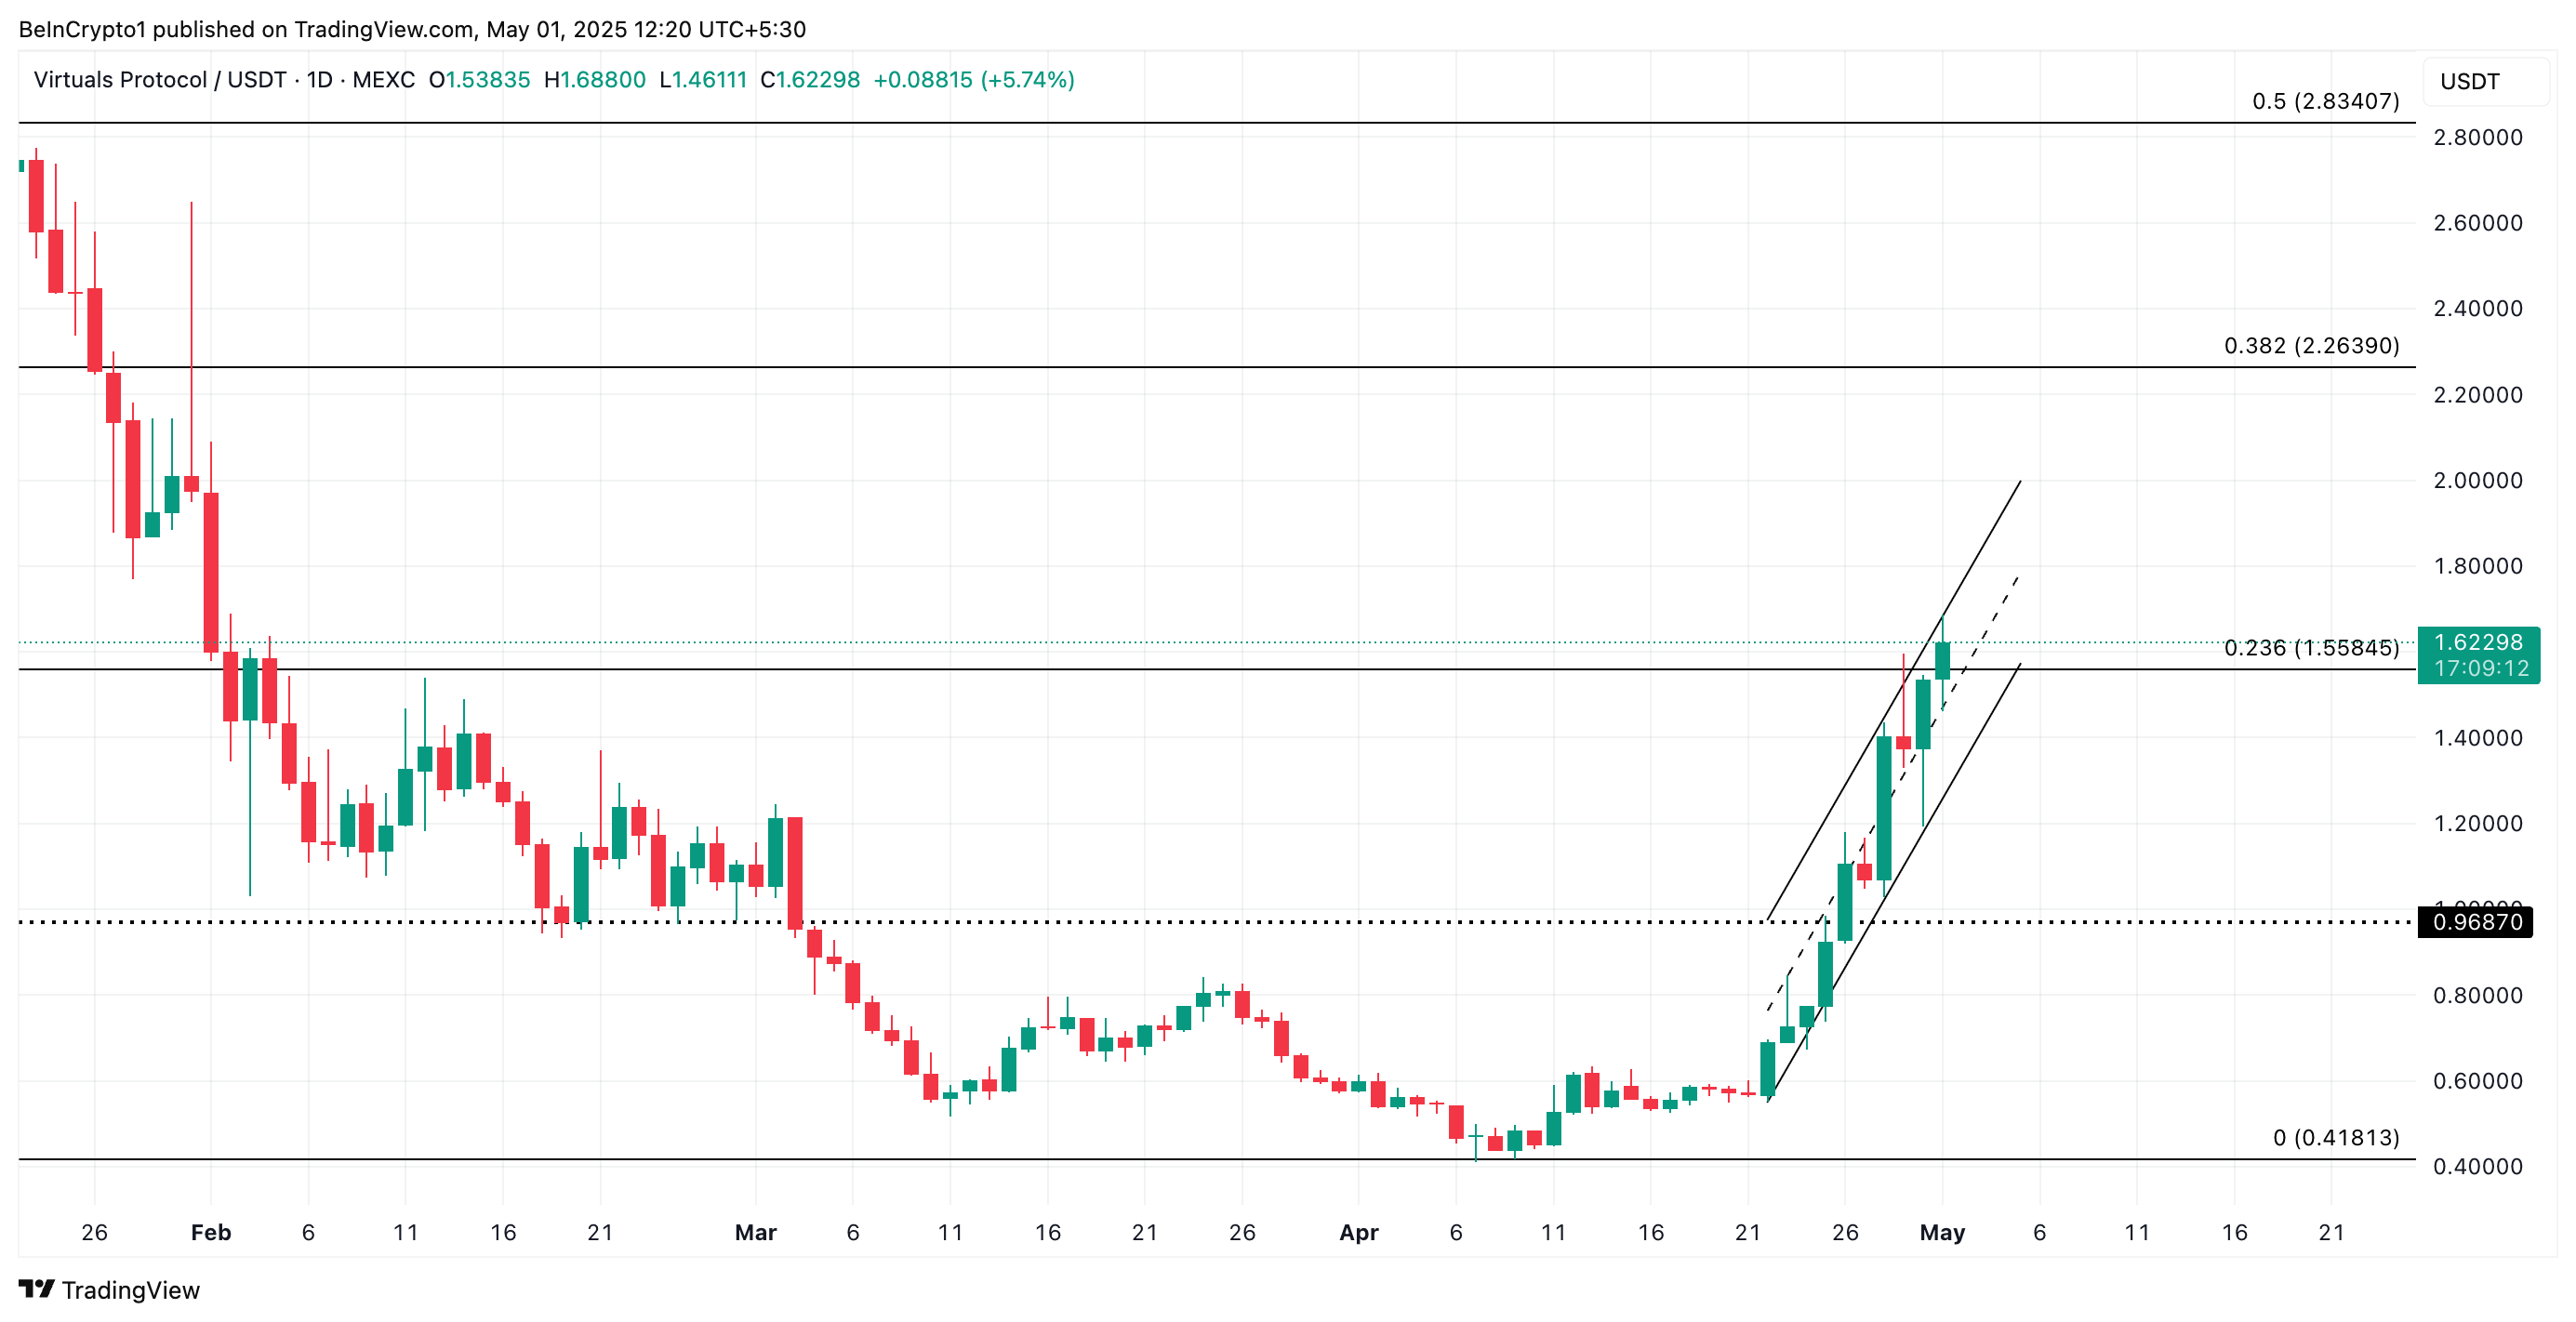
However, a resurgence in profit-taking activity will prevent this bullish projection. If selloffs begin, the VIRTUAL token could lose recent gains, break below $1.55, and fall toward $0.96.
