KuCoin’s KCS Defies Crypto Slump—Surging Toward 2-Month High

While Bitcoin wobbles and altcoins bleed, KuCoin’s native token KCS is bucking the trend—up 12% this week and eyeing its highest price since March. Traders are piling in as the exchange token flirts with a bullish breakout.
Exchange Tokens: The Unflappable Contrarians
Unlike volatile DeFi coins, exchange tokens like KCS often thrive when markets churn—staking rewards and fee discounts create built-in demand. ’It’s the cockroach of crypto,’ quips one analyst. ’Survives nuclear winters while the flashy projects implode.’
Technical Tailwinds
The 58-day resistance level at $14.20 is now in play. A clean break could trigger algorithmic traders to go long—just as Wall Street banks ’coincidentally’ downgrade their crypto forecasts (again).
Buying Pressure Intensifies for KCS
Readings from KCS’ daily chart suggest that bullish pressure is building. Notably, its Relative Strength Index (RSI) is currently at 58.32 and is on an upward trend, confirming the strengthening demand for the altcoin.
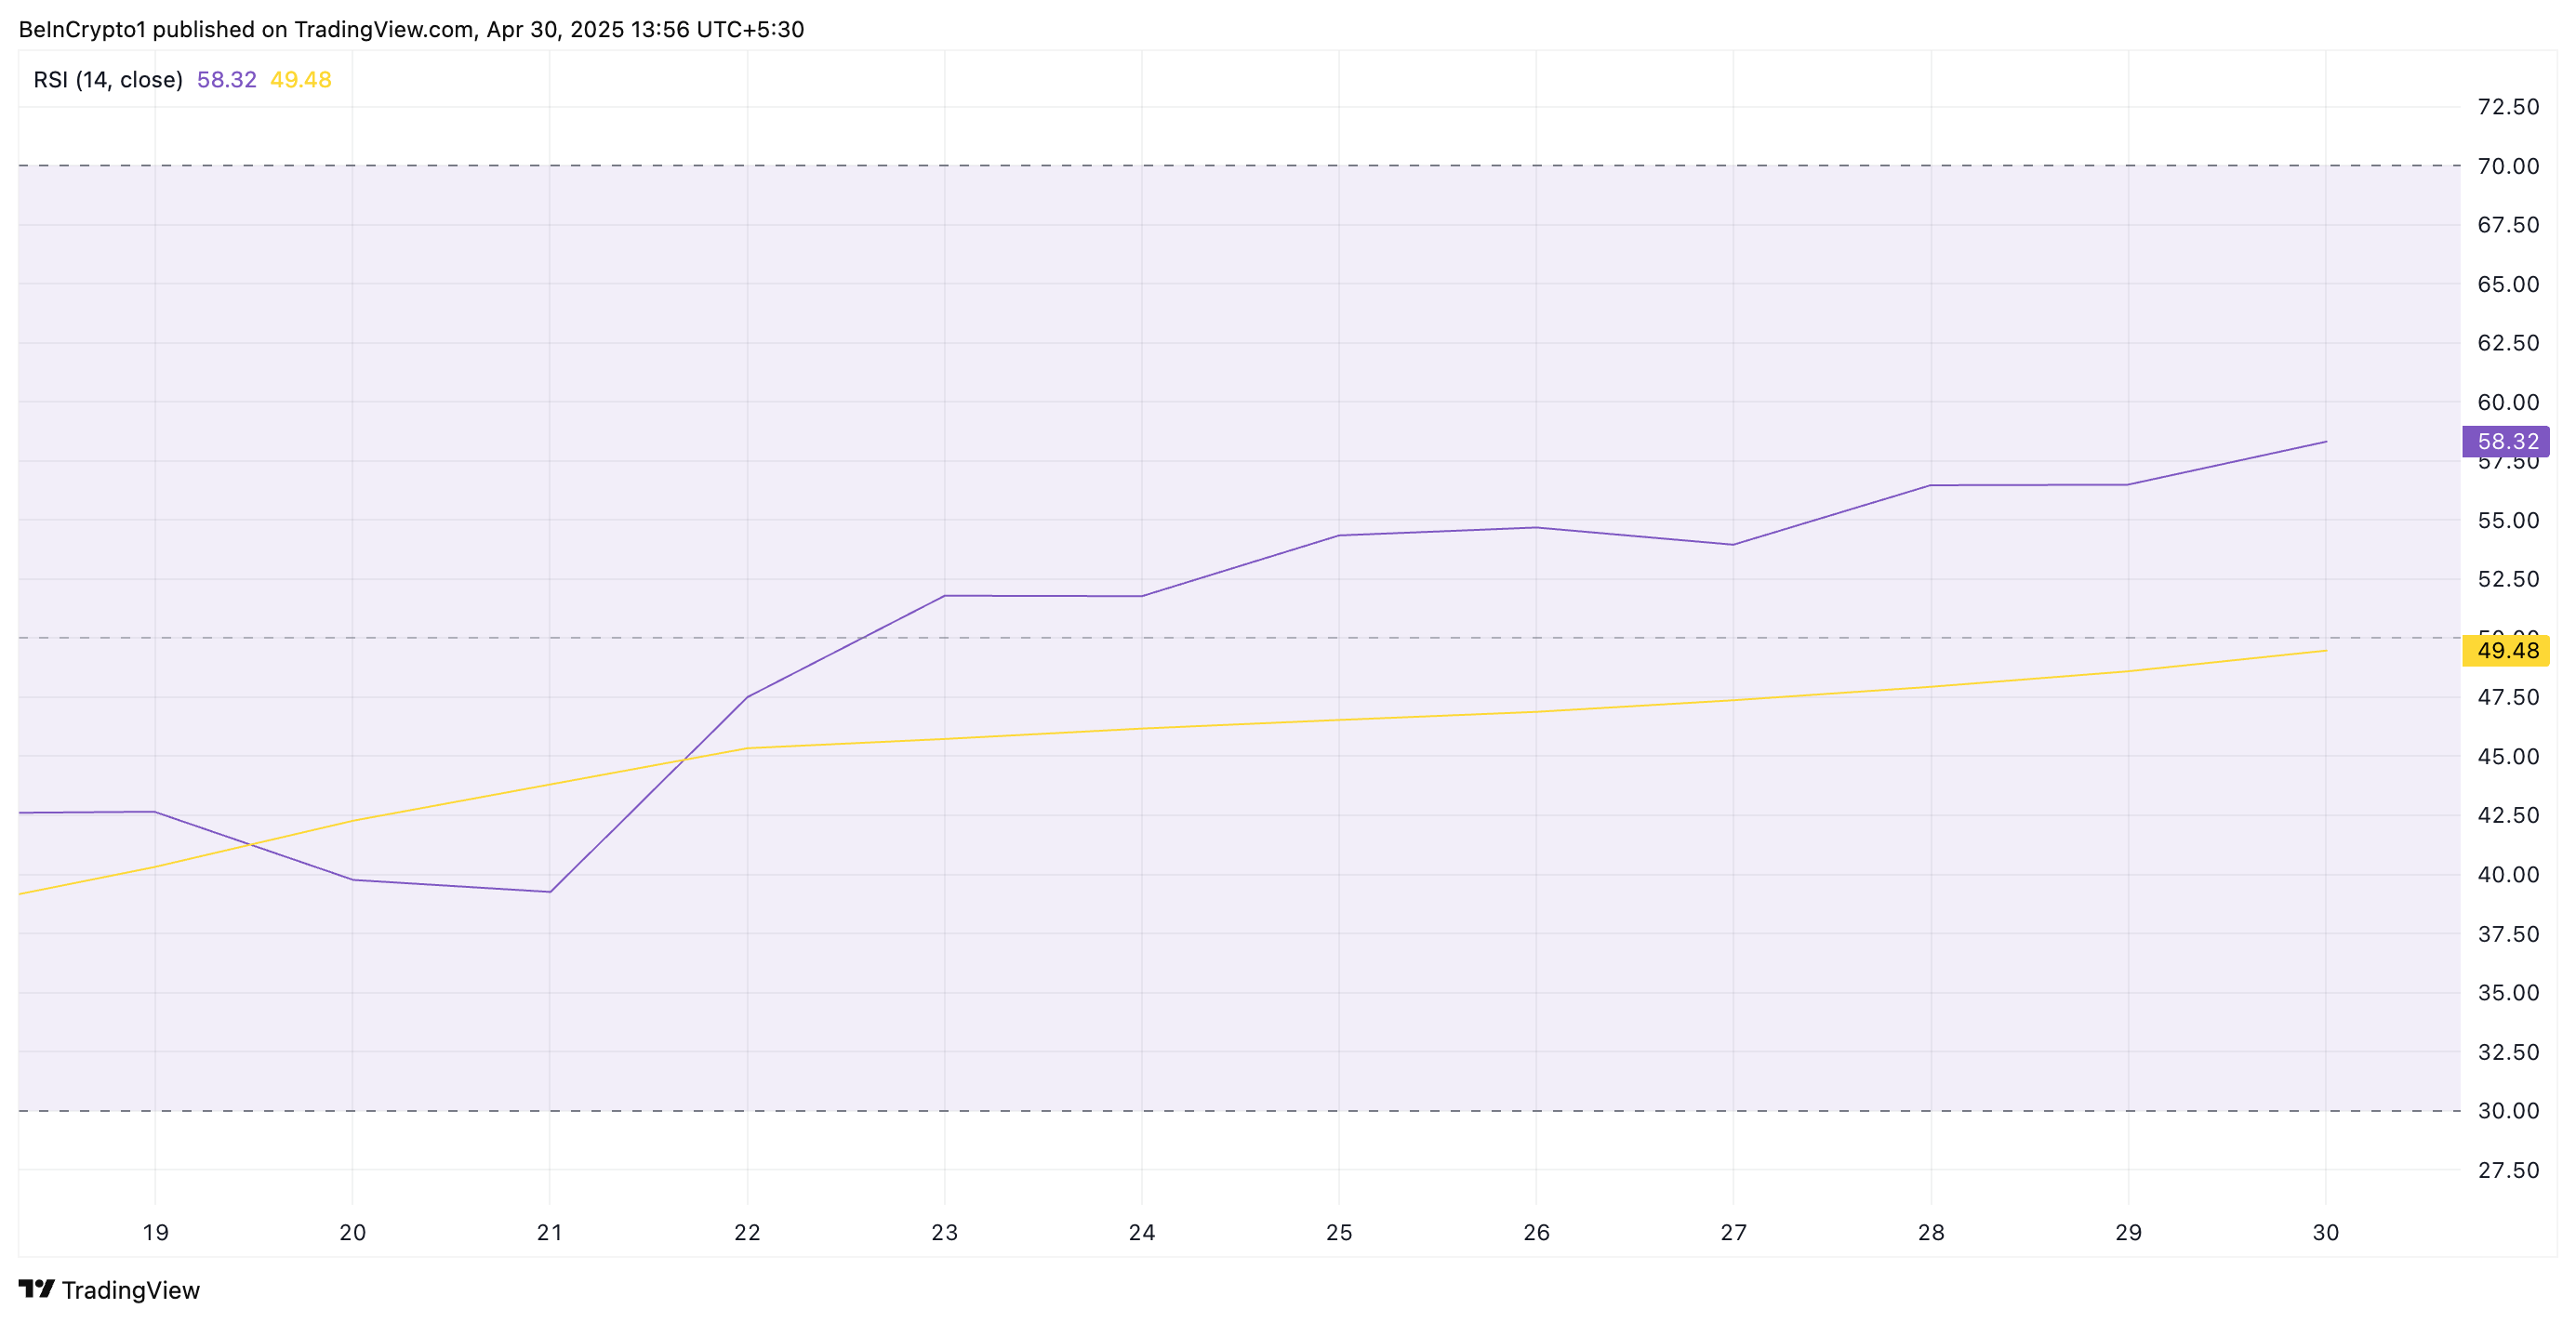
The RSI indicator measures an asset’s overbought and oversold market conditions. It ranges between 0 and 100, with values above 70 suggesting that the asset is overbought and due for a price decline. Converesly, values under 30 indicate that the asset is oversold and may witness a rebound.
At 58.32 and climbing, KCS RSI signals that bullish momentum is gaining traction and buying pressure is intensifying.
Moreover, the token’s Moving Average Convergence Divergence (MACD) confirms this positive trend. As of this writing, KCS’ MACD line (blue) rests above its signal line (orange).

An asset’s MACD indicator identifies trends and momentum in its price movement. It helps traders spot potential buy or sell signals through crossovers between the MACD and signal lines.
As in KCS’ case, when the MACD line is above the signal line, it indicates bullish momentum in the market. Also, traders often view this setup as a buy signal; hence, they might be prompted to buy more KCS tokens, further driving up its short-term value.
KCS Tests Critical Level as Bulls Aim for 58-Day High
KCS currently trades at $10.71, resting just below the resistance formed at $10.90. If the demand for the altcoin grows and it successfully flips this price barrier into a support floor, it could propel KCS to $11.77, a high last reached on March 3.
However, if KCS holders resume profit-taking, it could lose its recent gains and fall to $10.027.
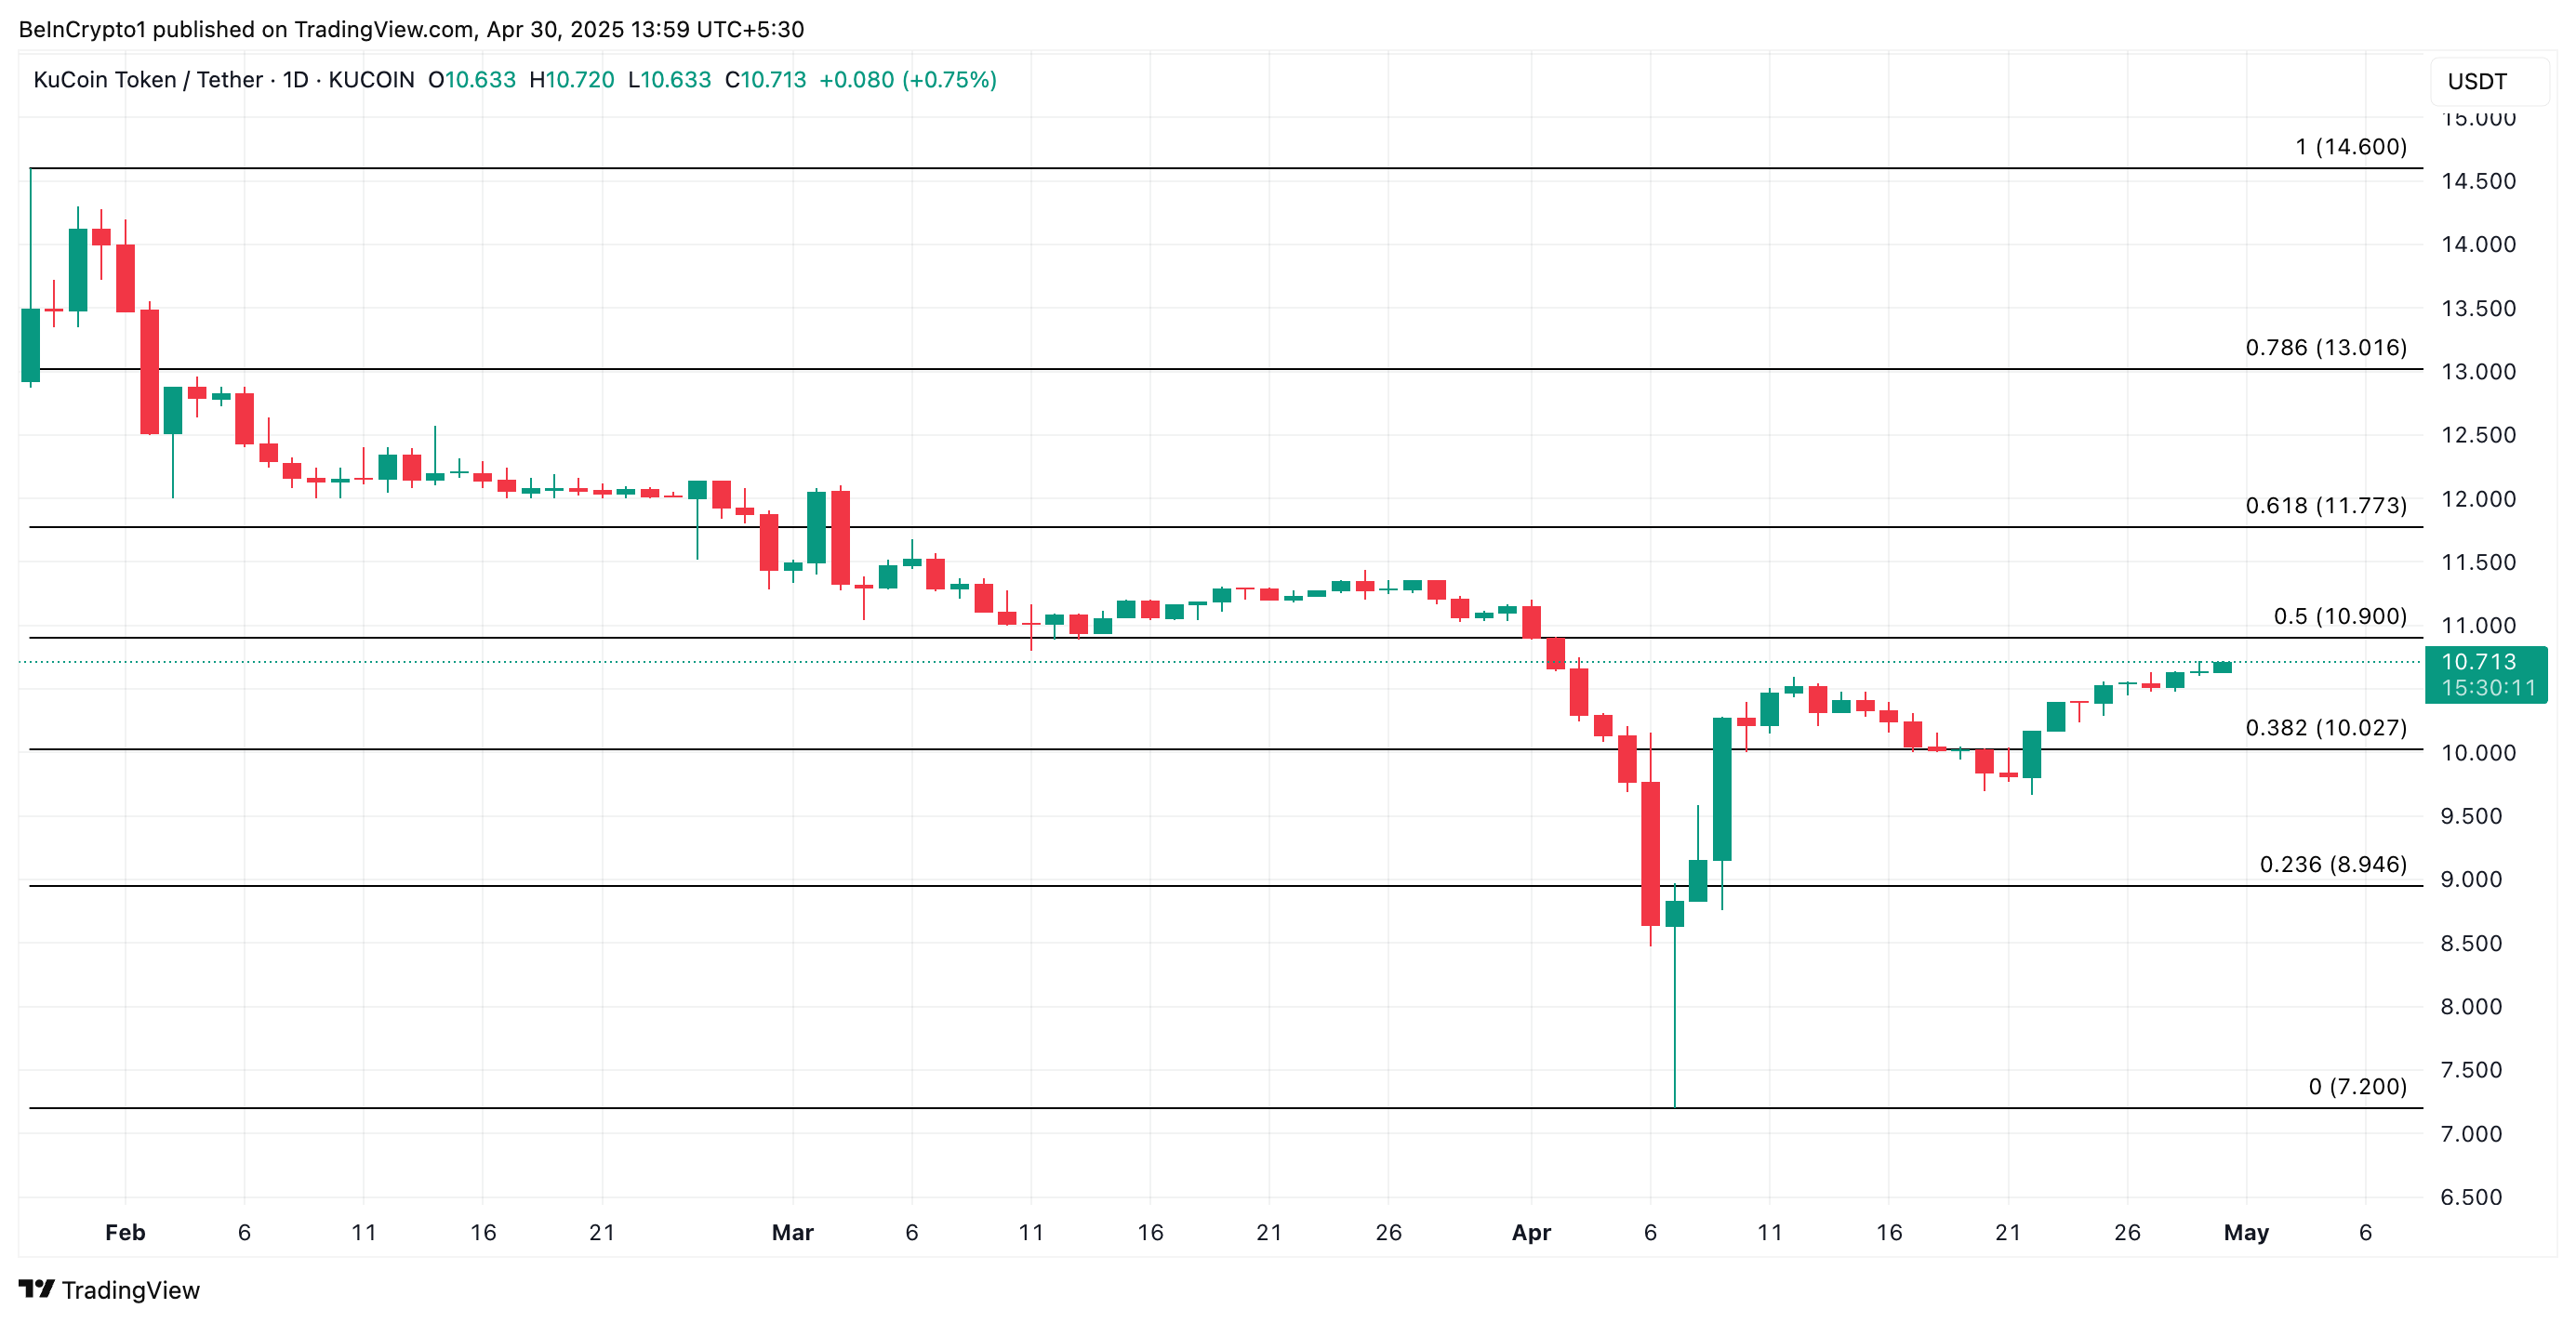
If the bulls fail to defend this support level, KCS could extend its decline, break below $10 to trade at $8.94.
