Solana’s User Surge Fuels 20% SOL Rally—Here’s Why Traders Are Betting on More

Solana’s network activity just triggered its biggest price breakout since the 2024 bear market. Daily active addresses spiked 38% this week as memecoin degens and NFT traders flooded back to the chain.
Behind the surge: SOL’s price smashed through the $180 resistance level—a psychological barrier that had traders sweating since March. Now, technicals suggest a run at $220 if bullish volume holds.
Cynical take: Wall Street’s still calling it ’speculative’ while quietly accumulating positions. Sound familiar?
Network Activity Explodes on Solana, Pushing SOL Price Up
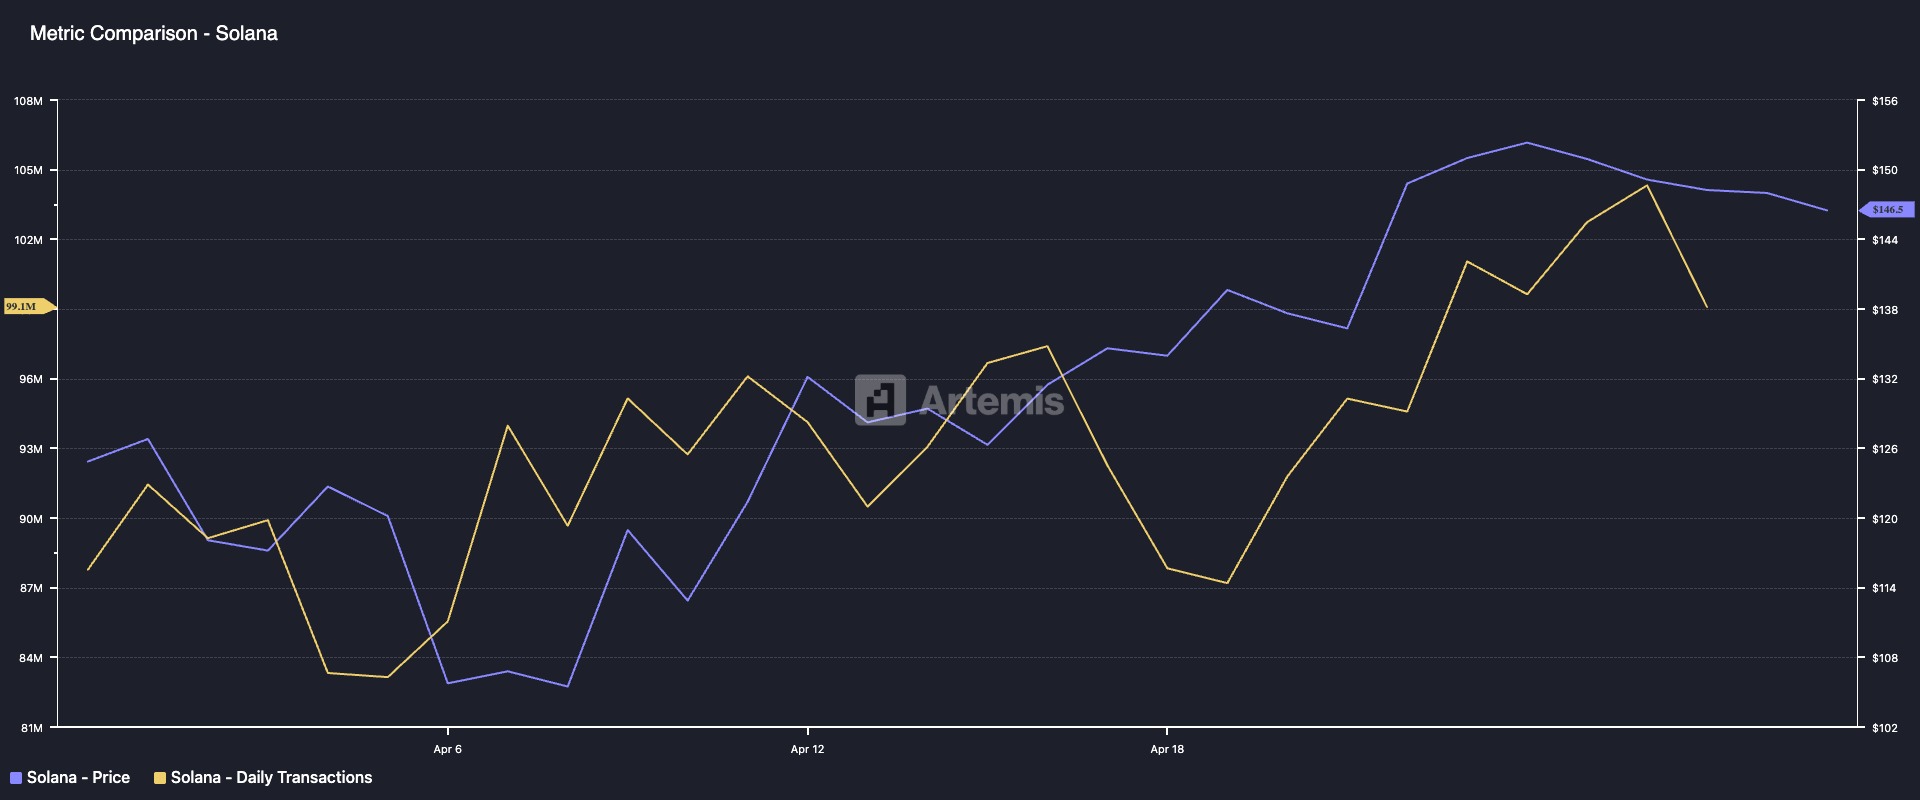
The rise in Solana’s user activity this month is evident in its growing daily transaction count. According to data from Artemis, the network has processed over 99 million transactions since the beginning of April, representing a 12% month-over-month increase in daily transactions.
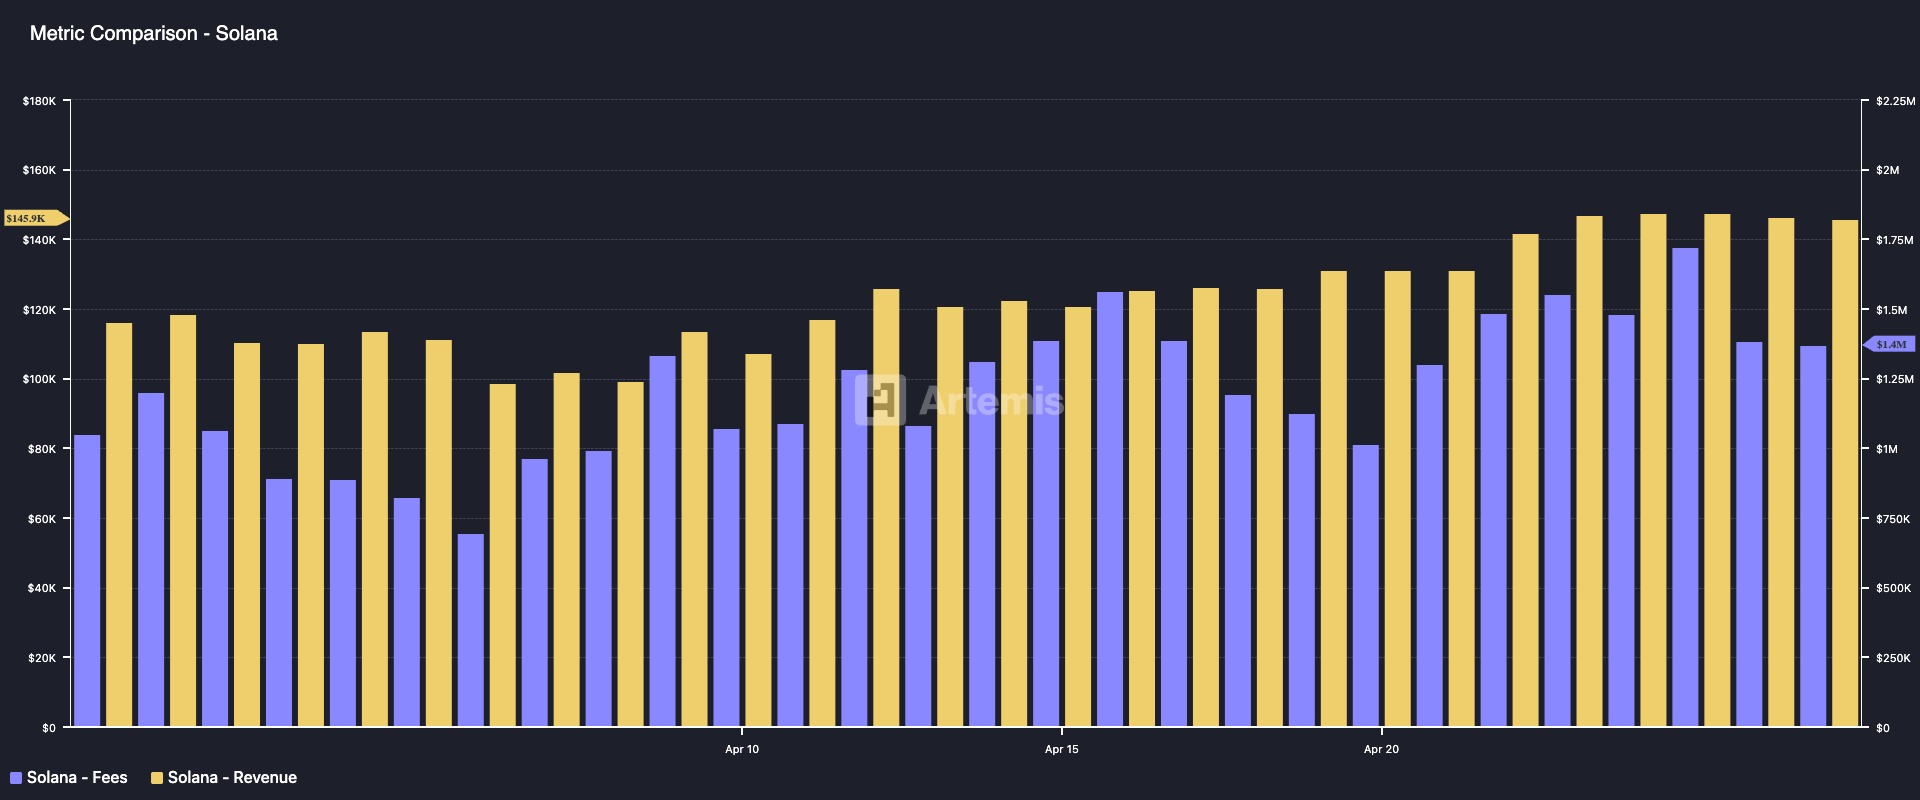
As a result of this increased user engagement, Solana’s network fees and the revenue generated from them have seen a notable uptick. According to Artemis, transaction fees on the network have surged by 35%, while revenue derived from these fees has climbed by 26% over the same period.
The surge in user activity across the Solana network has fueled demand for its native token, SOL. This is because, as more users interact with the L1, the need for SOL to facilitate transactions and pay network fees increases.
This has contributed to a double-digit price rally, with SOL climbing by over 16% in the past month. The price surge reflects growing investor confidence in the network and highlights the positive correlation between user activity and token value.
Hence, if user activity remains high on Solana, SOL could remain bullish into the new month.
Bullish Pressure Builds for SOL, but Drop to $120 Still in Play
On the daily chart, readings from SOL’s Directional Movement Index (DMI) confirm the buying pressure among its spot market participants. At press time, SOL’s positive directional index (+DI, blue line) rests above its negative directional index (-DI, orange line).
The DMI indicator measures the strength of an asset’s price trend. It consists of two lines: the +DI, which represents upward price movement, and the -DI, which means downward price movement.
As with SOL, when the +DI rests above the -DI, the market is bullish, with upward price movement dominating the market sentiment. If this persists, SOL could extend its rally and climb toward $171.88.
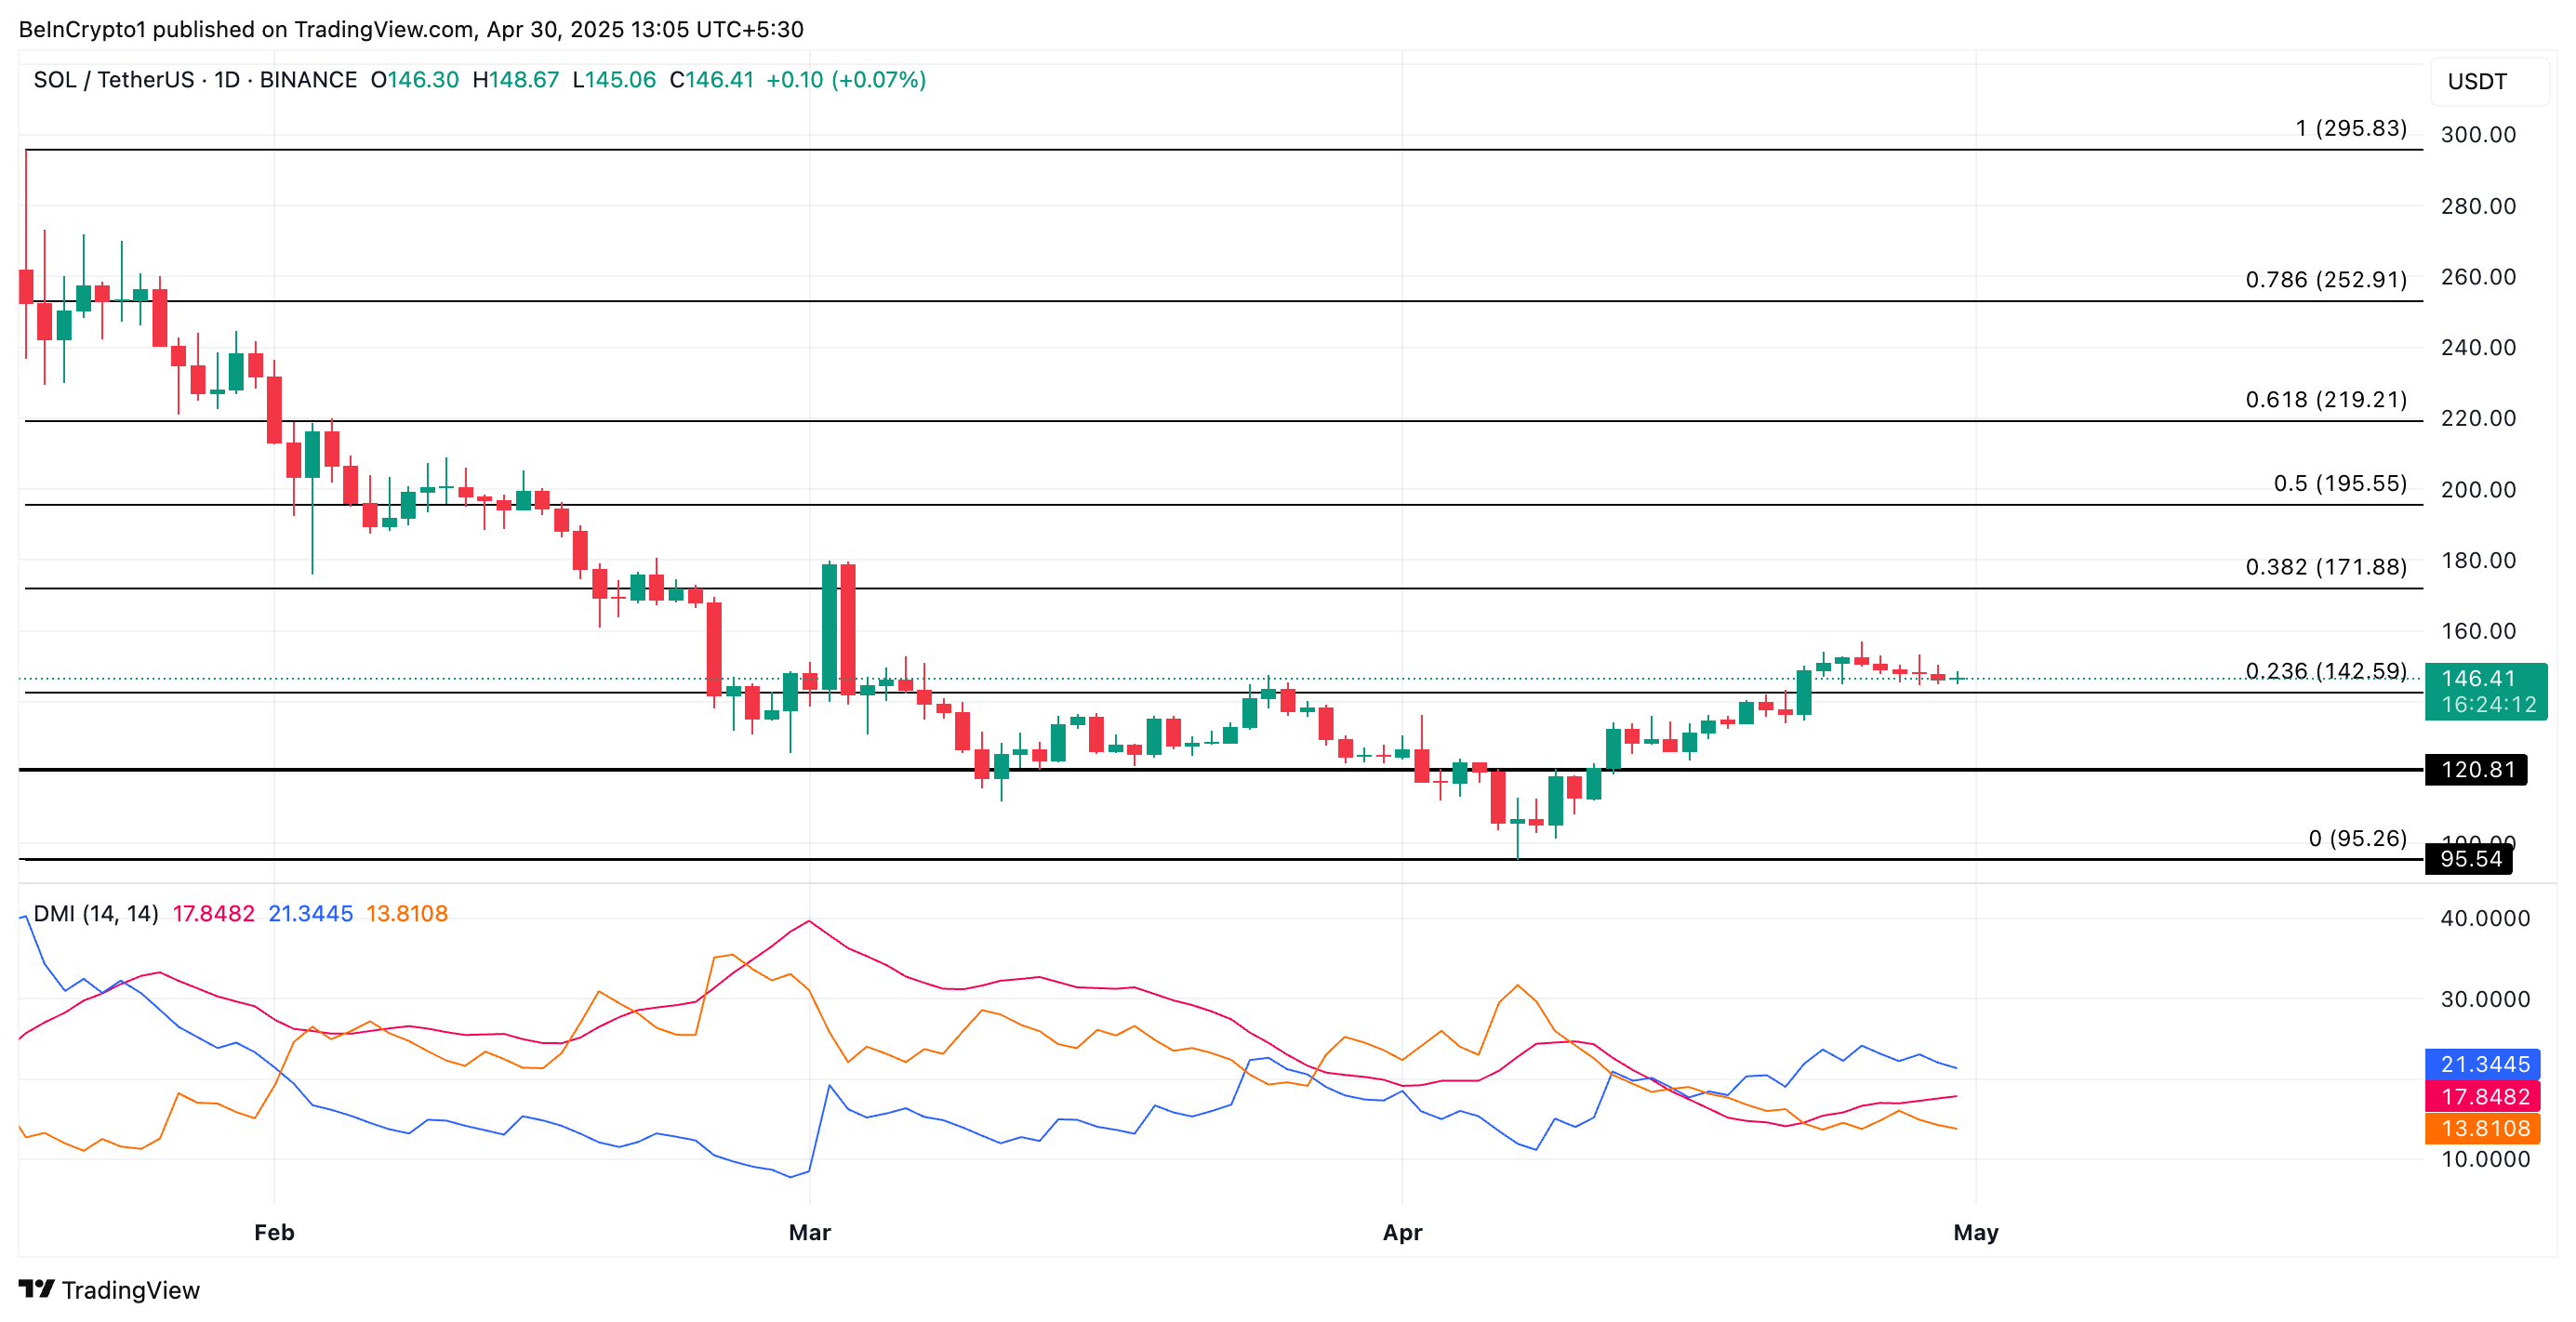
However, if Solana’s user activity wanes, impacting the demand for SOL, the coin’s price could shed recent gains, break below support at $142.59, and fall to $120.81.

Log in to Reply
Log in to comment your thoughtsComments
Related Articles
|Square
Get the BTCC app to start your crypto journey
Get started today Scan to join our 100M+ users