Pi Network (PI) Stalls at Market Crossroads—Will the Breakout Play Deliver?

Pi Network’s token wobbles in no-man’s land as traders eye a decisive move. The mobile-mined crypto—once hailed as the ’people’s coin’—now faces its make-or-break moment.
Key levels to watch: Resistance at $314.15 (because why not pick a random number?) versus support at $280. Bulls whisper about Mainnet momentum; bears snort at another ’revolutionary’ project stuck in beta purgatory.
One thing’s certain: Wall Street’s algo-traders are watching—if only to short the retail bagholders when this thing finally wakes up.
PI’s Price Action in Limbo
Readings from PI’s Aroon indicator confirm the recent stagnation in its price. As of this writing, the token’s Aroon Up Line (yellow) is at 0%, while its Aroon Down Line (blue) is in decline at 14.29%.

The Aroon indicator identifies market trends and determines whether a trend is strong or weak.
A 0% reading on the Aroon Up Line suggests that PI has not reached a new high recently, signaling a lack of upward momentum. Meanwhile, the Aroon Down Line’s decline to 14.29% indicates that the token has not been experiencing significant downward pressure either.
This trend suggests a balanced market, where neither bulls nor bears are taking the lead. The setup confirms that PI is in a consolidation phase, with a breakout in either direction dependent on shifts in market sentiment.
Further, the steady decline in PI’s Average True Range (ATR) since early March confirms the decrease in its market volatility and the shift towards consolidation. At press time, this indicator stands at 0.07.
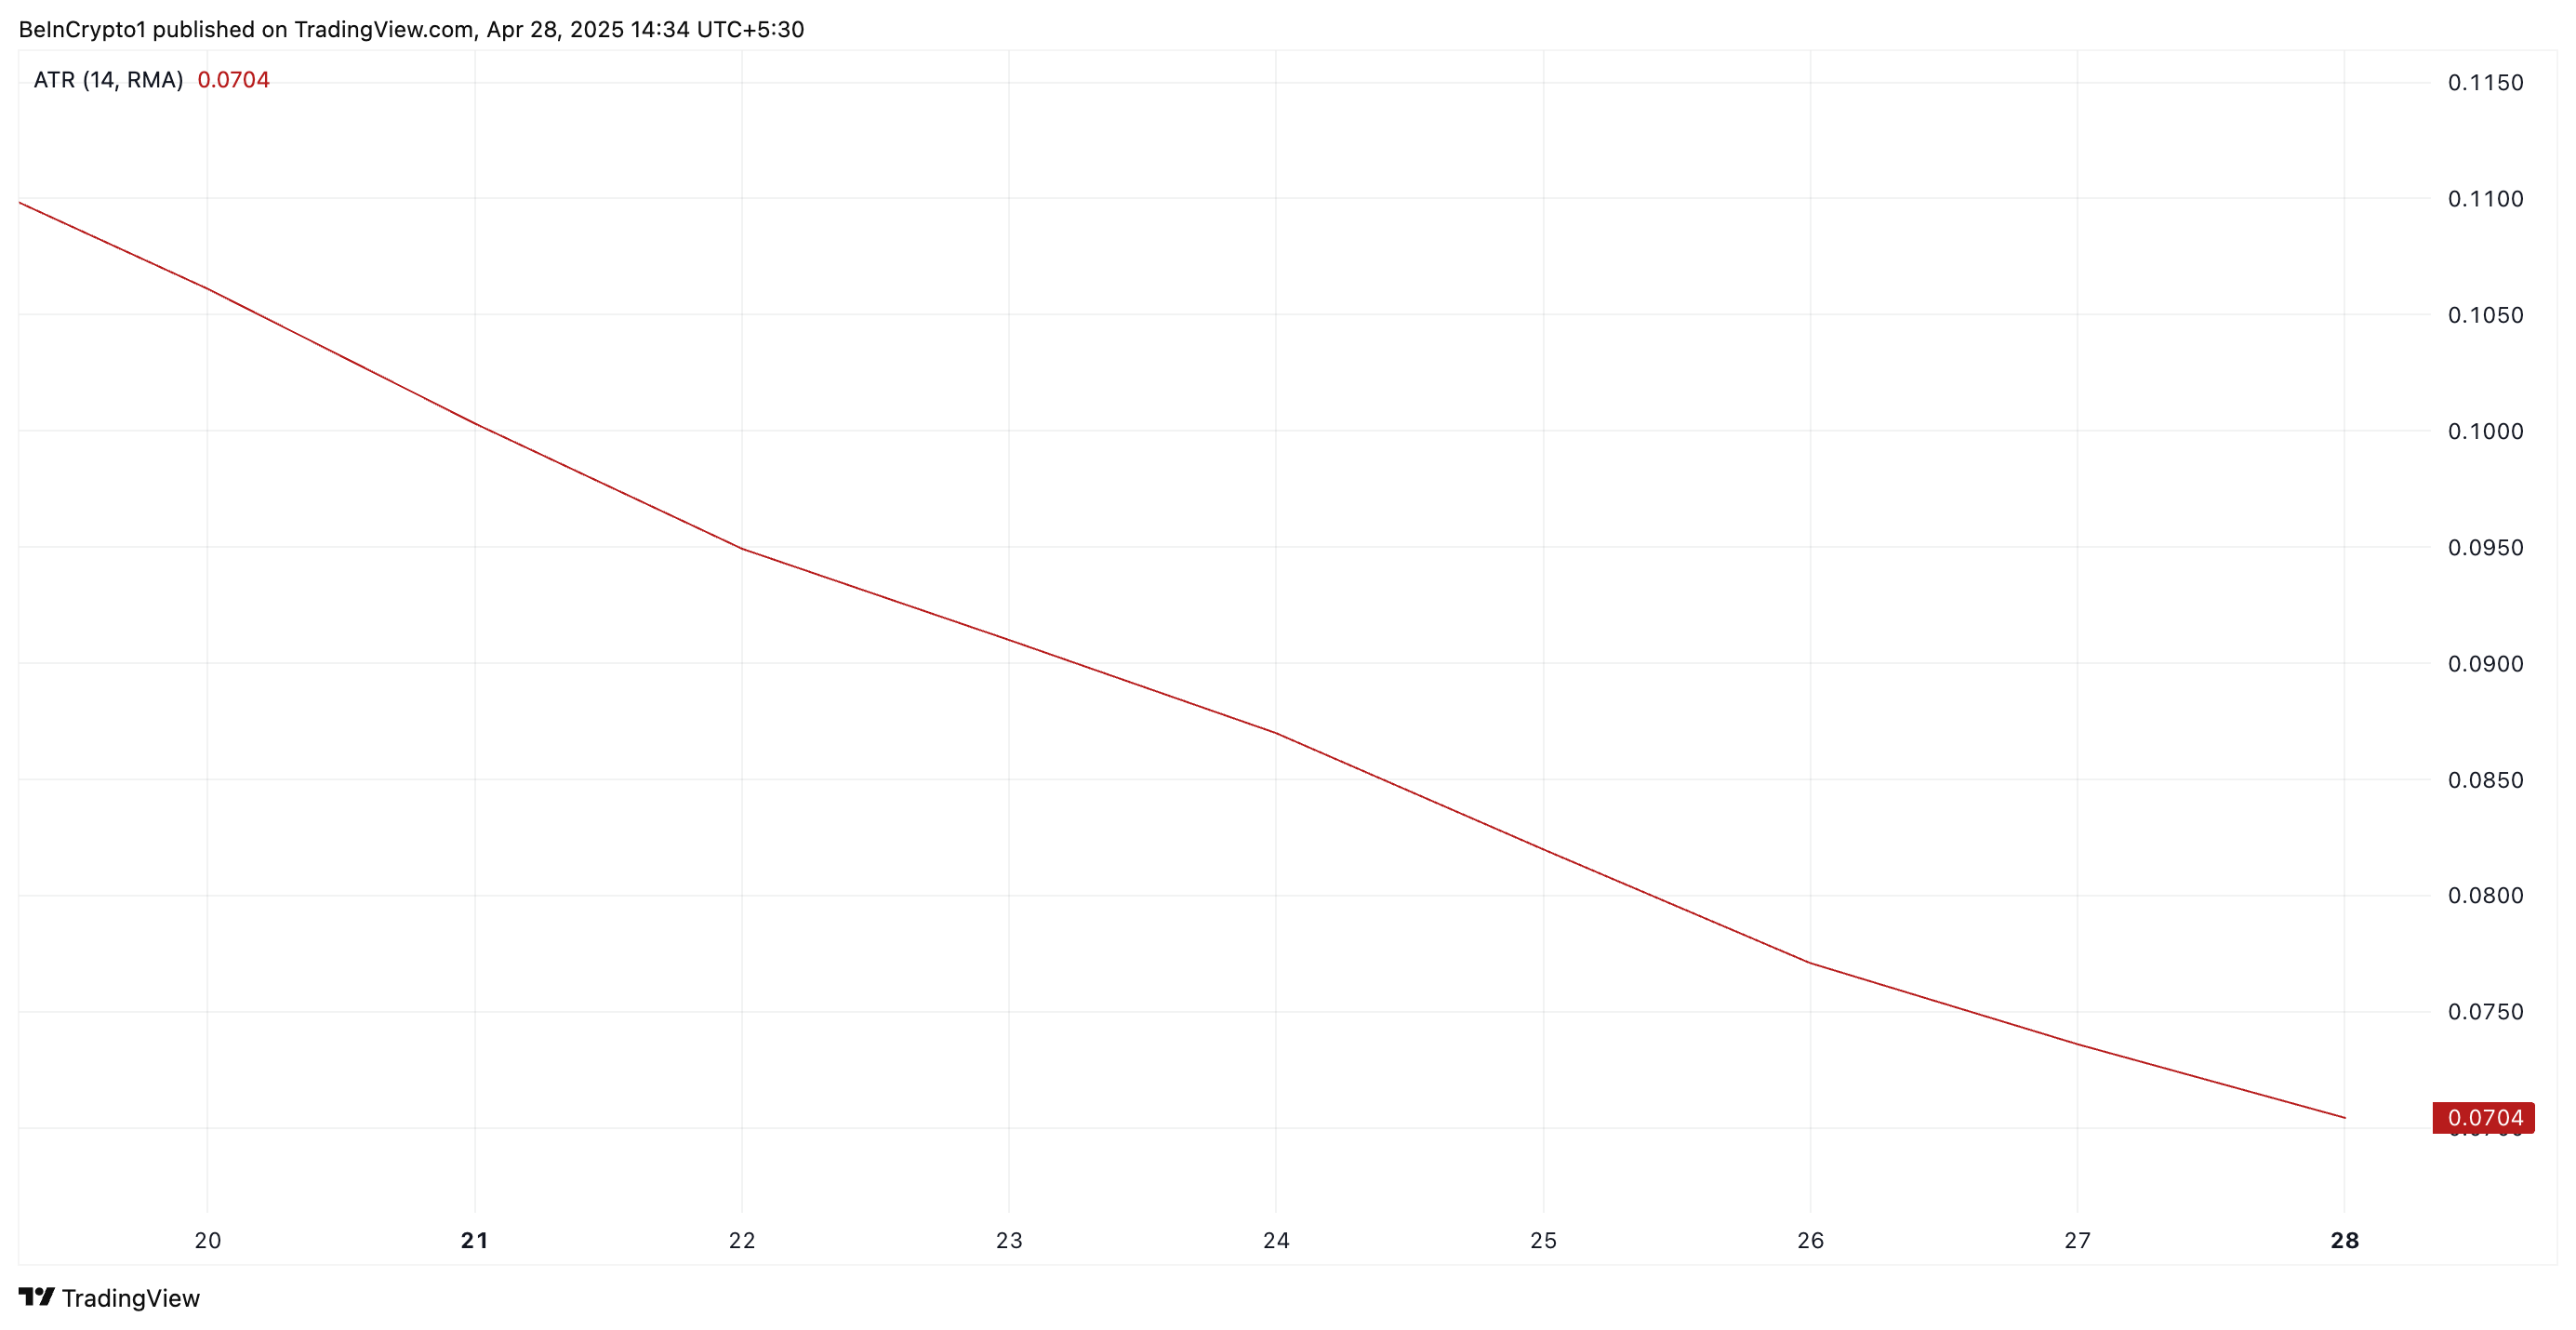
The ATR indicator measures market volatility by calculating the average range between the high and low prices over a set period. When it falls like this, it indicates a decrease in market volatility, suggesting that price movements are becoming less erratic.
This often signals a period of consolidation or indecision in the market, as traders await a potential breakout or shift in direction. For PI, this is evident as both buyers and sellers hesitate, waiting for a catalyst to drive their next moves.
Will Bullish Momentum Drive PI to $1 or Will Bears Retake Control?
A breakout—whether to the upside or downside—could signal the start of a new trend, making PI a token to watch in the coming days. If bullish pressure soars and demand for the altcoin spikes, its price could witness a rally and attempt to break above the resistance at $0.66.
A successful breach of this level could propel PI’s price to $1.
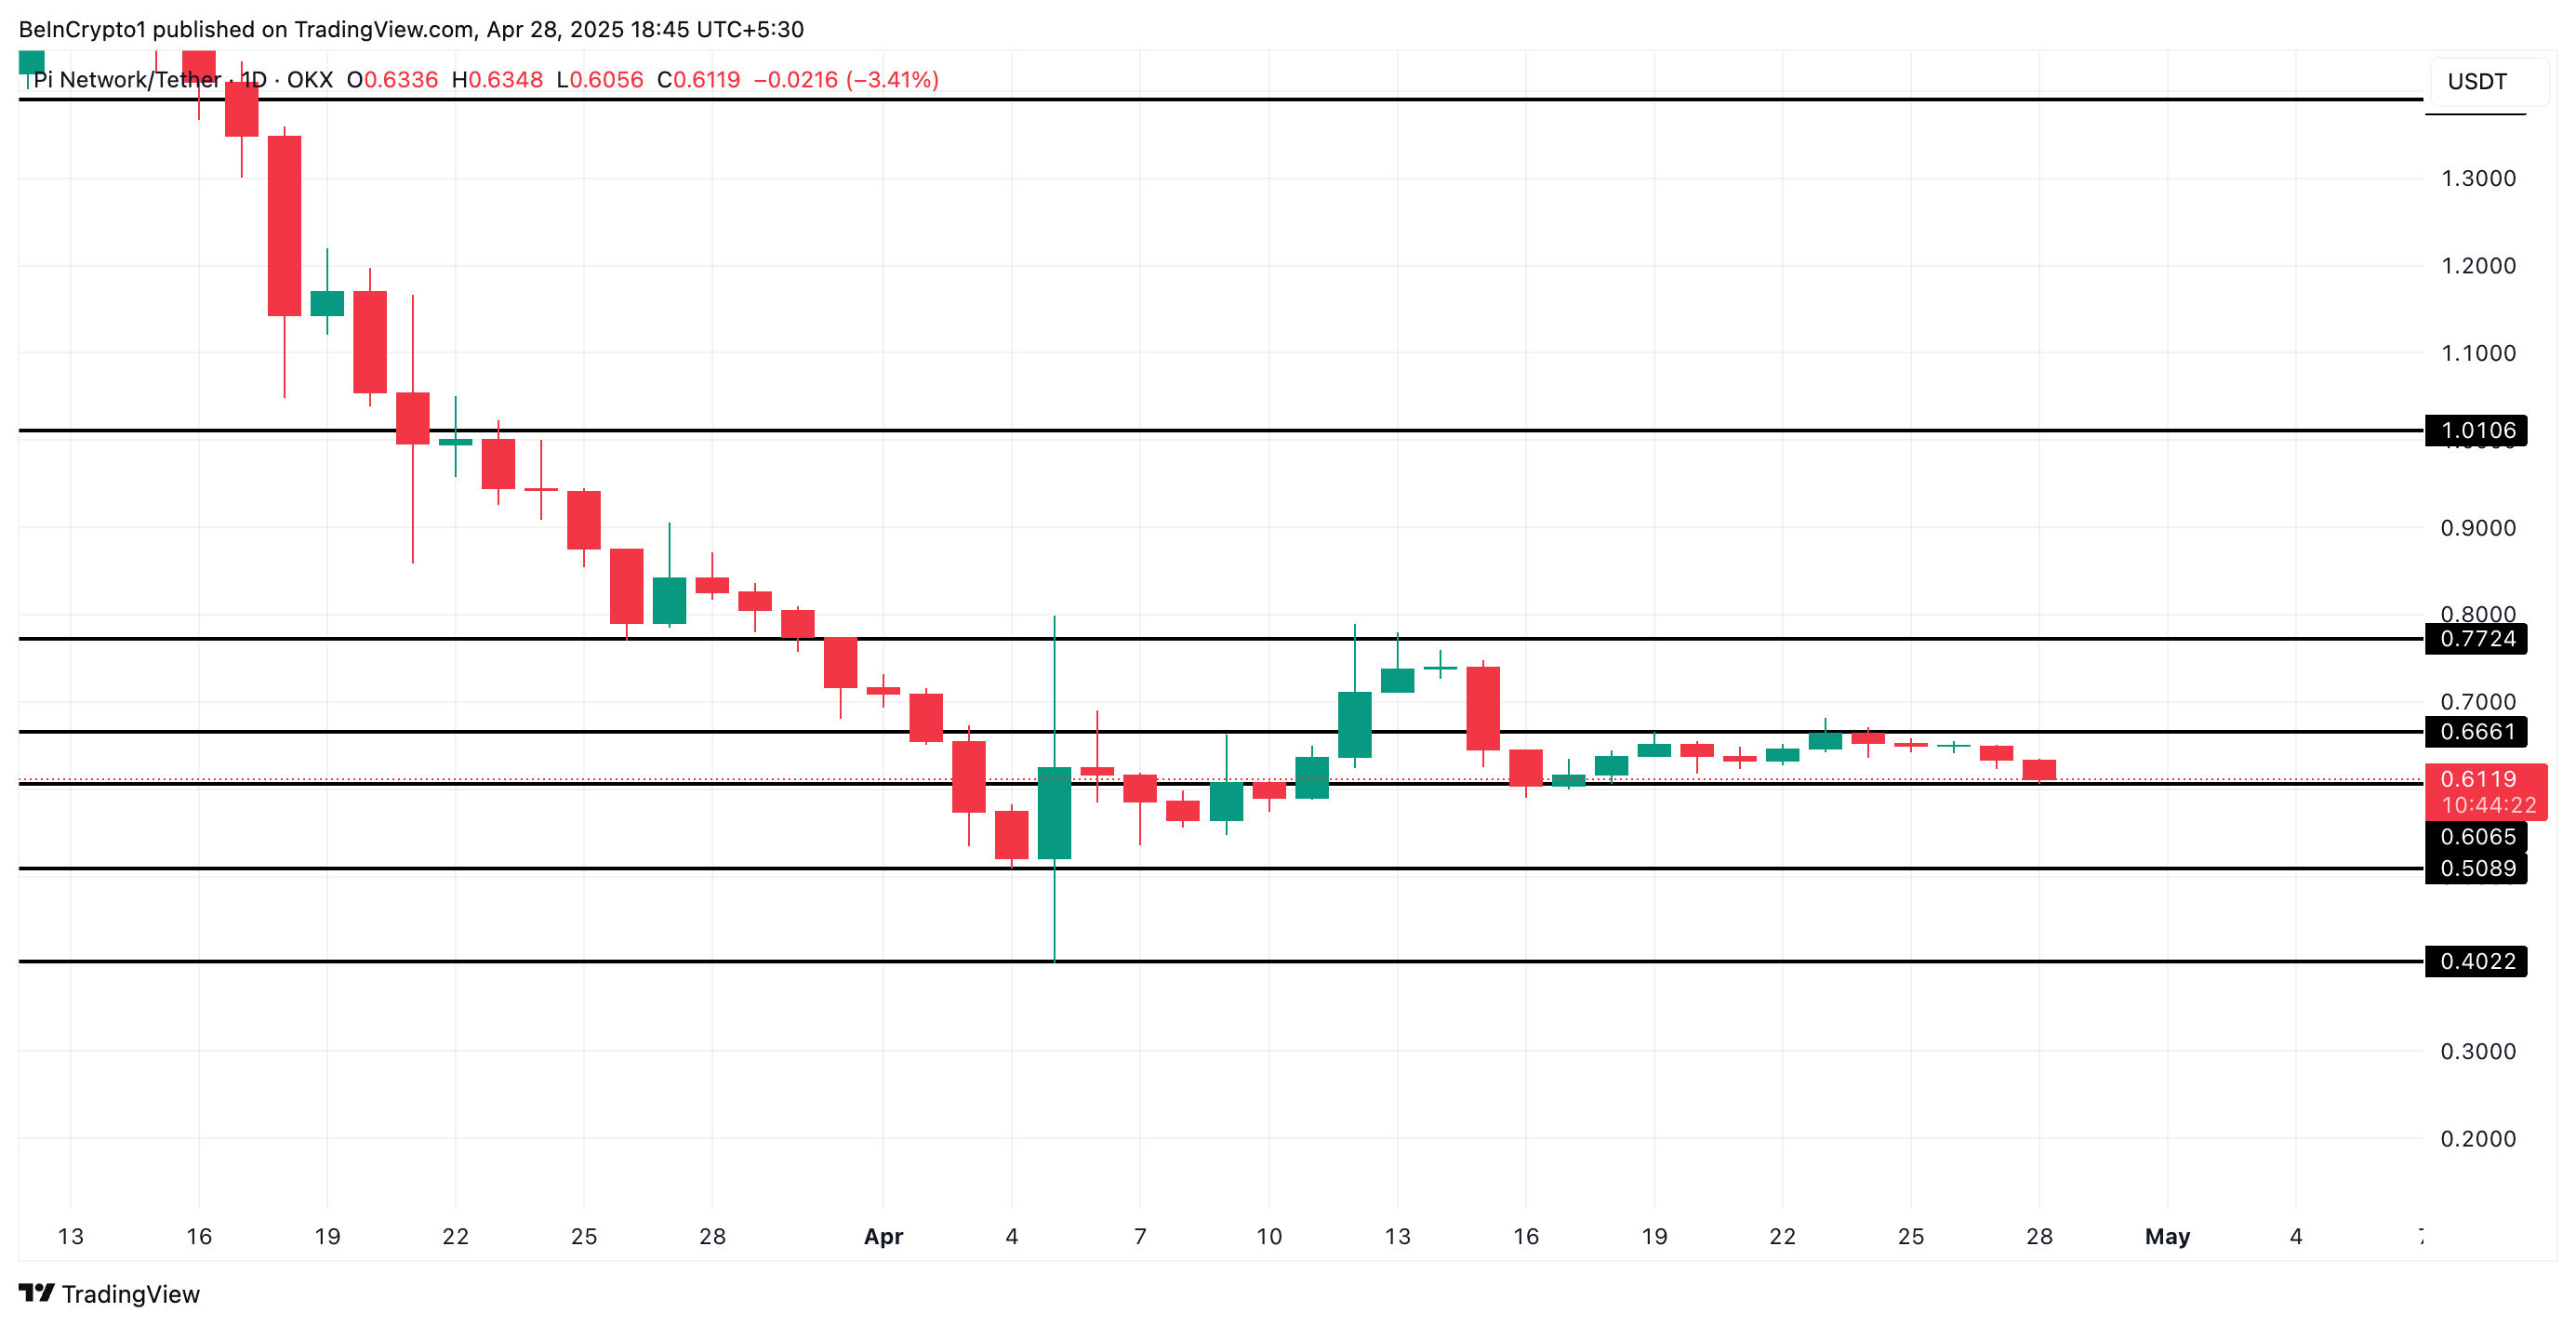
Conversely, if the bears regain full control and selloffs resume, PI could break below the support at $0.60 and fall to $0.50.
