Pi Network (PI) Nears Critical Breakout as Bullish Sentiment Builds

Pi Network’s native token PI shows tightening volatility as traders position for a potential surge. With key resistance levels in sight, the mobile-mined cryptocurrency could be gearing up for its first major price discovery phase since mainnet launch.
Market indicators flash green: RSI climbs from oversold territory while trading volume spikes 47% week-over-week. "The setup mirrors early-stage Bitcoin accumulation," notes one analyst—before adding, "assuming this isn’t just another vaporware coin promising decentralization while the founders hoard 20% of the supply."
All eyes now turn to PI’s ability to hold support above $32.50. A clean breakout here could trigger algorithmic traders to flood in, though skeptics warn the token still lacks major exchange listings. One thing’s certain: in a market where even meme coins moon, Pi Network’s "everyday mining" narrative is finally getting a serious second look.
Ichimoku Signals Uncertainty for PI
Pi Network trades inside the red Ichimoku Cloud, reflecting indecision and a lack of strong directional bias.
The price sits between the red baseline (Kijun-sen) and just above the blue conversion line (Tenkan-sen), indicating weak short-term momentum but no clear breakdown.
The presence of the red cloud shows that the prevailing trend is still slightly bearish, and price action within the cloud generally signals consolidation or neutrality.
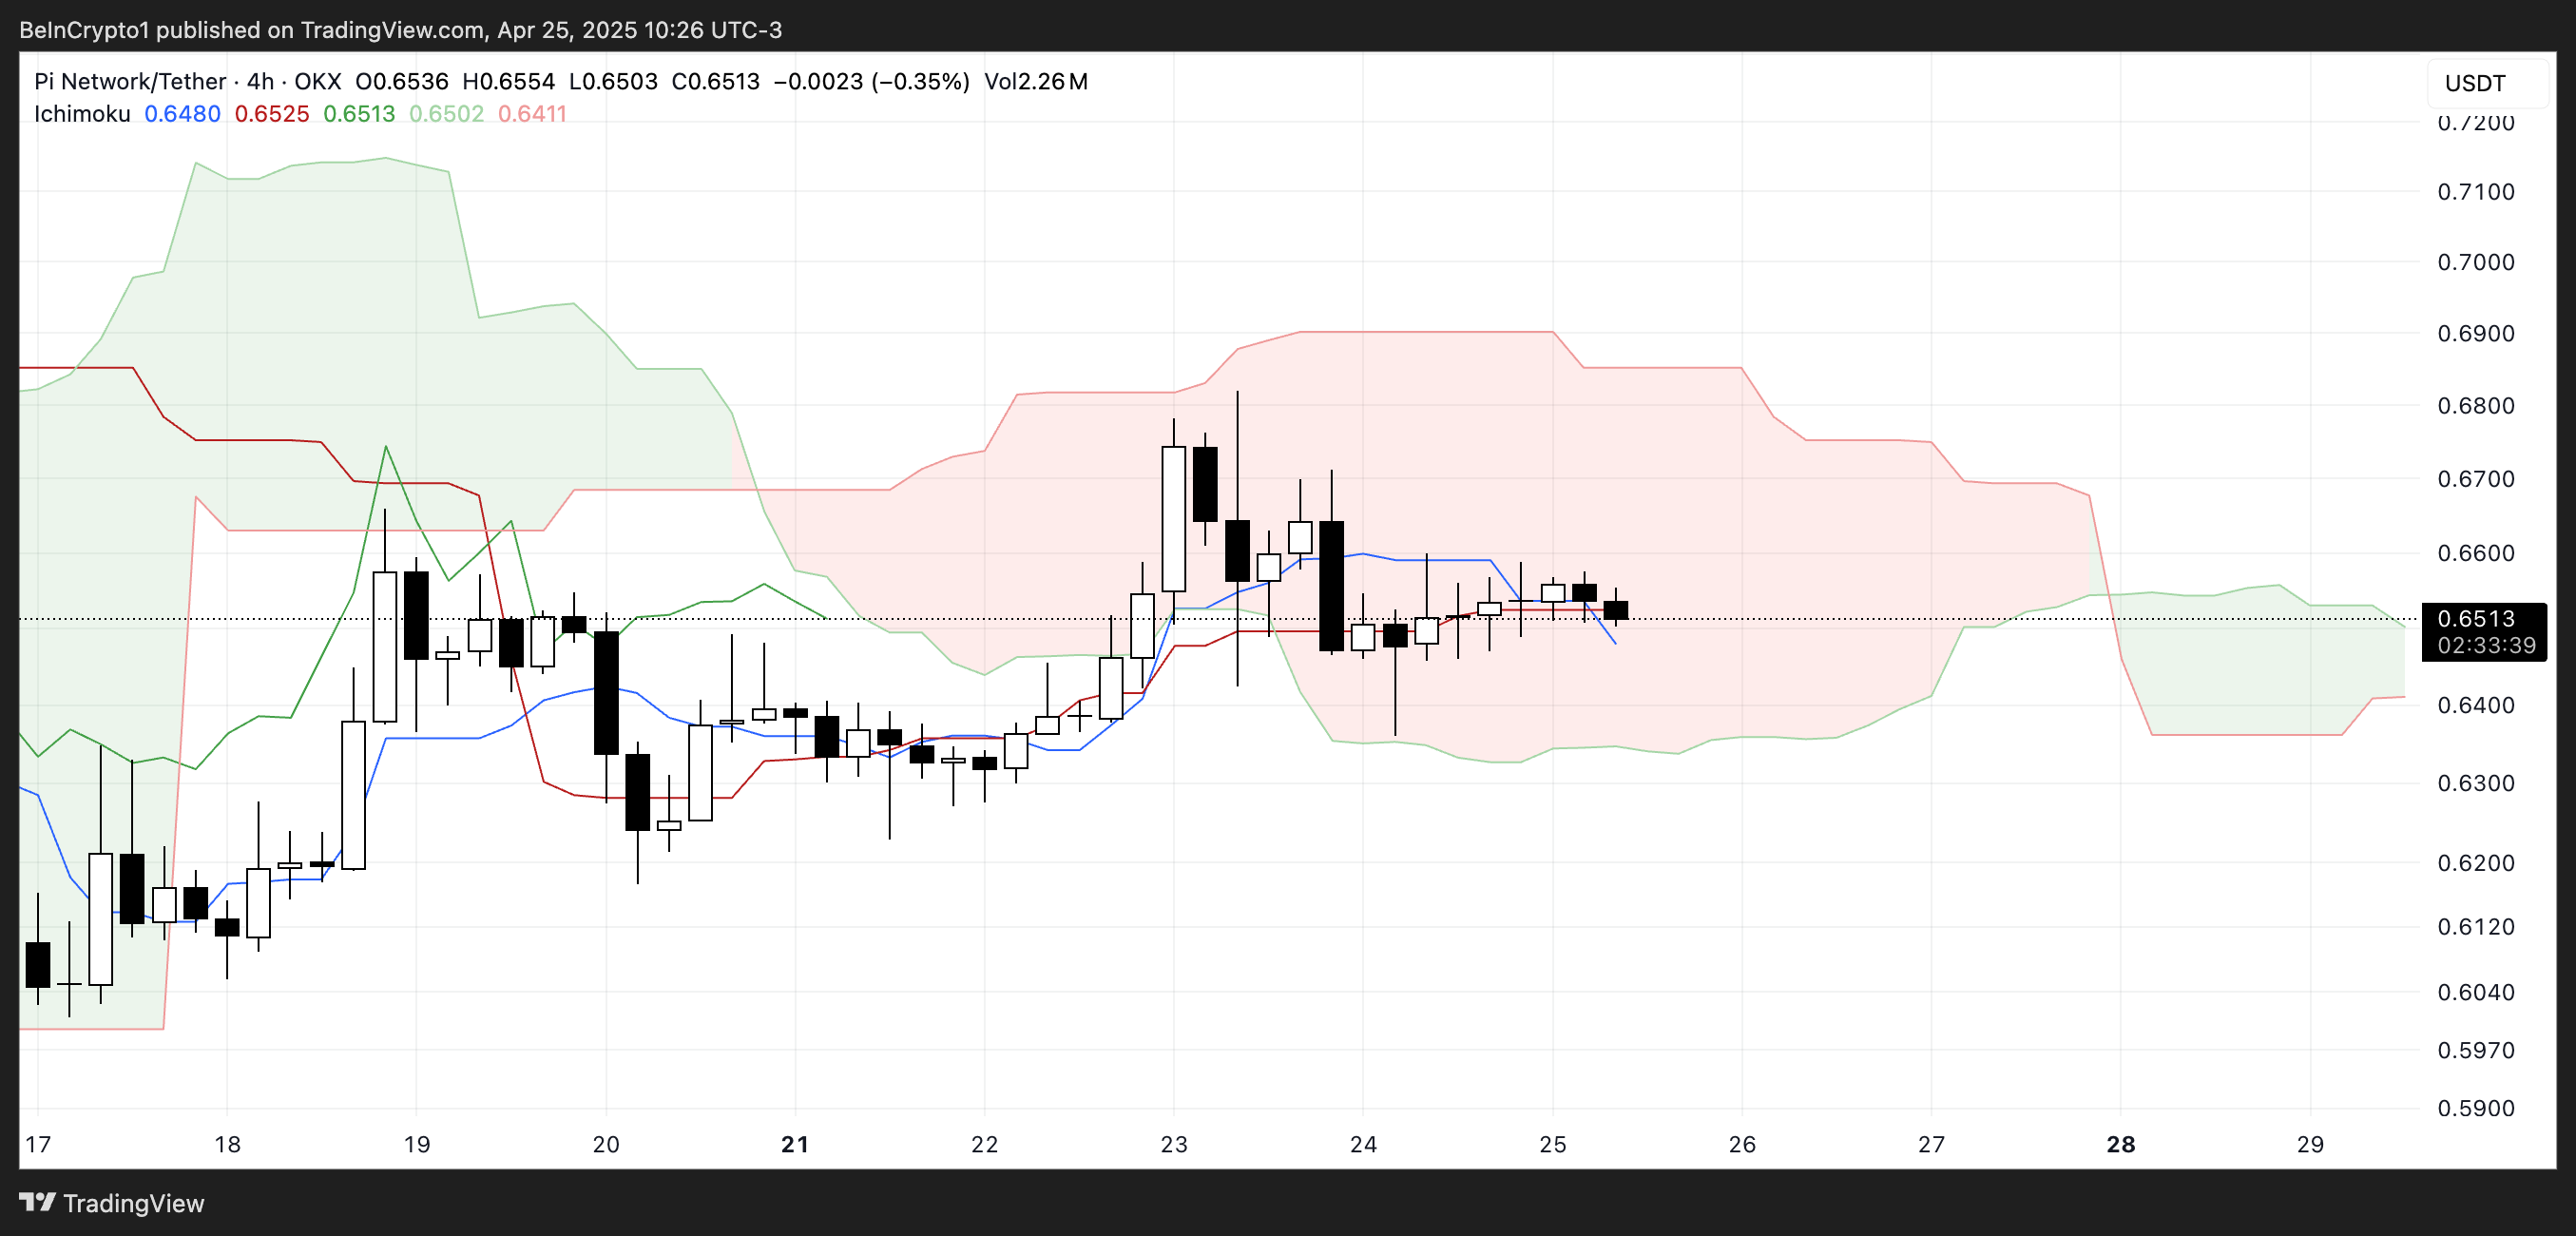
However, looking ahead, the cloud shifts to green, suggesting that sentiment may be starting to shift.
A green cloud in the future points to a potential bullish transition, but only if the price manages to break above the cloud with strong follow-through.
A decisive move above the cloud would support a trend reversal, while a rejection and move below the Tenkan-sen and Kijun-sen would reinforce bearish pressure.
PI RSI Cools Off: What Comes Next?
Pi Network’s Relative Strength Index (RSI) is currently sitting at 51.41, falling from a high of 70 just two days ago.
This drop reflects a noticeable momentum cooling, as the asset moved from near-overbought territory to more neutral levels.
The RSI measures the speed and magnitude of recent price changes to evaluate overbought or oversold conditions. Values above 70 are generally considered overbought, and those below 30 are considered oversold.

An RSI at 51.41 places PI right in the middle of the range, suggesting that neither buyers nor sellers currently have a clear advantage.
This neutral reading often coincides with a consolidation phase, where the price stabilizes before deciding its next direction. If the RSI trends again, it could point to renewed bullish momentum.
On the other hand, continued decline toward 40 or below may signal growing weakness and open the door for a deeper pullback.
PI Consolidates—Is a Breakout Coming?
Pi Network price has been consolidating over the past few days, currently trading within a range defined by resistance at $0.68 and support at $0.61.
This sideways movement is reflected in the EMA lines, which are clustered closely together—a classic sign of low volatility and a lack of strong directional momentum.
The market appears to be waiting for a decisive push from either buyers or sellers before committing to a new trend. Until then, PI remains in a holding pattern, with price action trapped between key levels.
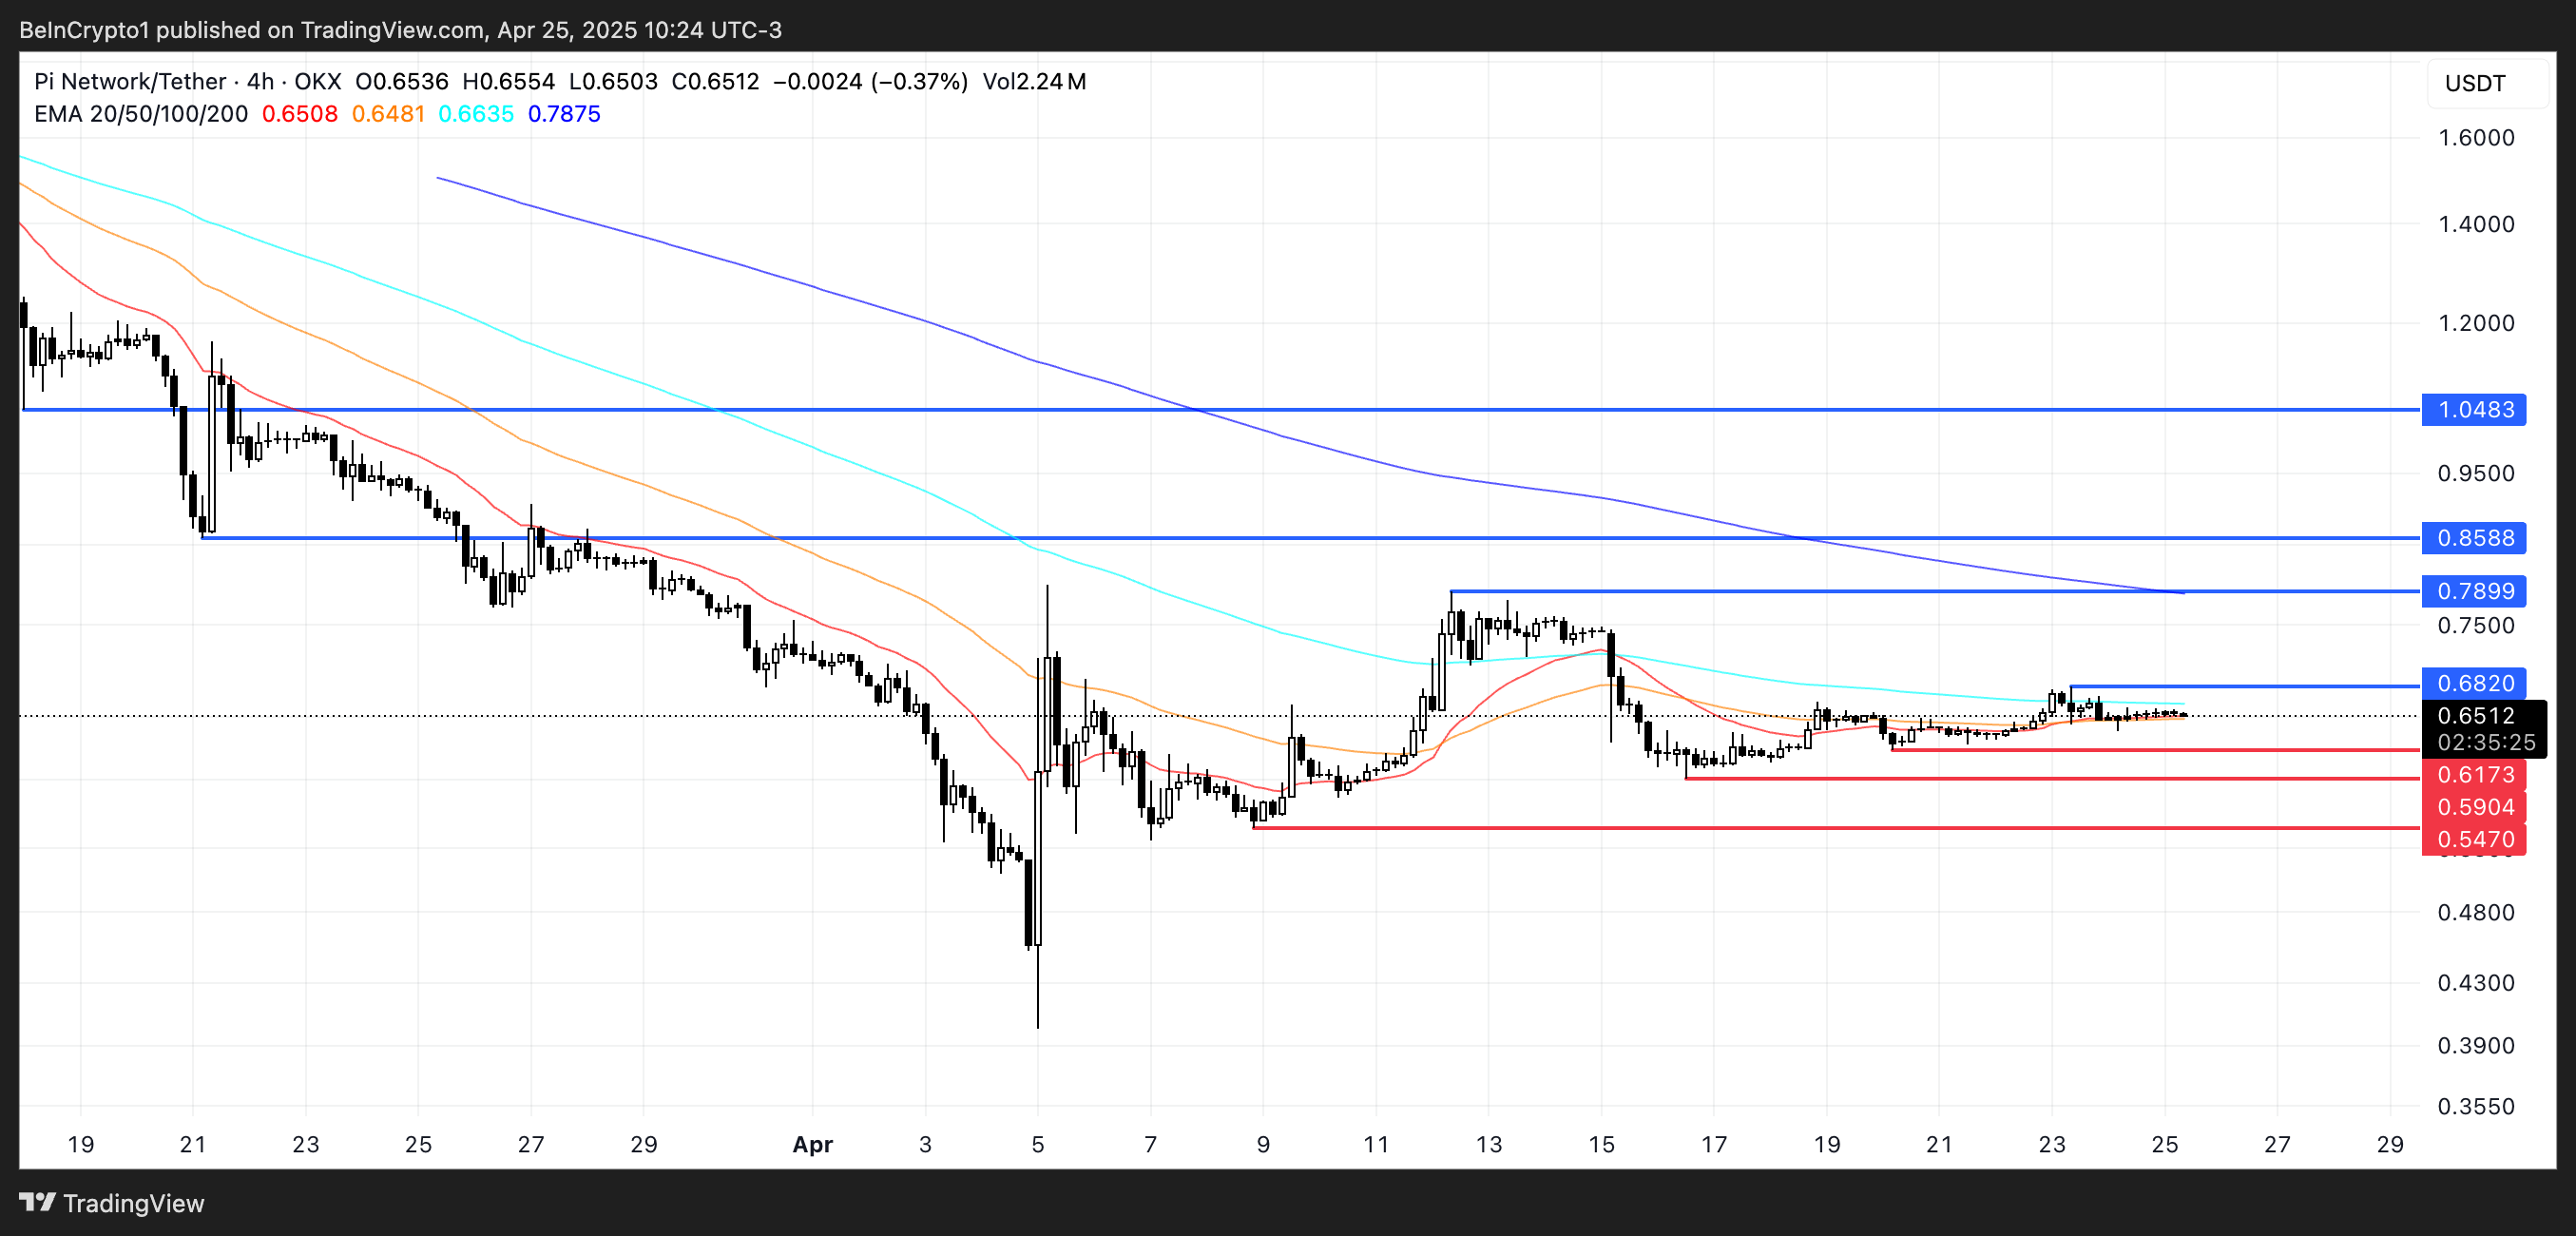
If bullish momentum returns, a breakout above $0.68 could signal the start of a fresh rally.
In that case, the next resistance levels to watch are $0.789 and $0.85. If the uptrend strengthens further, PI could target $1.04—marking its first move above $1 since March 23.
However, a breakdown below the $0.617 support could lead to renewed bearish pressure, with $0.59 and $0.54 as the next potential downside targets.

Log in to Reply
Log in to comment your thoughtsComments
Related Articles
|Square
Get the BTCC app to start your crypto journey
Get started today Scan to join our 100M+ users