XRP Charges Past $130B Market Cap as Bulls Take Control

The crypto’s relentless rally defies the usual ’buy the rumor, sell the news’ circus—this time, traders actually held their positions. Liquidity floods in as XRP carves its highest valuation since the 2021 frenzy, proving once again that market irrationality outlasts any regulatory memo. Now watch the so-called ’smart money’ scramble to justify why they sold at $0.50.
XRP Enters Overbought Zone for First Time Since March
XRP’s Relative Strength Index (RSI) has surged to 76.19, climbing above the 70 threshold for the first time since March 19 — over a month ago.
Just yesterday, its RSI was at 51.4, signaling a sharp increase in buying momentum within a short period.
This jump suggests that XRP is entering an overbought zone, a level where price action often begins to slow or reverse, depending on broader market sentiment.
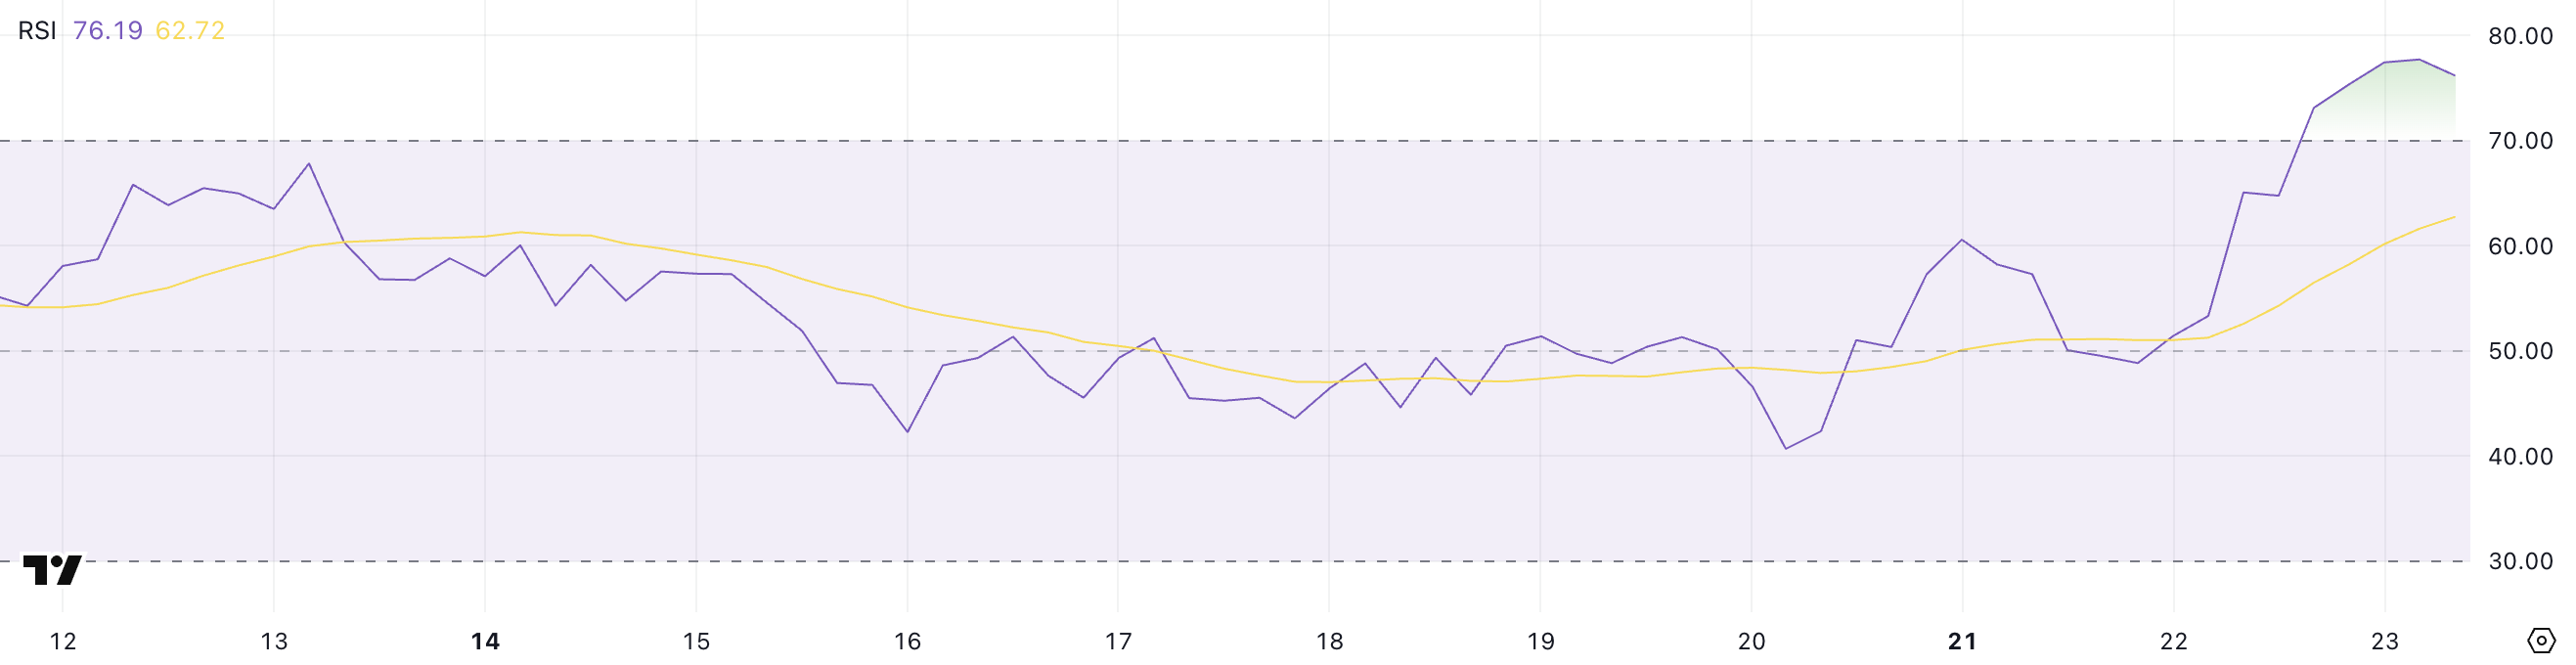
RSI is a momentum indicator that ranges from 0 to 100 and helps traders assess whether an asset is overbought or oversold. A reading above 70 typically signals overbought conditions, suggesting that the asset may be due for a pullback.
A reading below 30, on the other hand, signals oversold conditions and potential for a bounce. With XRP now at 76.19, traders may begin to watch for signs of weakening momentum or consolidation. Despite that, some analysts claim XRP market cap could soon surpass Ethereum’s.
However, strong upward RSI moves can also signal the start of a breakout if supported by volume and broader bullish sentiment.
Ichimoku Signals Align for XRP as Cloud Turns Bullish
XRP’s Ichimoku Cloud remains in a bullish configuration, with the price clearly positioned above the Kumo (cloud), formed by the Senkou Span A (green line) and Senkou Span B (red line).
This indicates a continuation of upward momentum, though the green cloud ahead is narrower than before, suggesting that bullish conviction may not be as strong as in earlier phases of the trend.
Still, being above the cloud generally favors buyers in the short term.
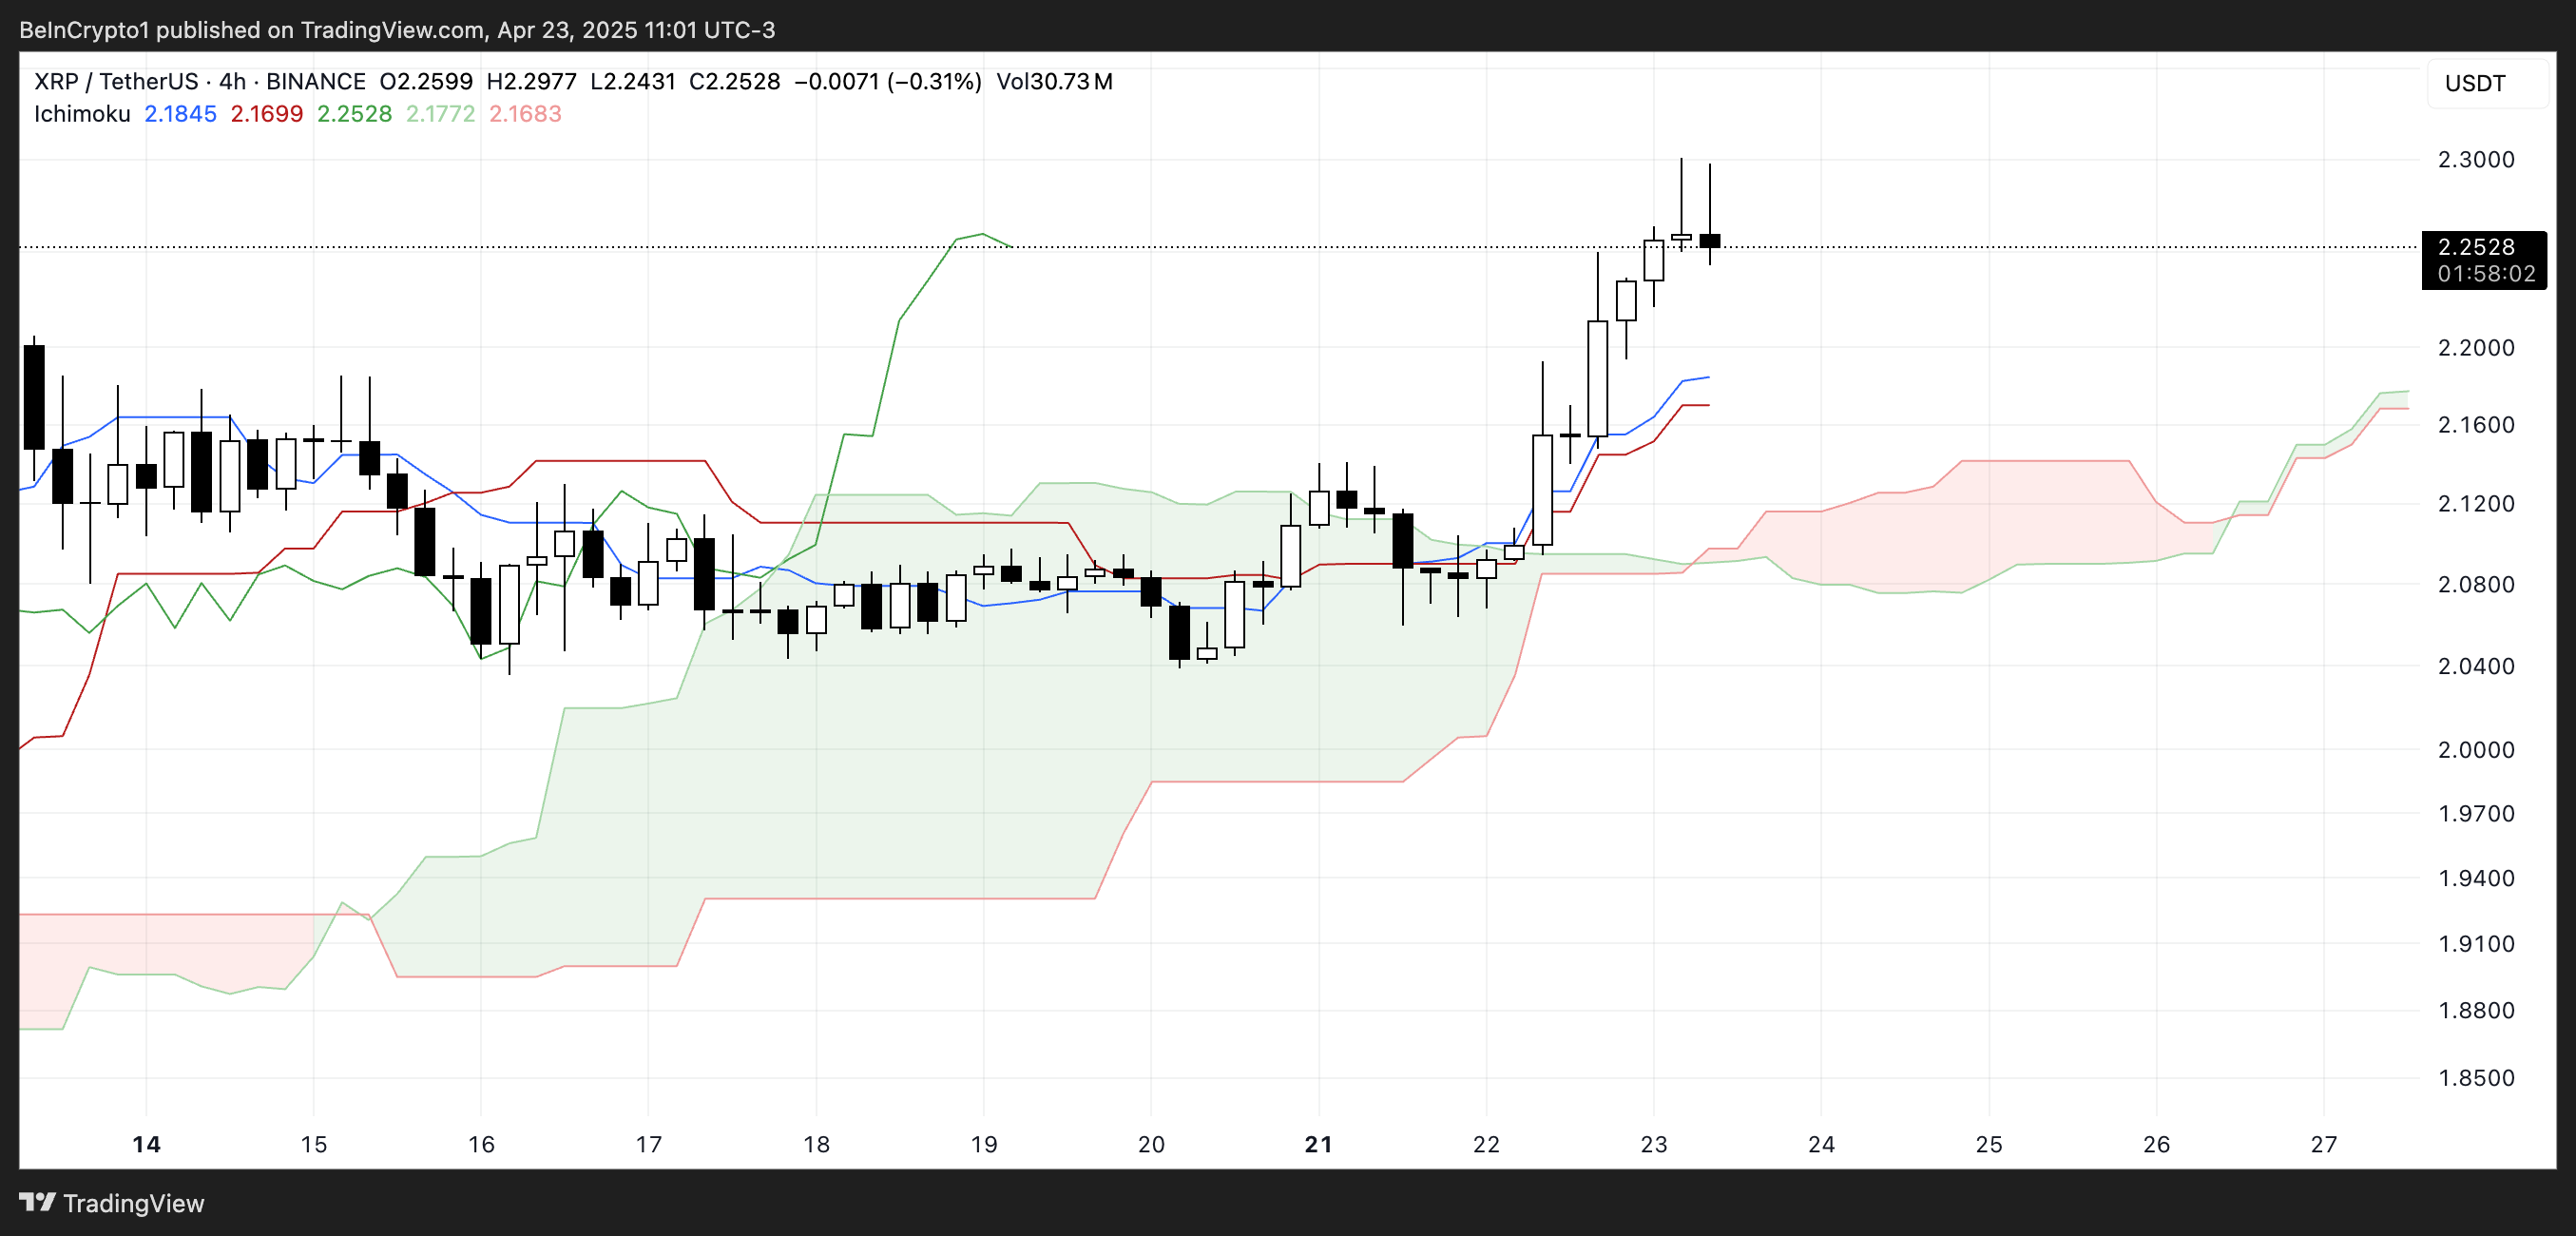
The Tenkan-sen (blue line) is above the Kijun-sen (red line), signaling short-term bullish momentum through a positive crossover.
Meanwhile, the Chikou Span (green lagging line) is well above the cloud, confirming that current momentum is supported by past price strength.
However, the thinner cloud ahead calls for some caution — while the trend remains bullish, a weaker cloud can suggest reduced support if the price turns.
For now, XRP has a positive technical structure, but traders will monitor for any signs of weakness.
XRP Builds Momentum on Golden Crosses—Reversal or Rally?
XRP’s exponential moving average (EMA) lines have formed consecutive golden crosses since yesterday, a strong bullish signal that indicates growing upward momentum.
This pattern suggests that short-term averages are crossing above longer-term ones, often seen as a sign of a trend reversal or the beginning of a new uptrend.
If this momentum continues, XRP price could climb to test $2.50, with further resistance levels at $2.64, $2.74, and $2.83.
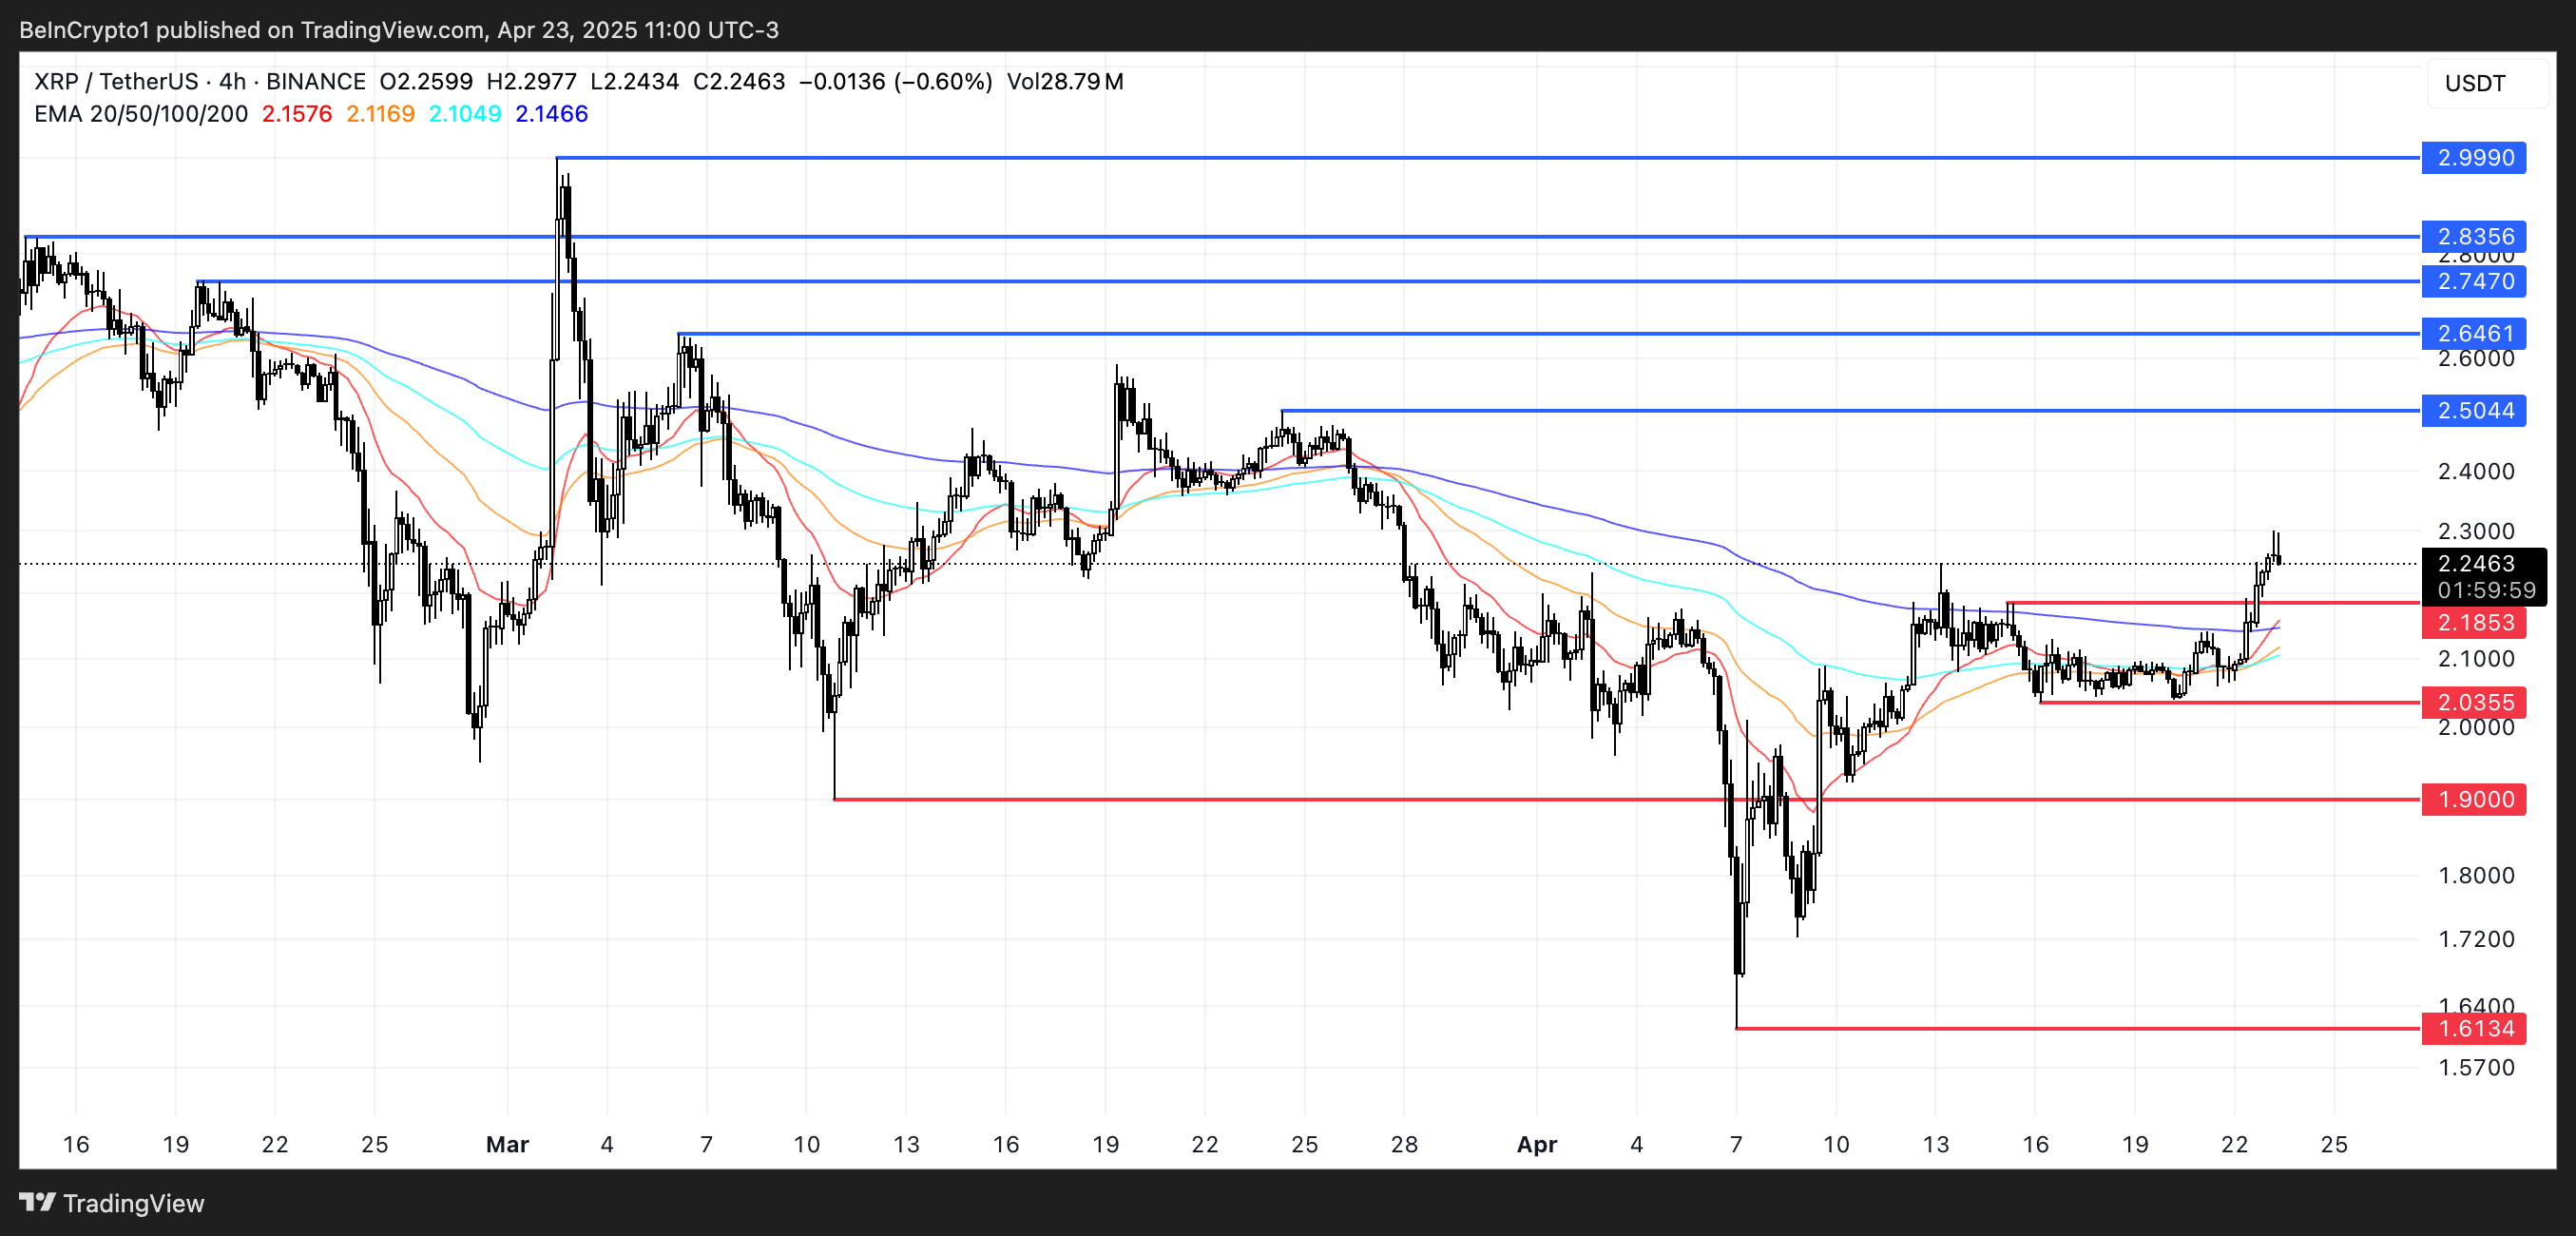
Should the broader bullish sentiment return, XRP may even attempt to reclaim the $2.99 level — and possibly break above $3 for the first time in months.
However, if the momentum fades and the trend reverses, XRP could pull back to test support at $2.18. A loss of that level would open the door for a deeper correction toward $2.03.
Continued downside pressure could push XRP below the $2 mark, with the next major support levels at $1.90 and $1.61.
