Cardano (ADA) Technical Analysis Suggests Impending Golden Cross Formation
As of April 2025, Cardano’s ADA is exhibiting bullish technical indicators with its 50-day moving average approaching a crossover above the 200-day moving average—a classic golden cross pattern that often precedes significant upward momentum. Market analysts are closely monitoring this development, as such formations historically signal long-term bullish trends in cryptocurrency markets. The potential golden cross comes amid growing network activity and positive sentiment surrounding Cardano’s ongoing ecosystem developments, including smart contract upgrades and DeFi protocol integrations.
Cardano Shows Early Signs of Recovery as BBTrend Turns Positive
Cardano BBTrend has just flipped back into positive territory at 0.11, following four straight days in the negative zone. This shift, though subtle, may be the first sign of momentum stabilizing after recent weakness.
BBTrend, or Bollinger Band Trend, is a technical indicator that gauges the strength and direction of a trend based on how wide or narrow the Bollinger Bands are.
When the bands begin to expand and BBTrend moves into positive values, it often suggests growing volatility in favor of an emerging bullish trend. On the other hand, prolonged negative readings typically signal fading momentum and a lack of directional strength.

While a BBTrend of 0.11 is still low and not yet signaling a strong uptrend, the fact that it turned positive marks a potential inflection point.
It suggests that selling pressure may be fading and the price could be entering a recovery phase if buying activity increases. This early uptick in BBTrend often precedes a broader move.
Traders will likely be watching closely to see if this positive shift is sustained in the coming sessions, as continued gains in BBTrend could indicate the beginning of a more defined upward move for ADA.
Cardano Buyers Regain Control as Uptrend Shows Early Strength
Cardano Directional Movement Index (DMI) is showing a notable shift in momentum, with its Average Directional Index (ADX) climbing to 17.79, up from 13.77 yesterday.
The ADX measures the strength of a trend, regardless of its direction, on a scale from 0 to 100. Values below 20 suggest a weak or non-existent trend, while readings above 25 typically confirm that a trend is gaining strength.
ADA’s ADX is still below the 20 threshold but rising steadily—indicating that momentum is building and a stronger directional move could soon take shape.

Looking deeper, the +DI (positive directional indicator) has jumped to 26.38 from 16.30 just a day ago, signaling increased buying pressure. Although it has slightly pulled back from an earlier peak at 29.57, it remains firmly above the -DI (negative directional indicator), which has dropped significantly from 22.72 to 13.73.
This widening gap between the +DI and -DI suggests a clear shift in favor of bulls, with buyers regaining control after a brief period of selling pressure.
If the ADX continues to rise alongside a dominant +DI, it could confirm a strengthening uptrend for Cardano.
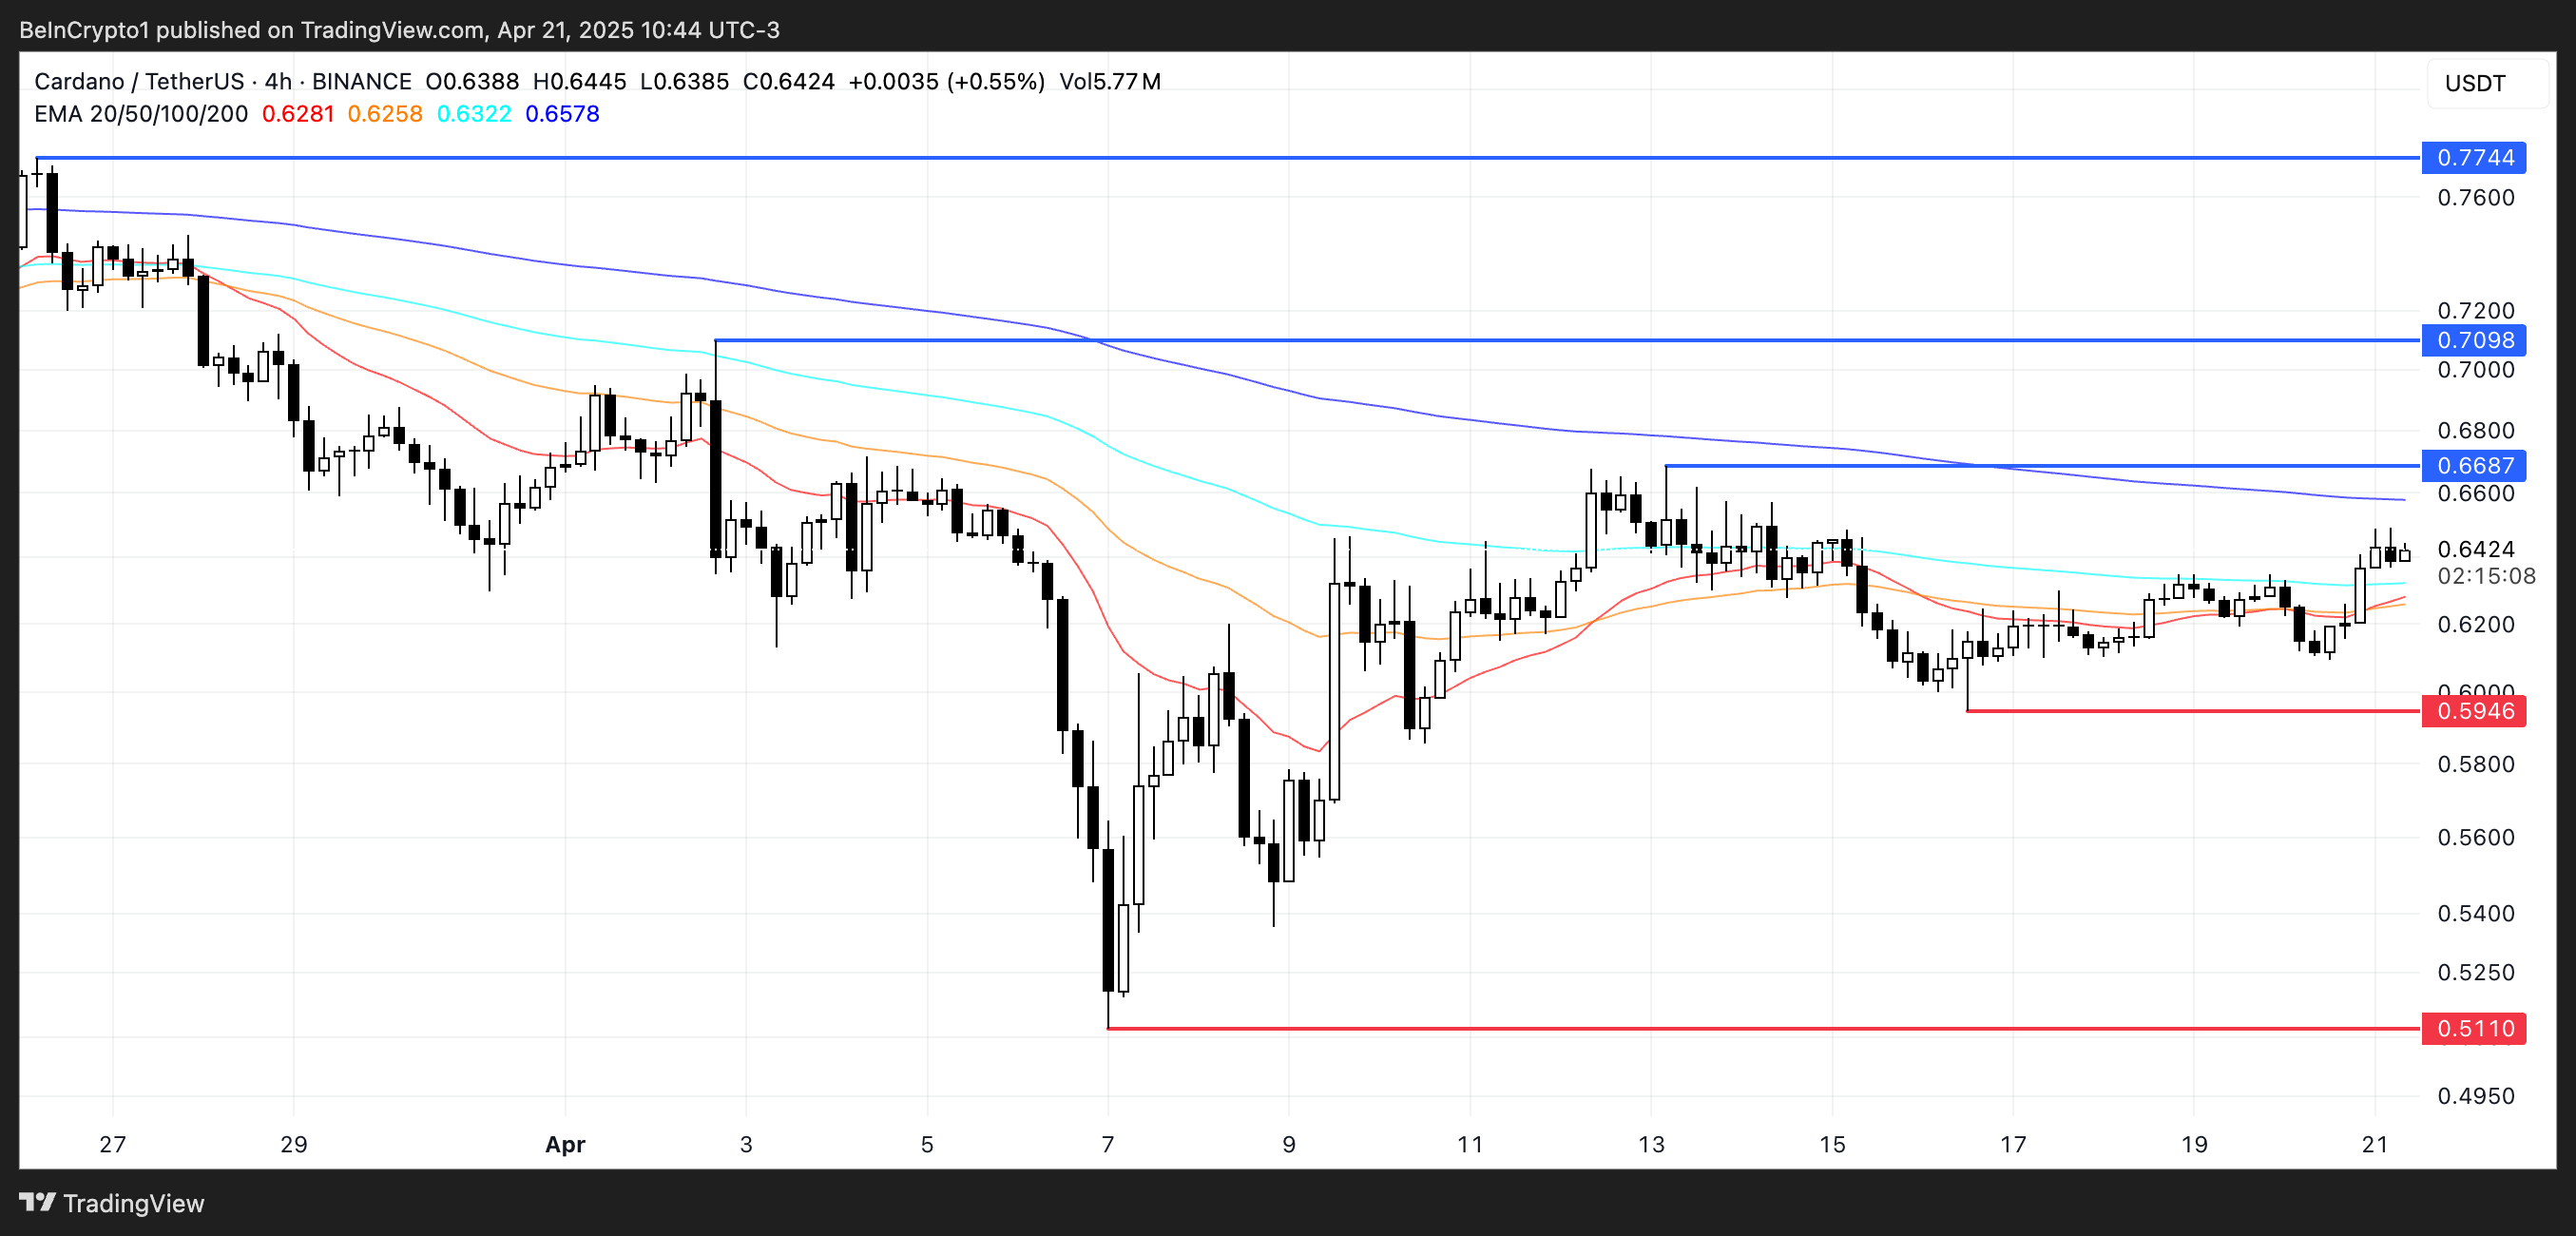
Cardano Nears Golden Cross as Bulls Eye Breakout—but Key Support Still in Play
Cardano price is approaching a potentially bullish technical development, as its EMA lines suggest a golden cross may form in the coming sessions.
A golden cross occurs when the short-term moving average crosses above the long-term moving average, often signaling the start of a stronger uptrend.
If this crossover is confirmed and ADA manages to break above the resistance at $0.668, the next upside targets sit at $0.709 and $0.77—levels not seen since late March.

However, if ADA fails to maintain its upward trajectory and the momentum fades, downside risks remain in play.
A drop back toward the $0.594 support would be the first sign of weakness, and a breakdown below that level could expose the asset to deeper losses, with $0.511 as the next key support zone.
Price action around the $0.668 resistance will likely be the deciding factor.

