XRP Bulls Seize Control: Surging Long Positions Signal Potential Breakout Beyond $2.18 Resistance

As of April 21, 2025, XRP is exhibiting strong bullish momentum with a notable increase in long positions across major exchanges. Market analysts are observing growing confidence among traders, suggesting an impending breakout above the critical $2.18 resistance level. The rising accumulation pattern mirrors previous pre-rally behavior, indicating potential for significant upward movement. Technical indicators show strengthening buying pressure, while derivatives data reveals a marked preference for long bets over short positions. This shift in market sentiment could pave the way for XRP to test new yearly highs if the current demand sustains.
XRP Futures Traders Bet on Upside as Long Positions
The momentum shift towards the bulls has become evident, particularly within the futures market, where long bets on XRP are now surpassing short positions. This is reflected by the token’s XRP’s long/short ratio, which is currently at 1.07.

The long/short ratio measures the proportion of long positions (bets on price increases) to short positions (bets on price declines) in the market.
When its value is below one, it indicates that the number of short positions outweighs long positions in the market, suggesting bearish sentiment or a lack of confidence in the token’s future price performance.
As with XRP, when an asset’s long/short ratio is above one, it means there are more long positions than short ones. It indicates that traders are predominantly bullish on XRP and hints at a higher likelihood of an upward breach of its narrow range.
In addition, XRP’s relative strength index (RSI) has climbed steadily, indicating a gradual rise in demand for the token. The key momentum indicator, at 50.77, currently rests above the neutral line and is in an uptrend.
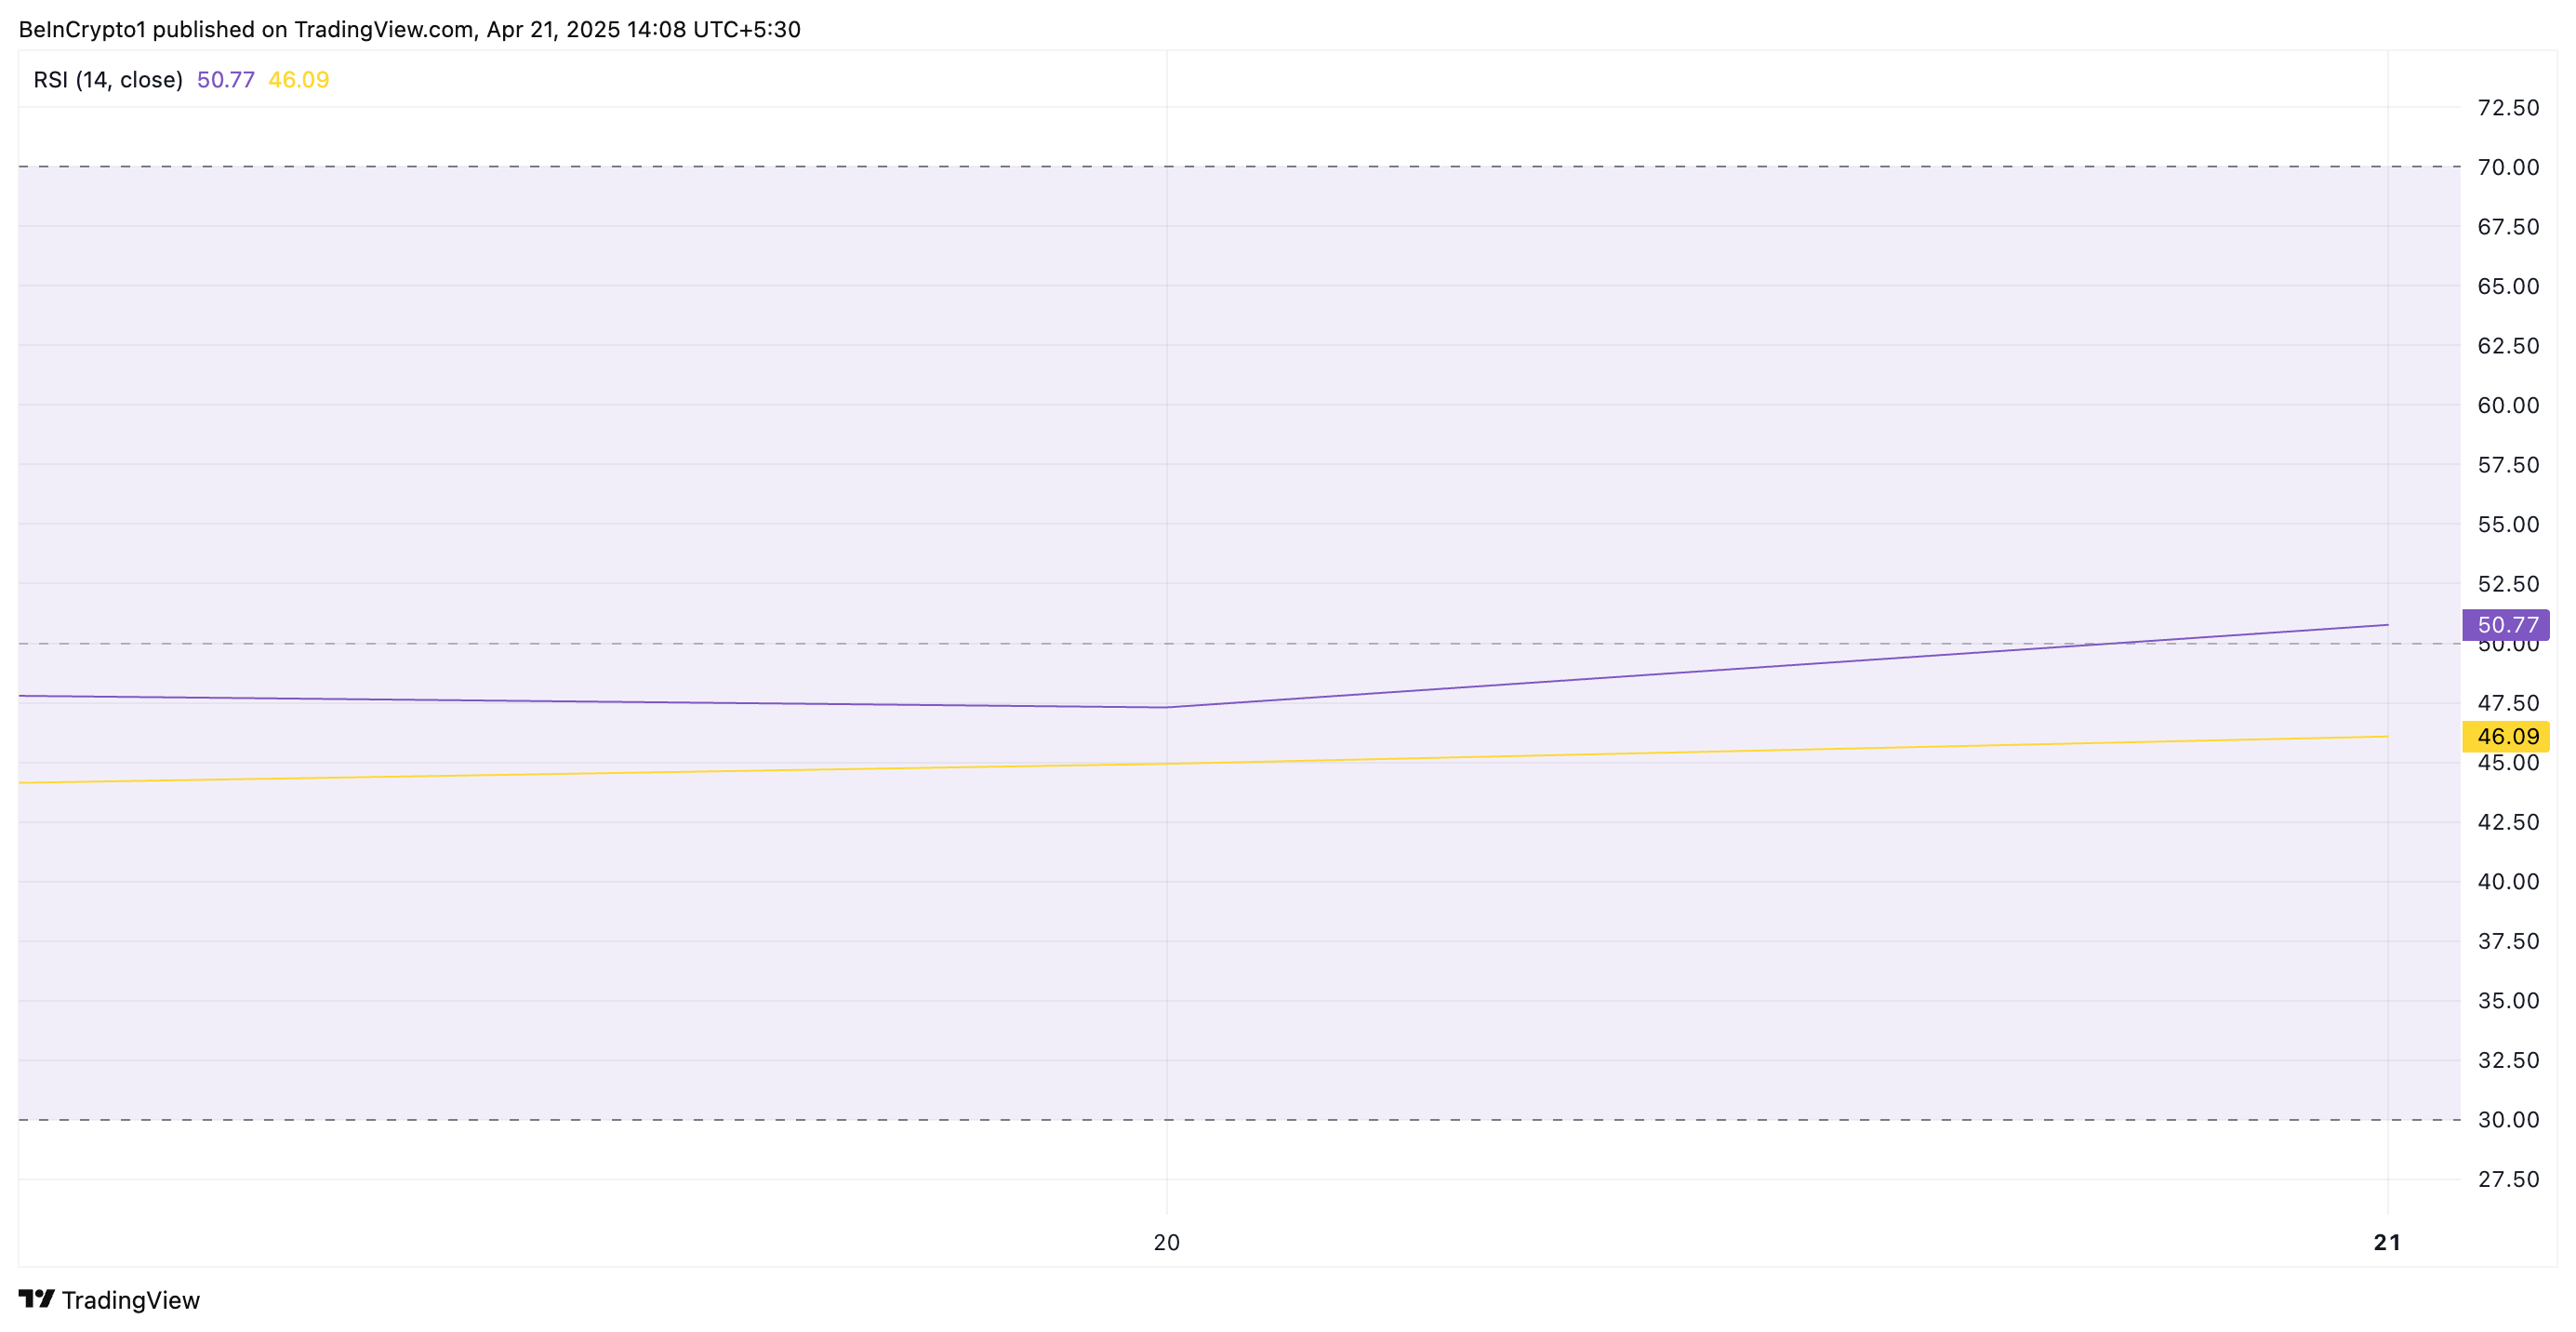
The RSI indicator measures an asset’s overbought and oversold market conditions. It ranges between 0 and 100. Values above 70 suggest that the asset is overbought and due for a price decline, while values under 30 indicate that the asset is oversold and may witness a rebound.
At 50.77, XRP’s RSI signals a shift toward bullish momentum. It indicates that buying pressure is starting to outweigh selling pressure, and the asset may be poised for further price increases.
XRP Eyes $2.18 Resistance as Bulls Look to Push for $2.29
XRP currently trades at $2.13, just 3% away from its next significant resistance level, $2.18. If buying pressure intensifies and the altcoin successfully flips this price point into a support floor, it could trigger further price growth. In this scenario, XRP could potentially climb to $2.29.
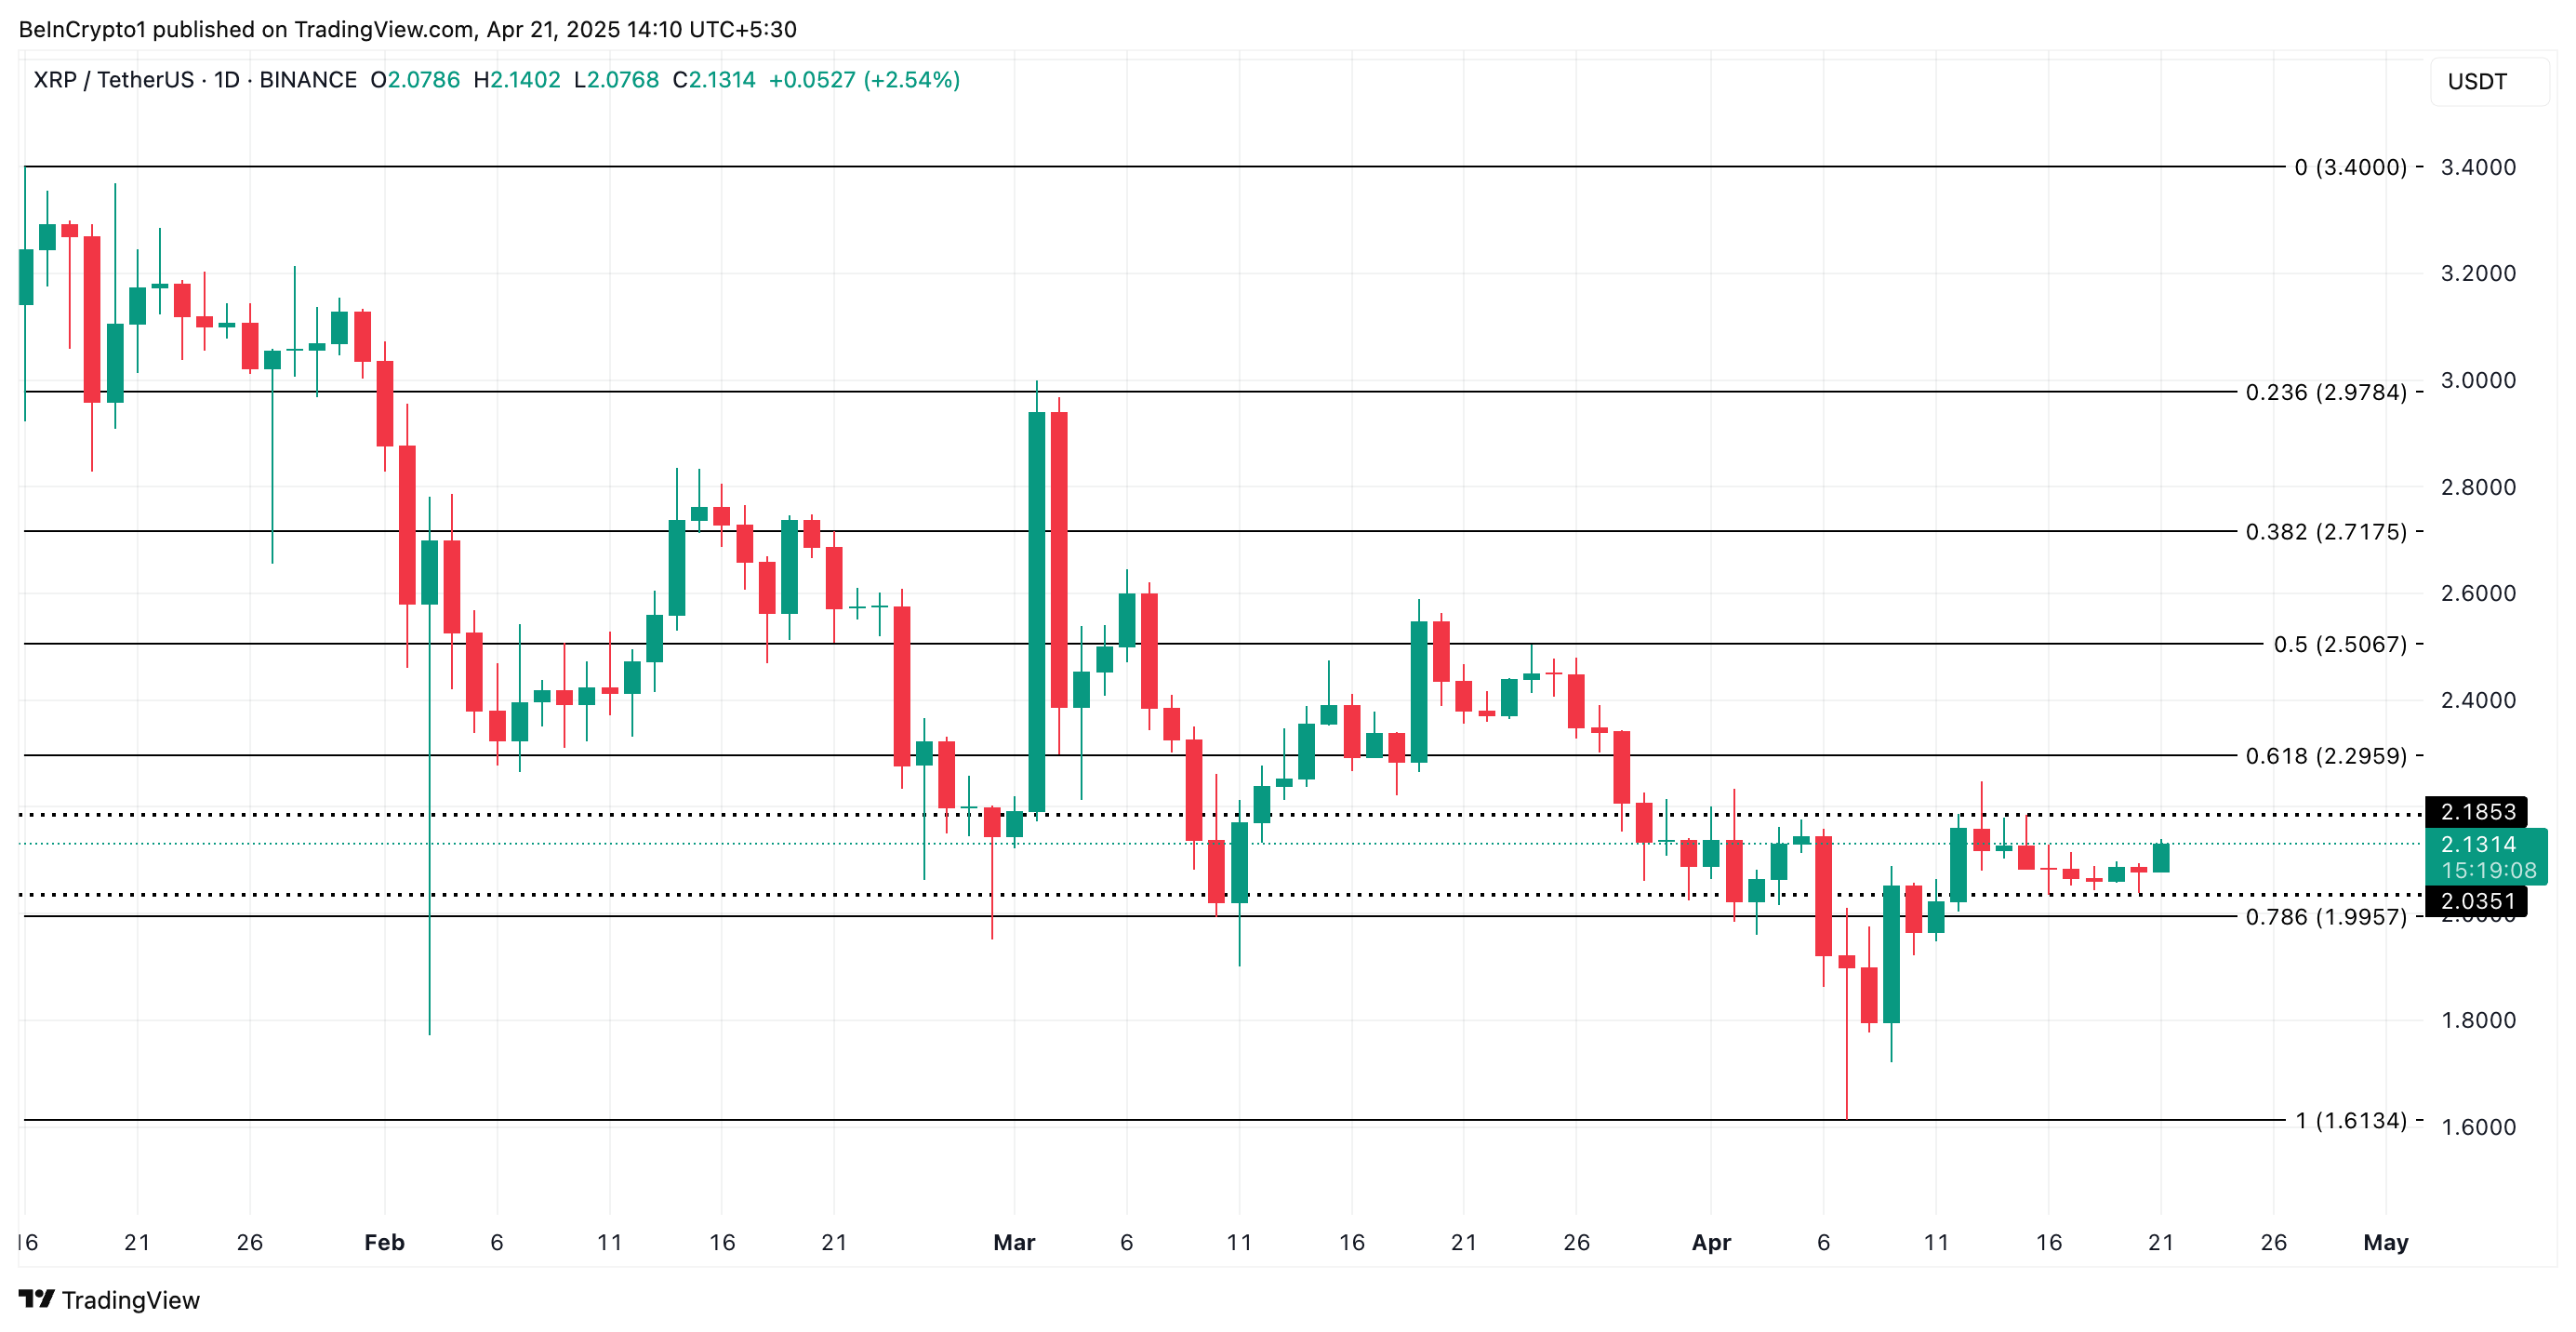
However, if demand weakens and the bears regain control, XRP may remain range-bound. It could even break below the $2.03 support and fall to $1.99.

Log in to Reply
Log in to comment your thoughtsComments
Related Articles
|Square
Get the BTCC app to start your crypto journey
Get started today Scan to join our 100M+ users