Ethereum’s $4,000 Barrier: 3 Key Resistance Factors and the Real Challenge Ahead

Ethereum hits a wall at the psychological $4,000 mark—here's what's holding it back and why the true battle begins above this level.
Institutional Selling Pressure Mounts
Large holders continue taking profits near the $4,000 resistance zone, creating consistent selling pressure that prevents sustained breakouts.
Network Activity Shows Mixed Signals
While DeFi and NFT volumes remain healthy, gas fee volatility and competing Layer 2 solutions create headwinds for broader adoption momentum.
Macro Conditions Remain Uncertain
Traditional market correlations and regulatory uncertainty continue influencing investor sentiment despite Ethereum's strong fundamentals.
The real test? Clearing $4,200—where previous cycle highs created massive resistance that could make current levels look like a warm-up exercise. Because nothing says 'financial revolution' like watching traders sweat over round numbers while traditional finance veterans smirk about 'digital gold' that still tracks the S&P 500.
Whales Are Selling, And Accumulation Has Slowed Down
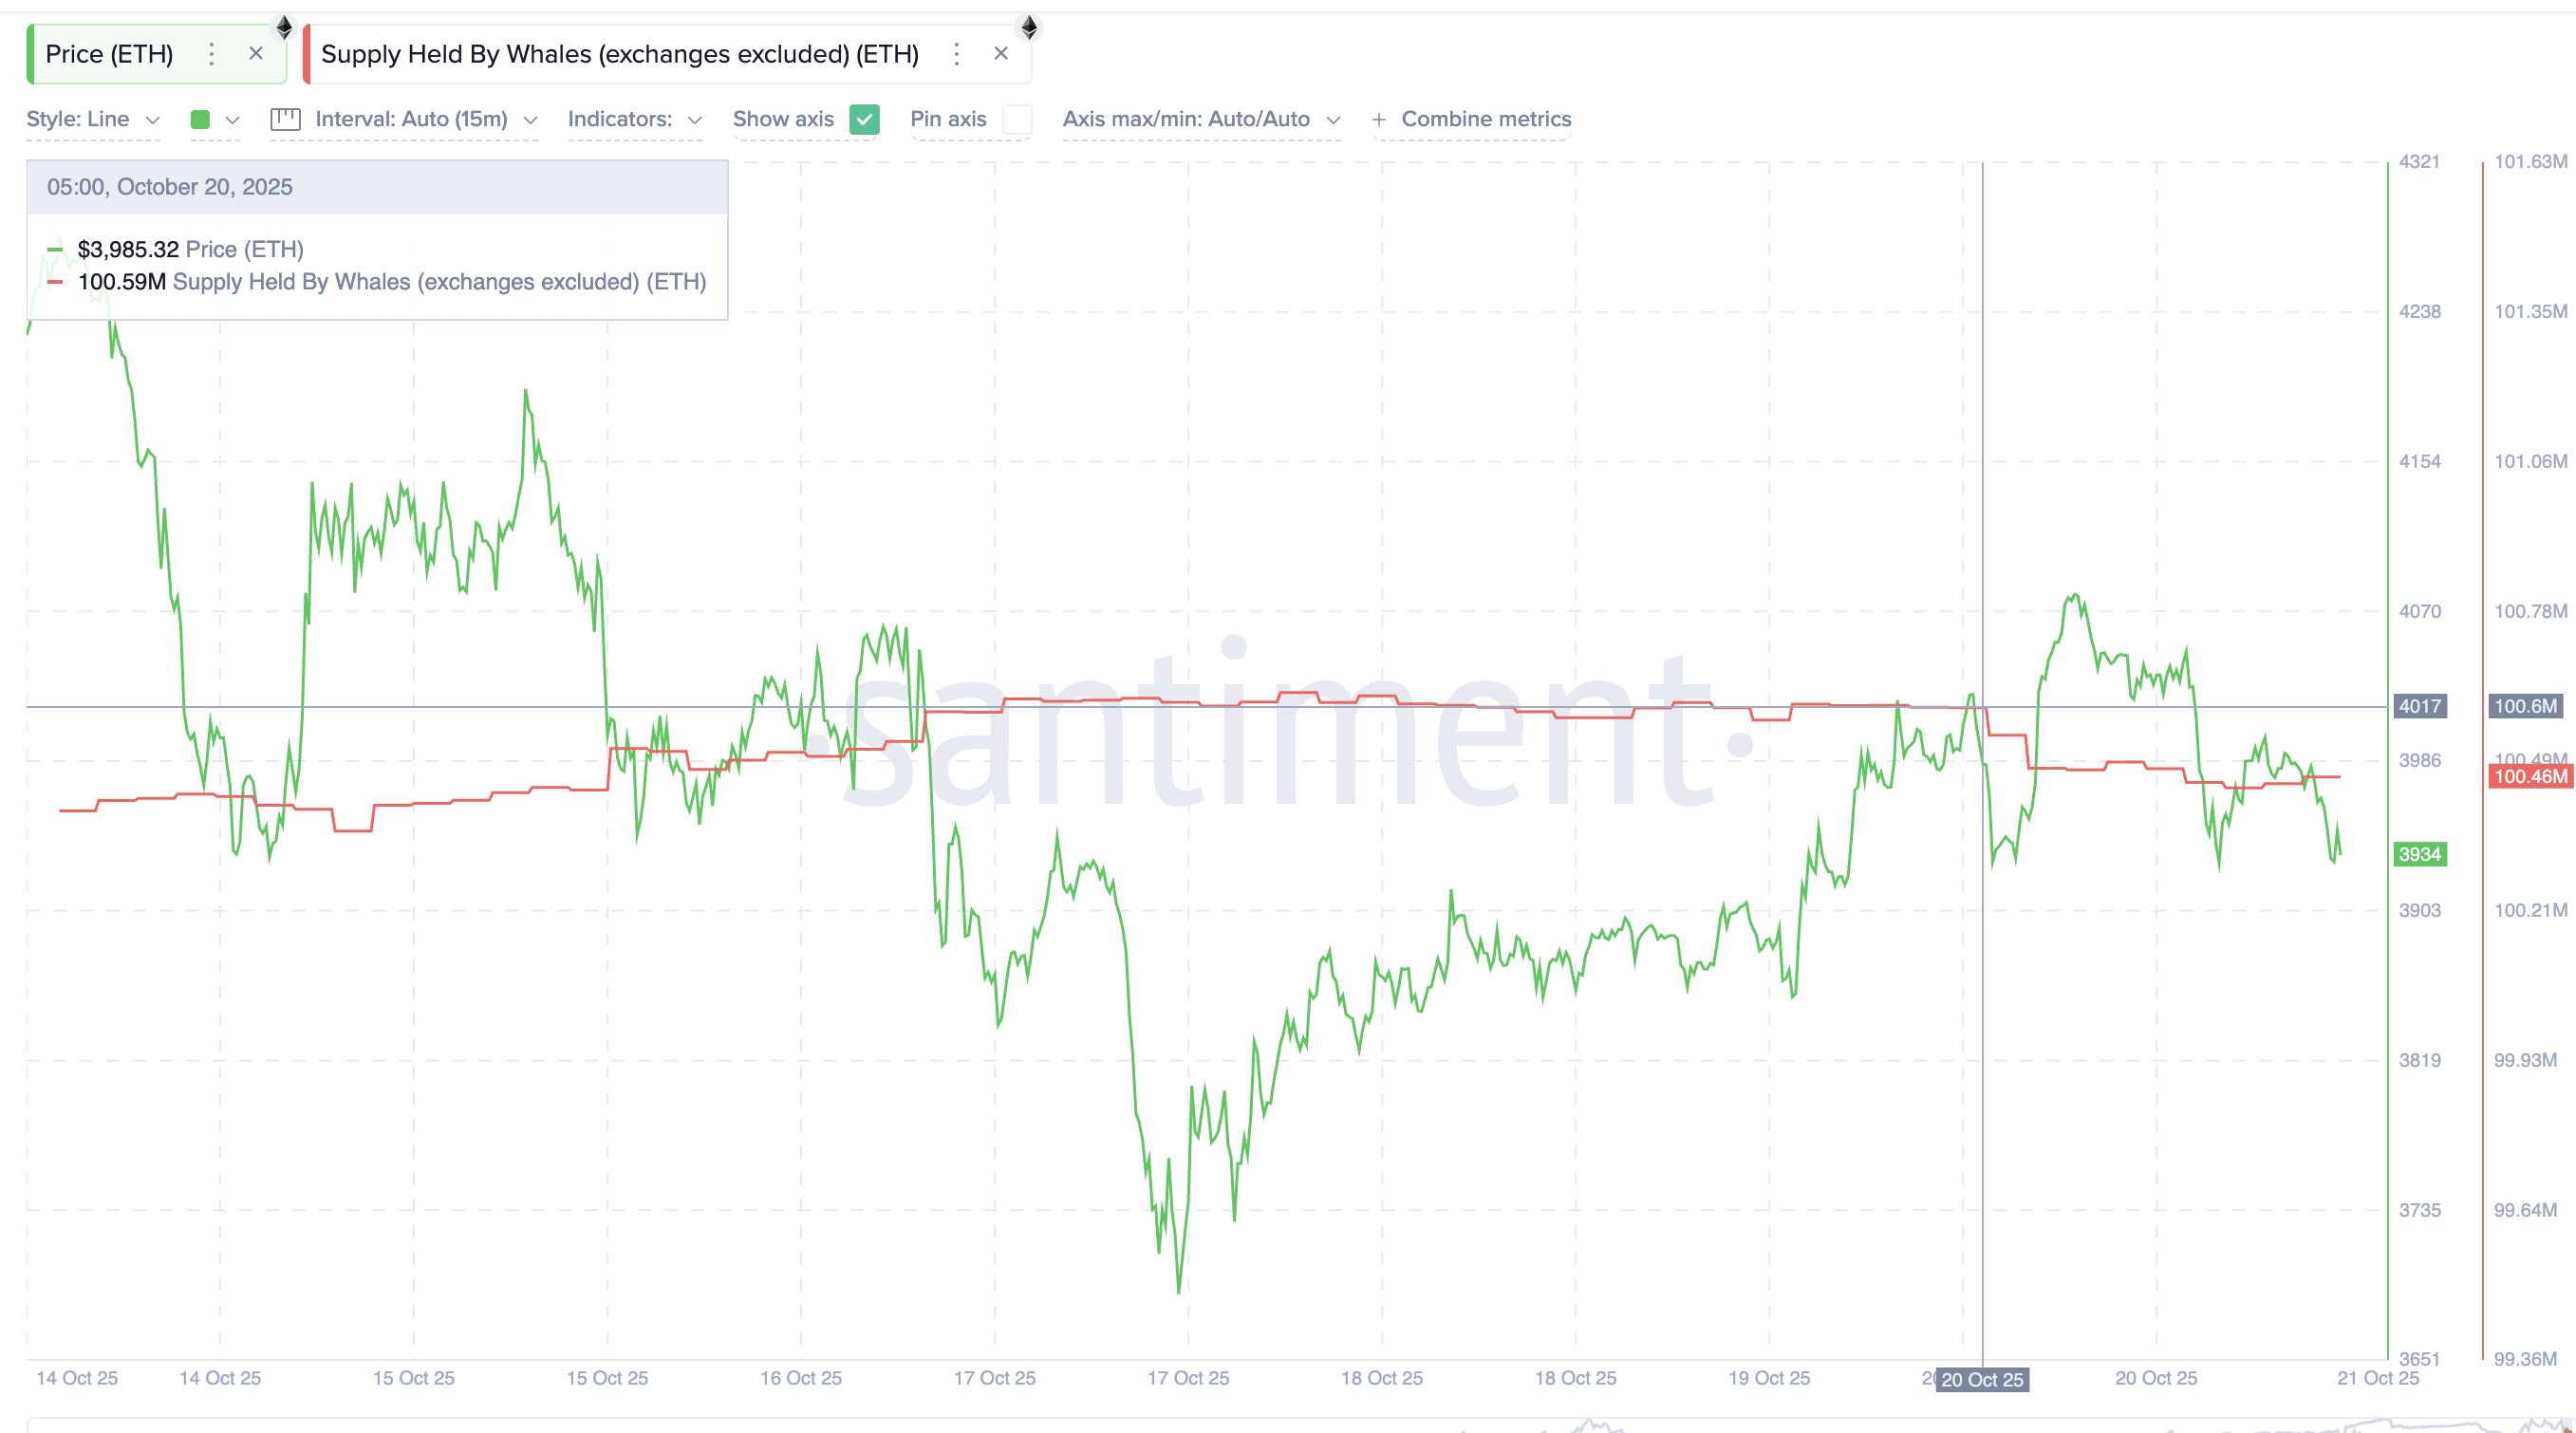
The first sign of pressure comes from Ethereum’s largest holders. Since October 20, whale addresses have reduced their combined holdings from 100.60 million ETH to 100.46 million ETH — a drop of about 140,000 ETH, or roughly $550 million at current prices. This steady selling adds quiet resistance to any short-term rally attempt and keeps the market cautious.
Sign up for Editor Harsh Notariya’s Daily crypto Newsletter here.
At the same time, Ethereum’s Holder Accumulation Ratio (HAR) — which tracks the share of active holders adding to their positions versus trimming them — has stalled near 30.77%. It had been rising earlier in October but has flattened since mid-month, showing that new accumulation is slowing. In simple terms, existing holders are not buying aggressively, and fresh money isn’t stepping in yet.
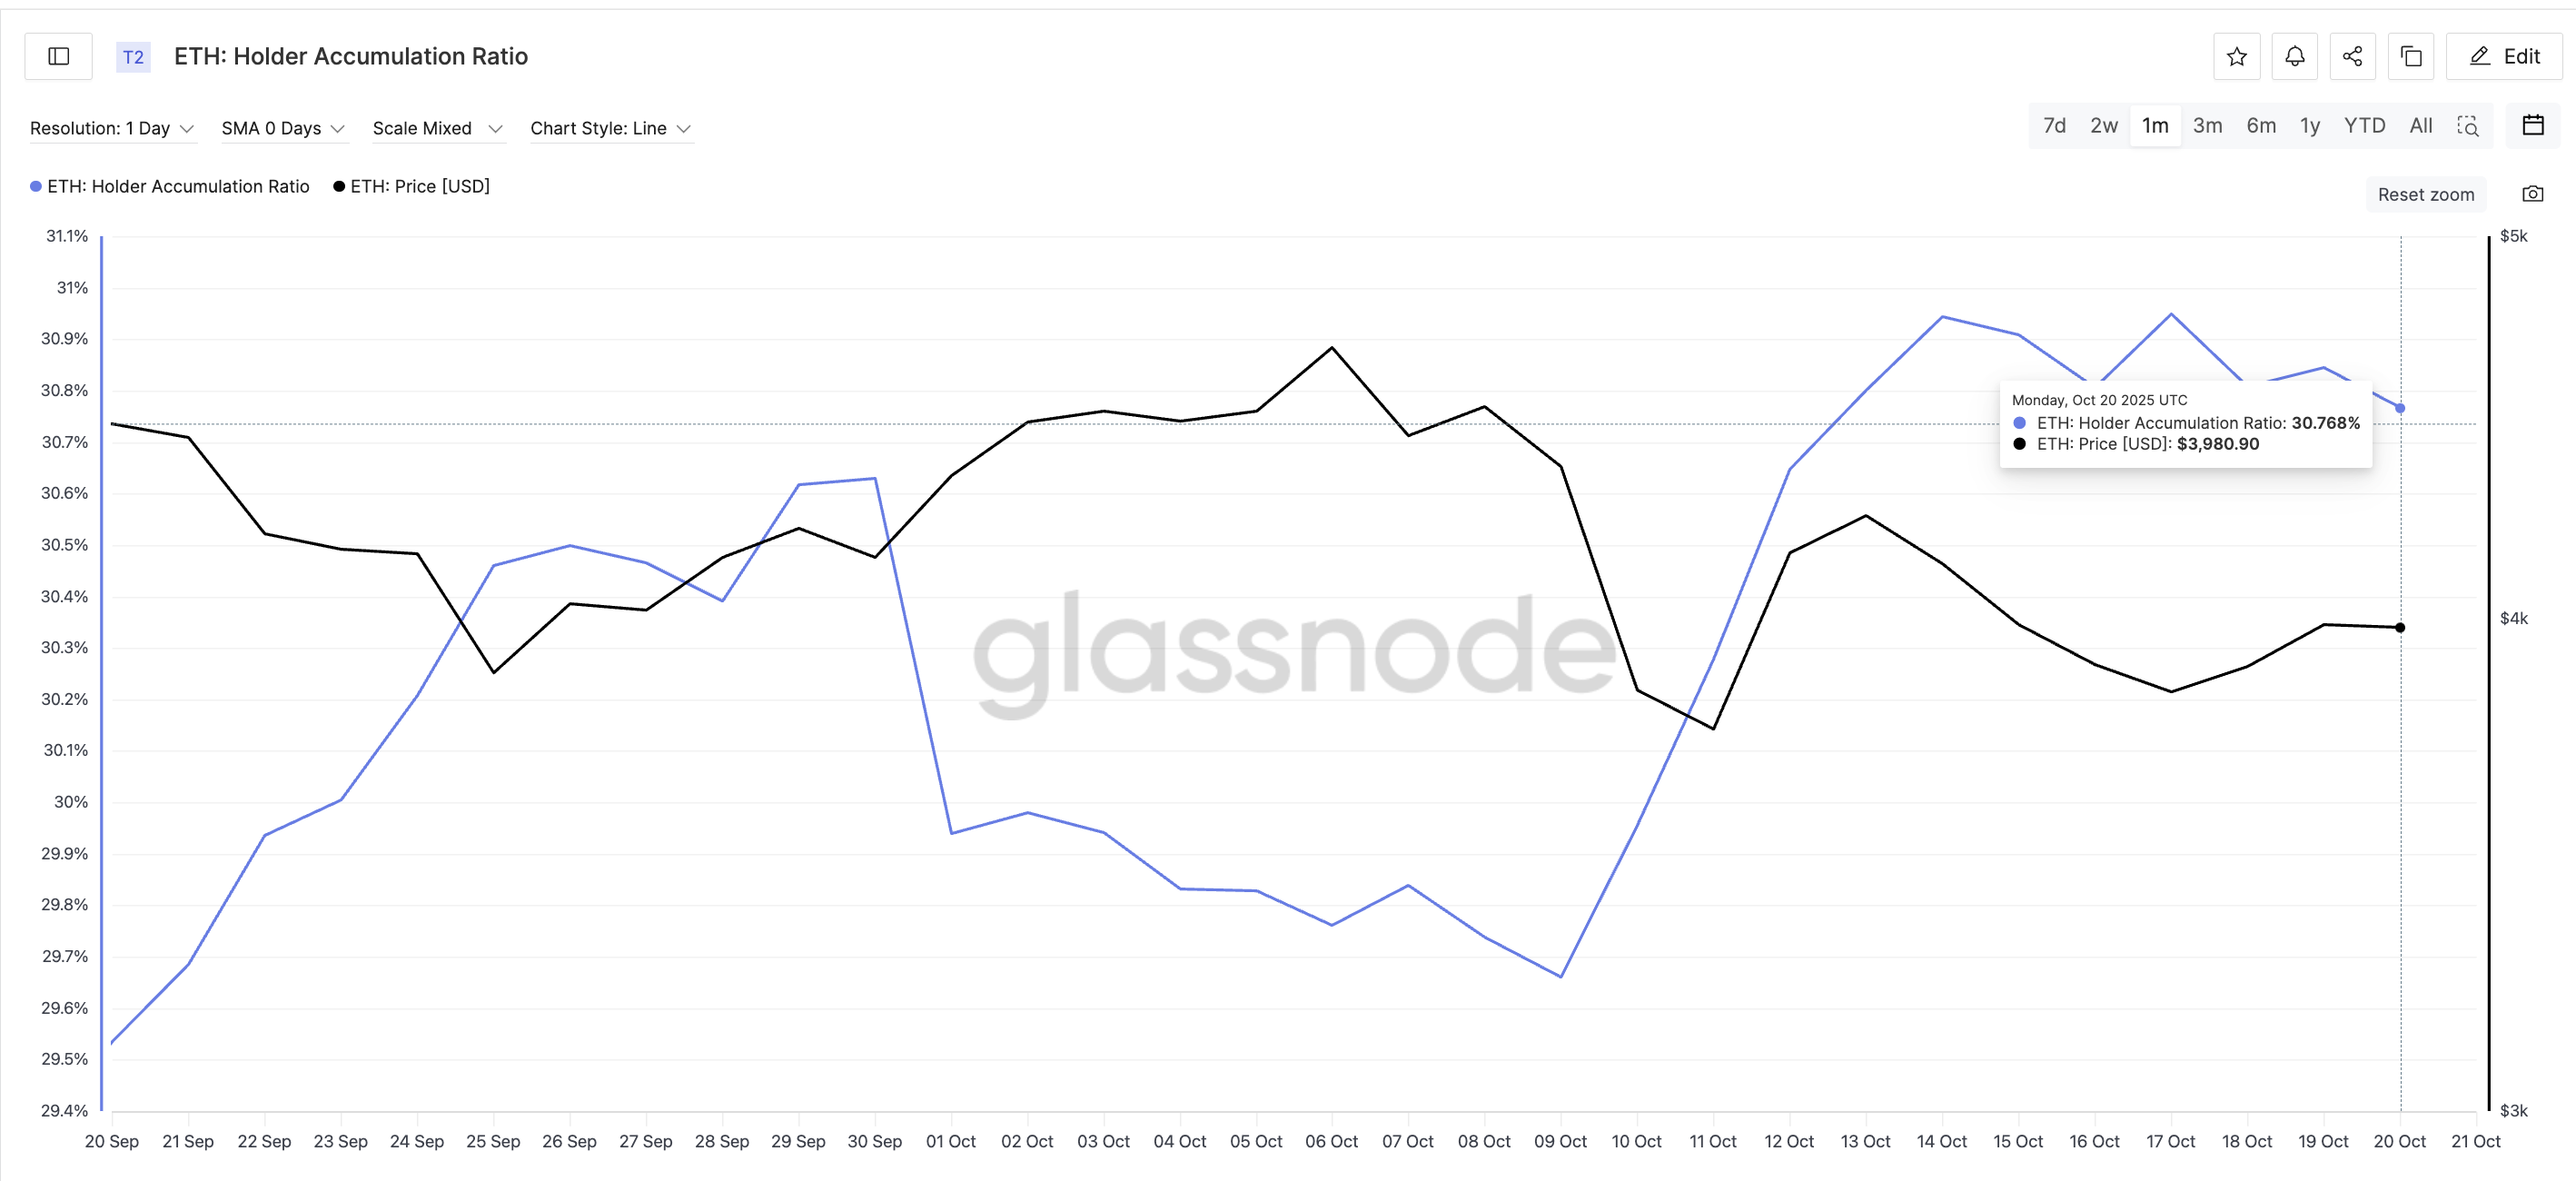
When the HAR trends sideways after a steady climb, it often signals that traders are waiting for a clear breakout before committing again. This cautious stance from both whales and active holders explains Ethereum’s recent hesitation near $4,000.
Heavy Resistance Band Above $3,955 Keeps Price In Check
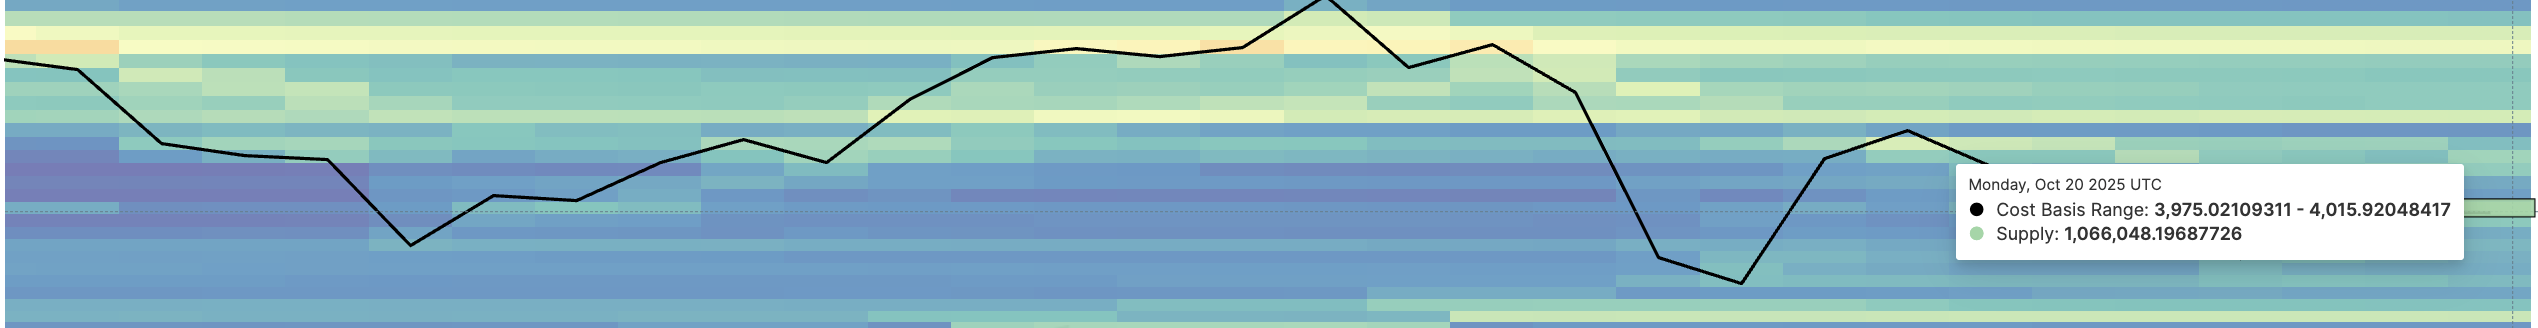
The second reason lies in Ethereum’s Cost Basis Distribution (CBD) map — a tool that shows where most ETH supply last changed hands. This helps identify “supply walls,” or price zones where many holders might sell to recover earlier losses.
Right now, a dense resistance band exists between $3,955 and $4,015, with about 1.06 million ETH purchased in this range. This makes the area just above the current ETH price difficult to break, as every move toward $4,000 brings more selling pressure.
But this isn’t the only challenge. Another large cluster sits between $4,270 and $4,314, where nearly 1.33 million ETH were bought. This second zone aligns closely with the technical resistance at $4,340 (which we will discuss later), meaning ethereum could face its true breakout test there.
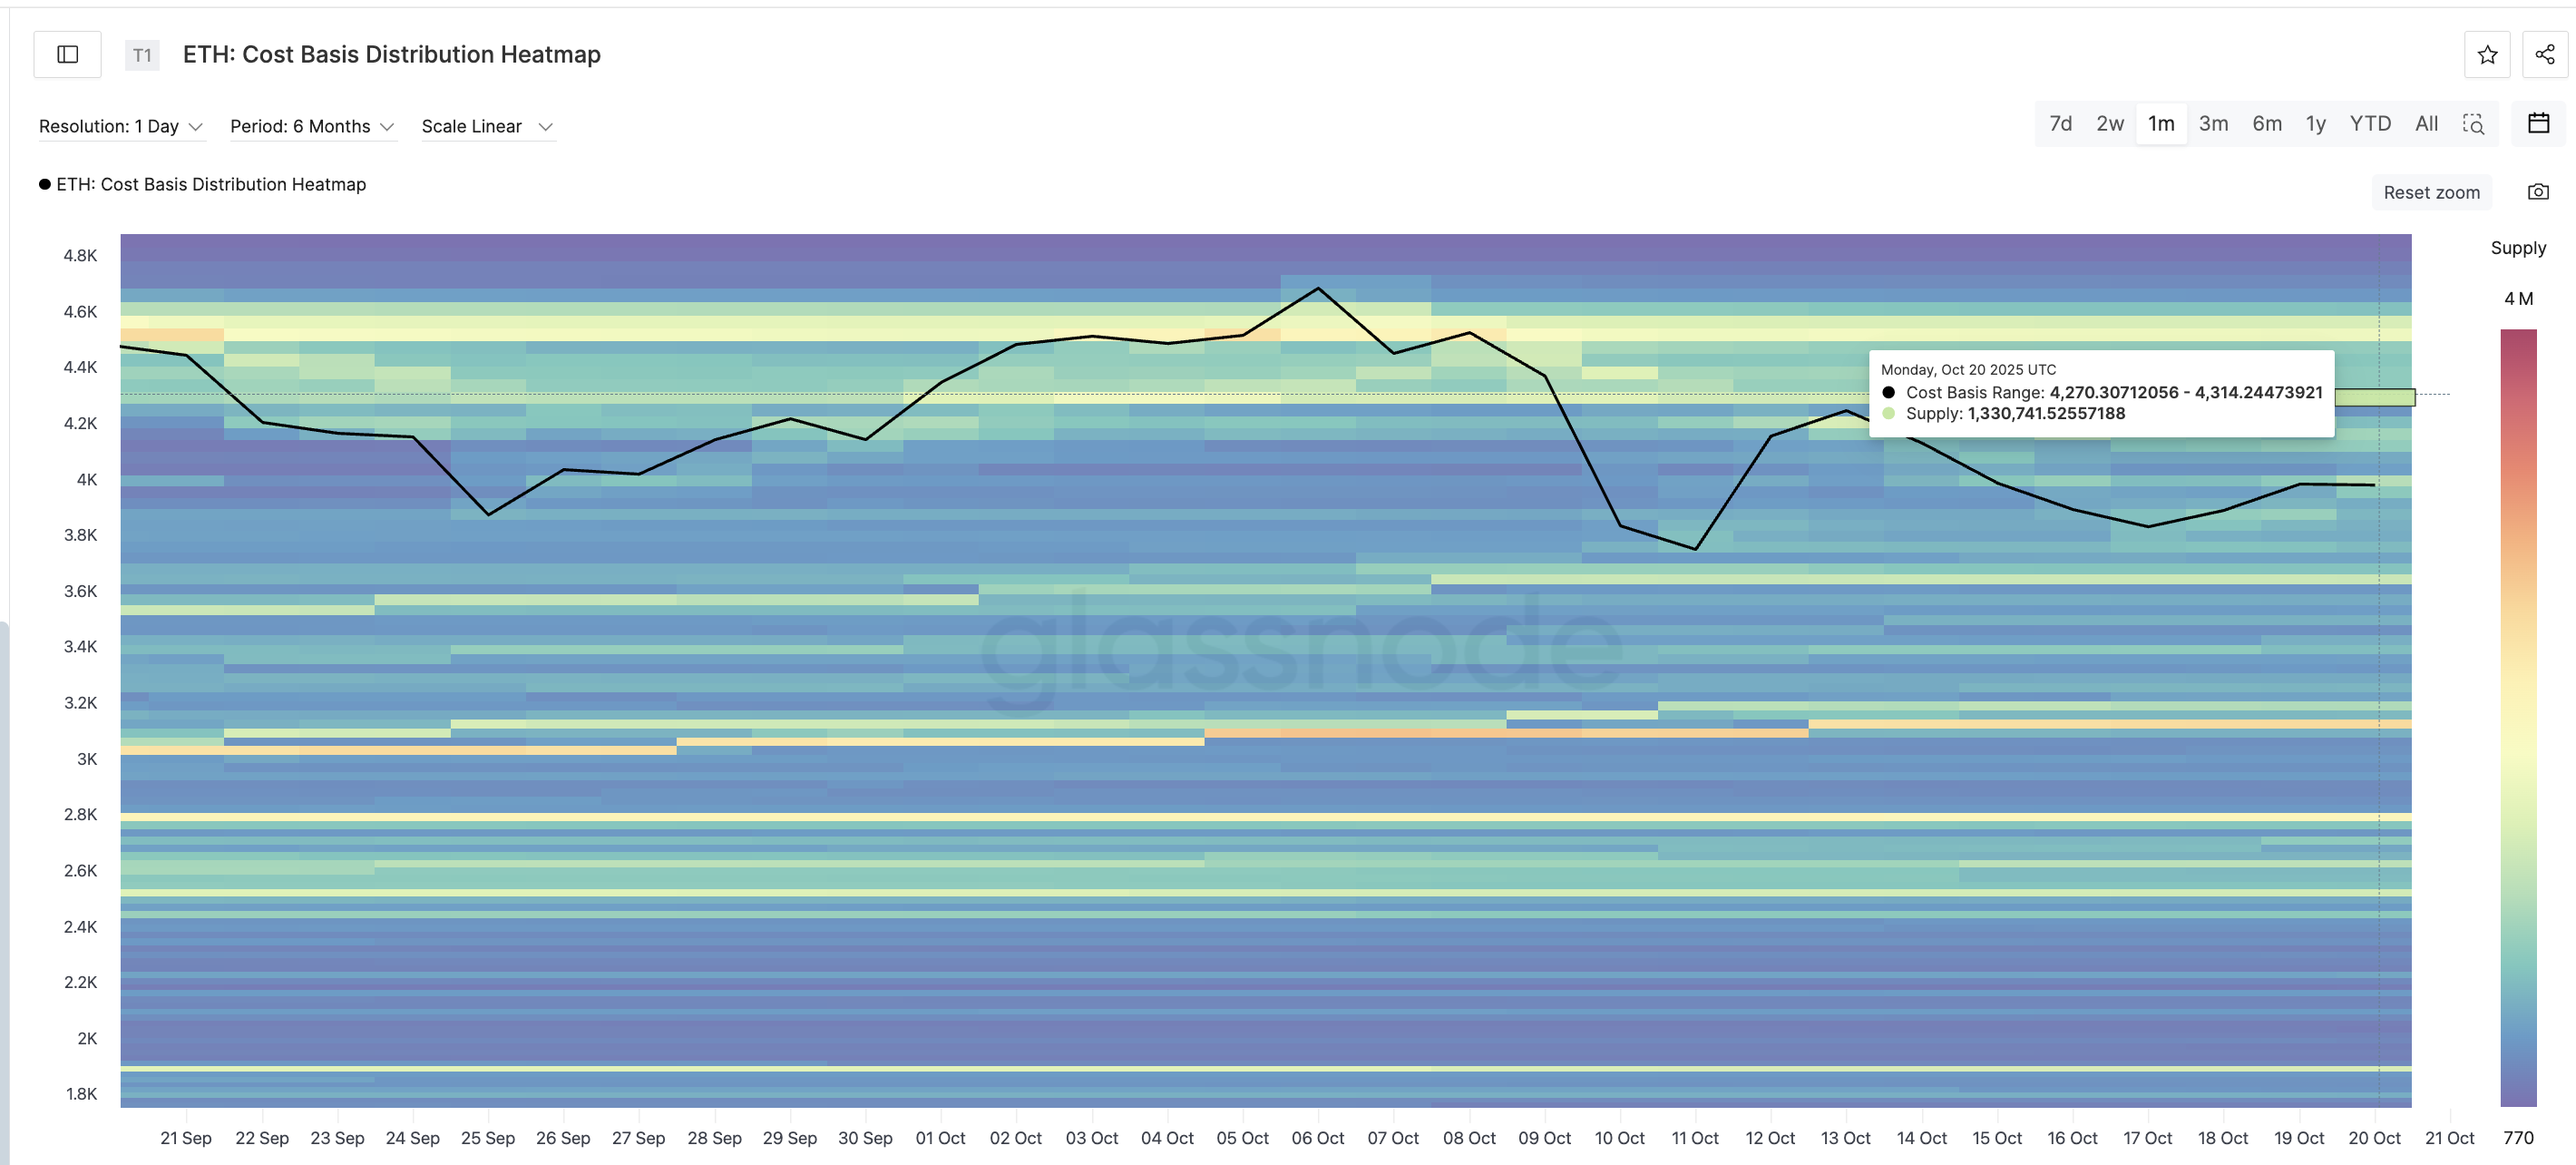
Until ETH clears these layers, traders are likely to keep taking profits near $4,000, preventing any sustained MOVE higher.
Ethereum Price Setup Is Still Bullish, But Needs A Close Above $4,340
Despite these hurdles, Ethereum’s structure remains constructive. The price continues to respect an ascending trendline that has held since early August, keeping the broader uptrend intact.
The daily chart shows ETH reacting to Fibonacci retracement levels drawn from its previous rally. The 0.618 Fibonacci level sits around $4,200, while the 0.786 level is near $4,340 — both overlapping with the key resistance zones seen on-chain (per the CBD heatmap). A daily candle close above $4,340 WOULD confirm a breakout and could open the path to $4,520 and even $4,960, retesting the all-time high range.
However, the first hurdle to cross is $4,000, aligning with the 0.382 Fib level. It is also the zone ETH price has been trying to cross convincingly since October 16.
Momentum indicators also support this view. The Relative Strength Index (RSI) — which measures the balance between buying and selling pressure — shows a hidden bullish divergence. That means while price has made higher lows since August 2, RSI has made lower lows, often signaling an ongoing uptrend beneath short-term weakness.
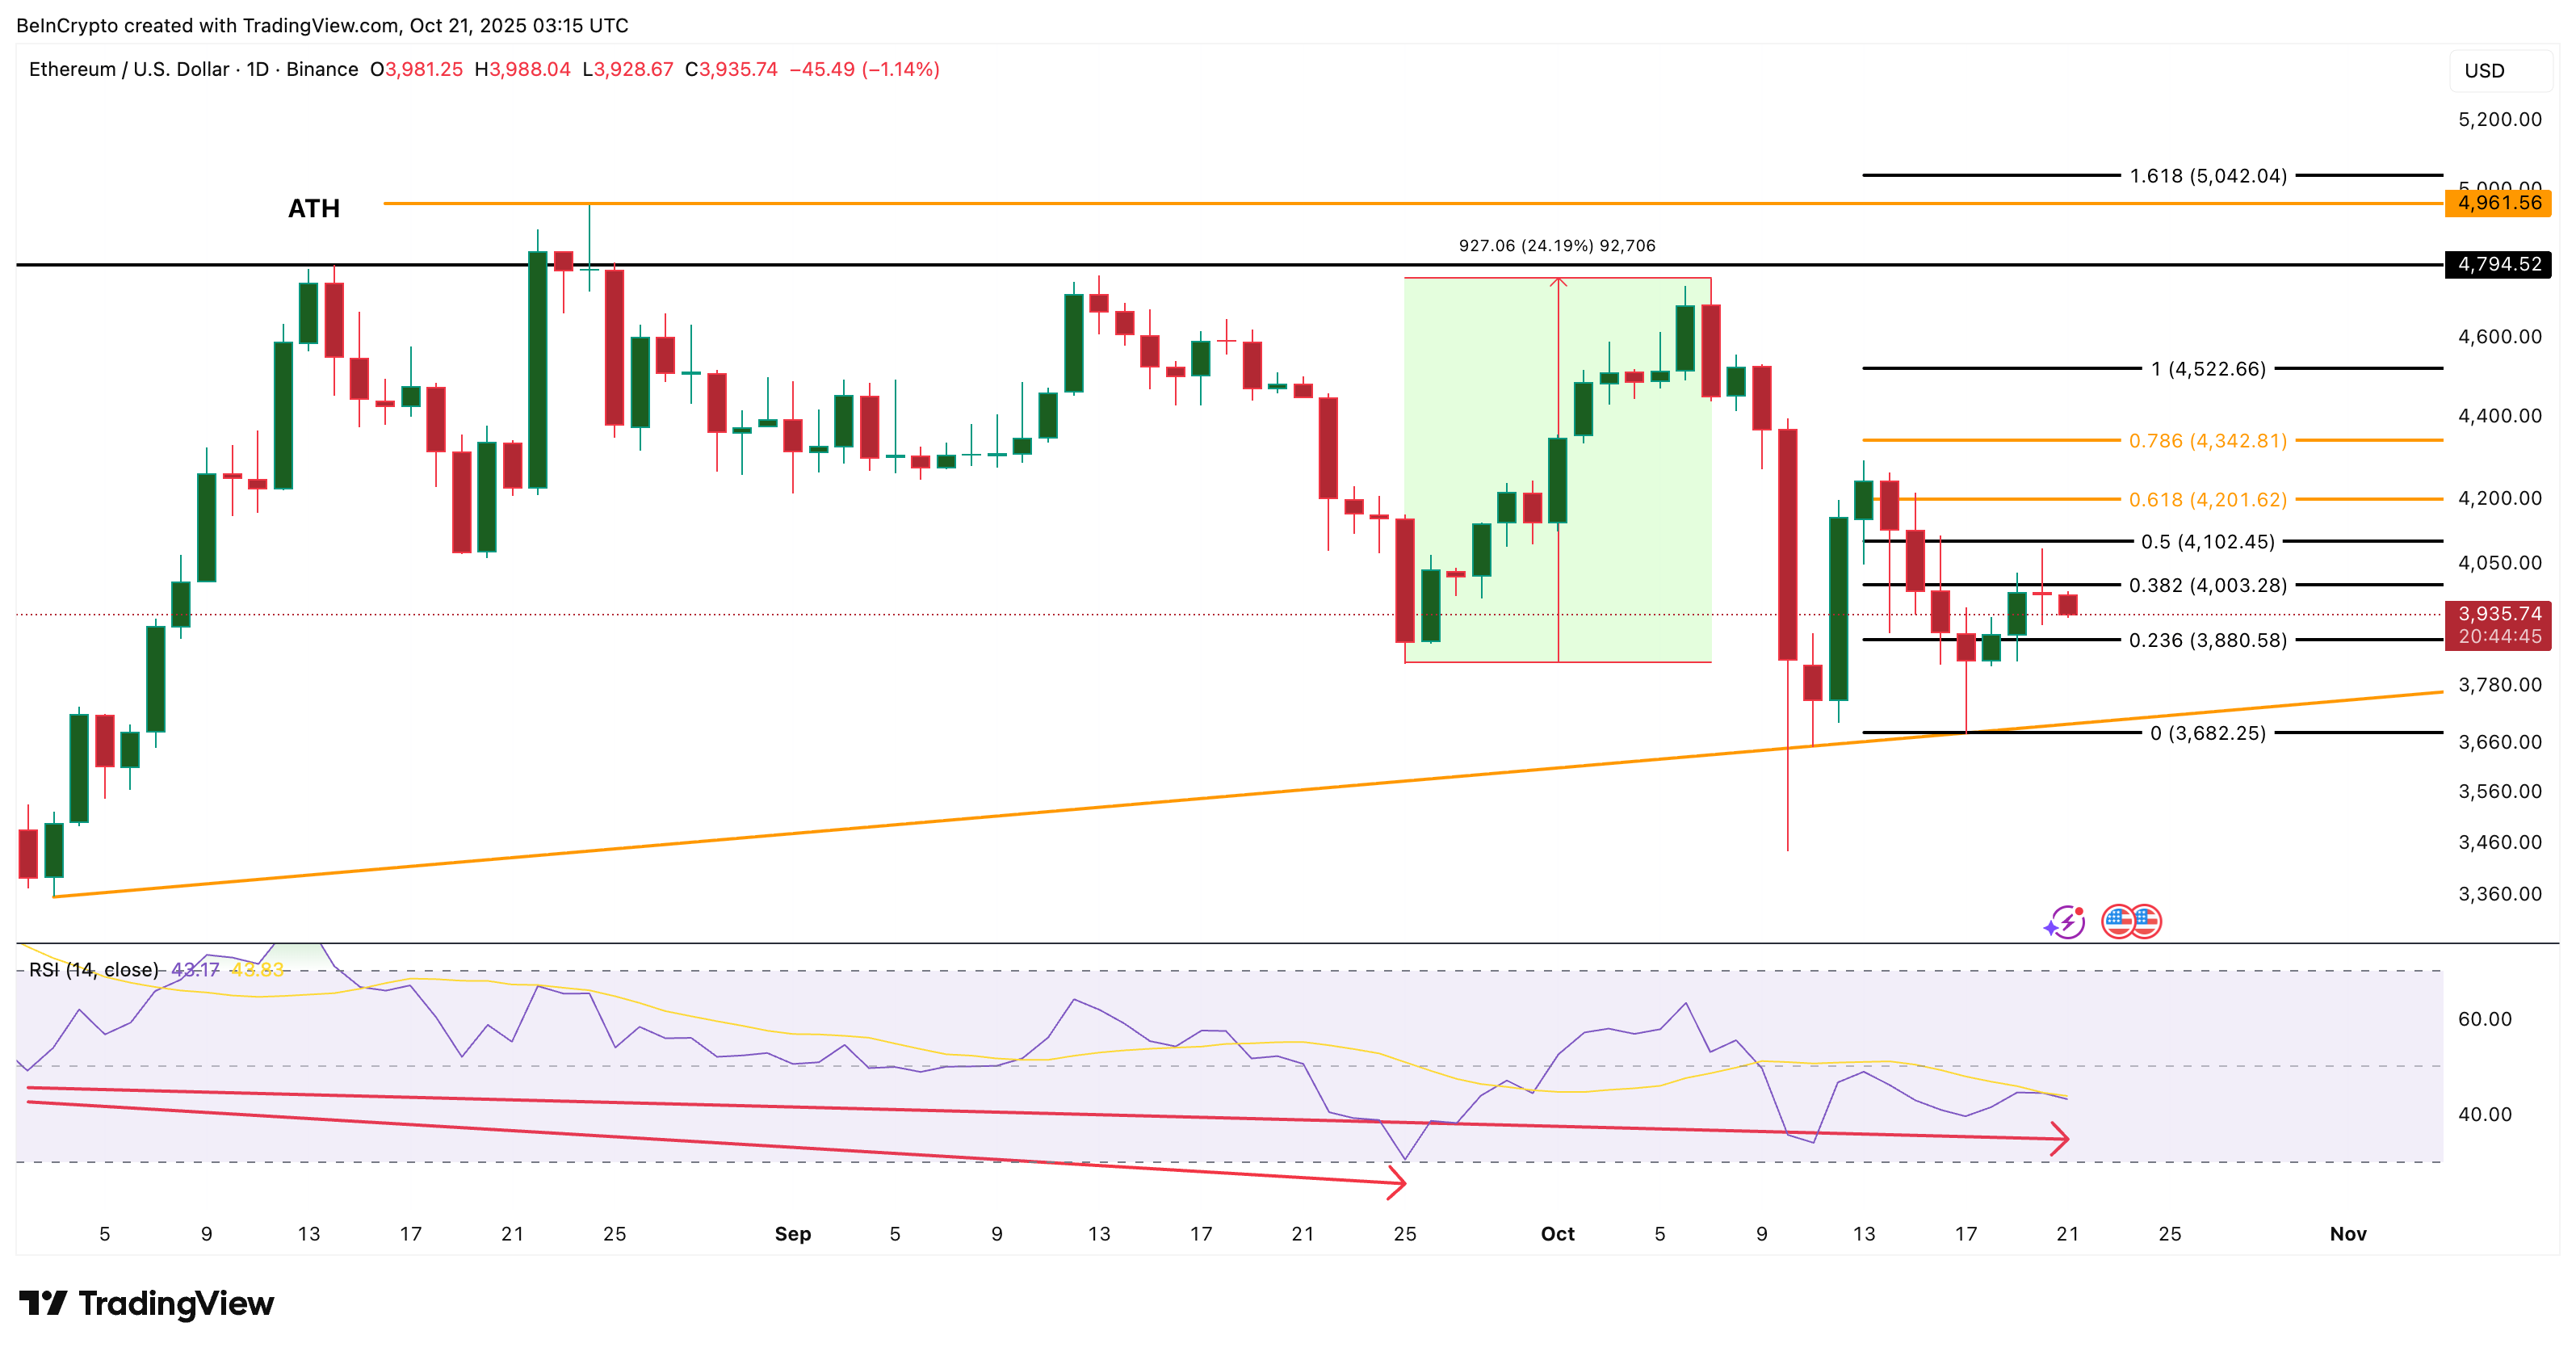
The last time this divergence appeared, between August 2 and September 25, Ethereum rallied nearly 24%, moving close to $4,880. A similar move from current levels could send ETH toward the $4,960 zone. But that could only happen after a confirmed breakout above $4,340.
If ETH fails to hold $3,880, however, short-term sentiment could turn negative. That would expose support at $3,680 — the base of its long-term trendline.
