COAI Shatters Resistance - New All-Time High Incoming, But One Critical Risk Looms

COAI rockets past key technical levels as bullish momentum builds
Breakout pattern signals potential for explosive price movement
The Bull Case Strengthens
Trading volumes surge alongside the technical breakout, creating perfect conditions for a sustained upward trajectory. Market sentiment shifts decisively positive as COAI demonstrates strong fundamental strength.
The Single Remaining Threat
Despite the overwhelmingly bullish setup, one persistent risk factor continues to shadow the rally. Market analysts point to potential regulatory headwinds that could temporarily derail momentum—because what's finance without some good old-fashioned uncertainty to keep things interesting?
Will COAI complete its ascent to record highs, or will that one lingering risk trigger a classic crypto reality check?
Money Flow Leans Positive, but Momentum Might Stall
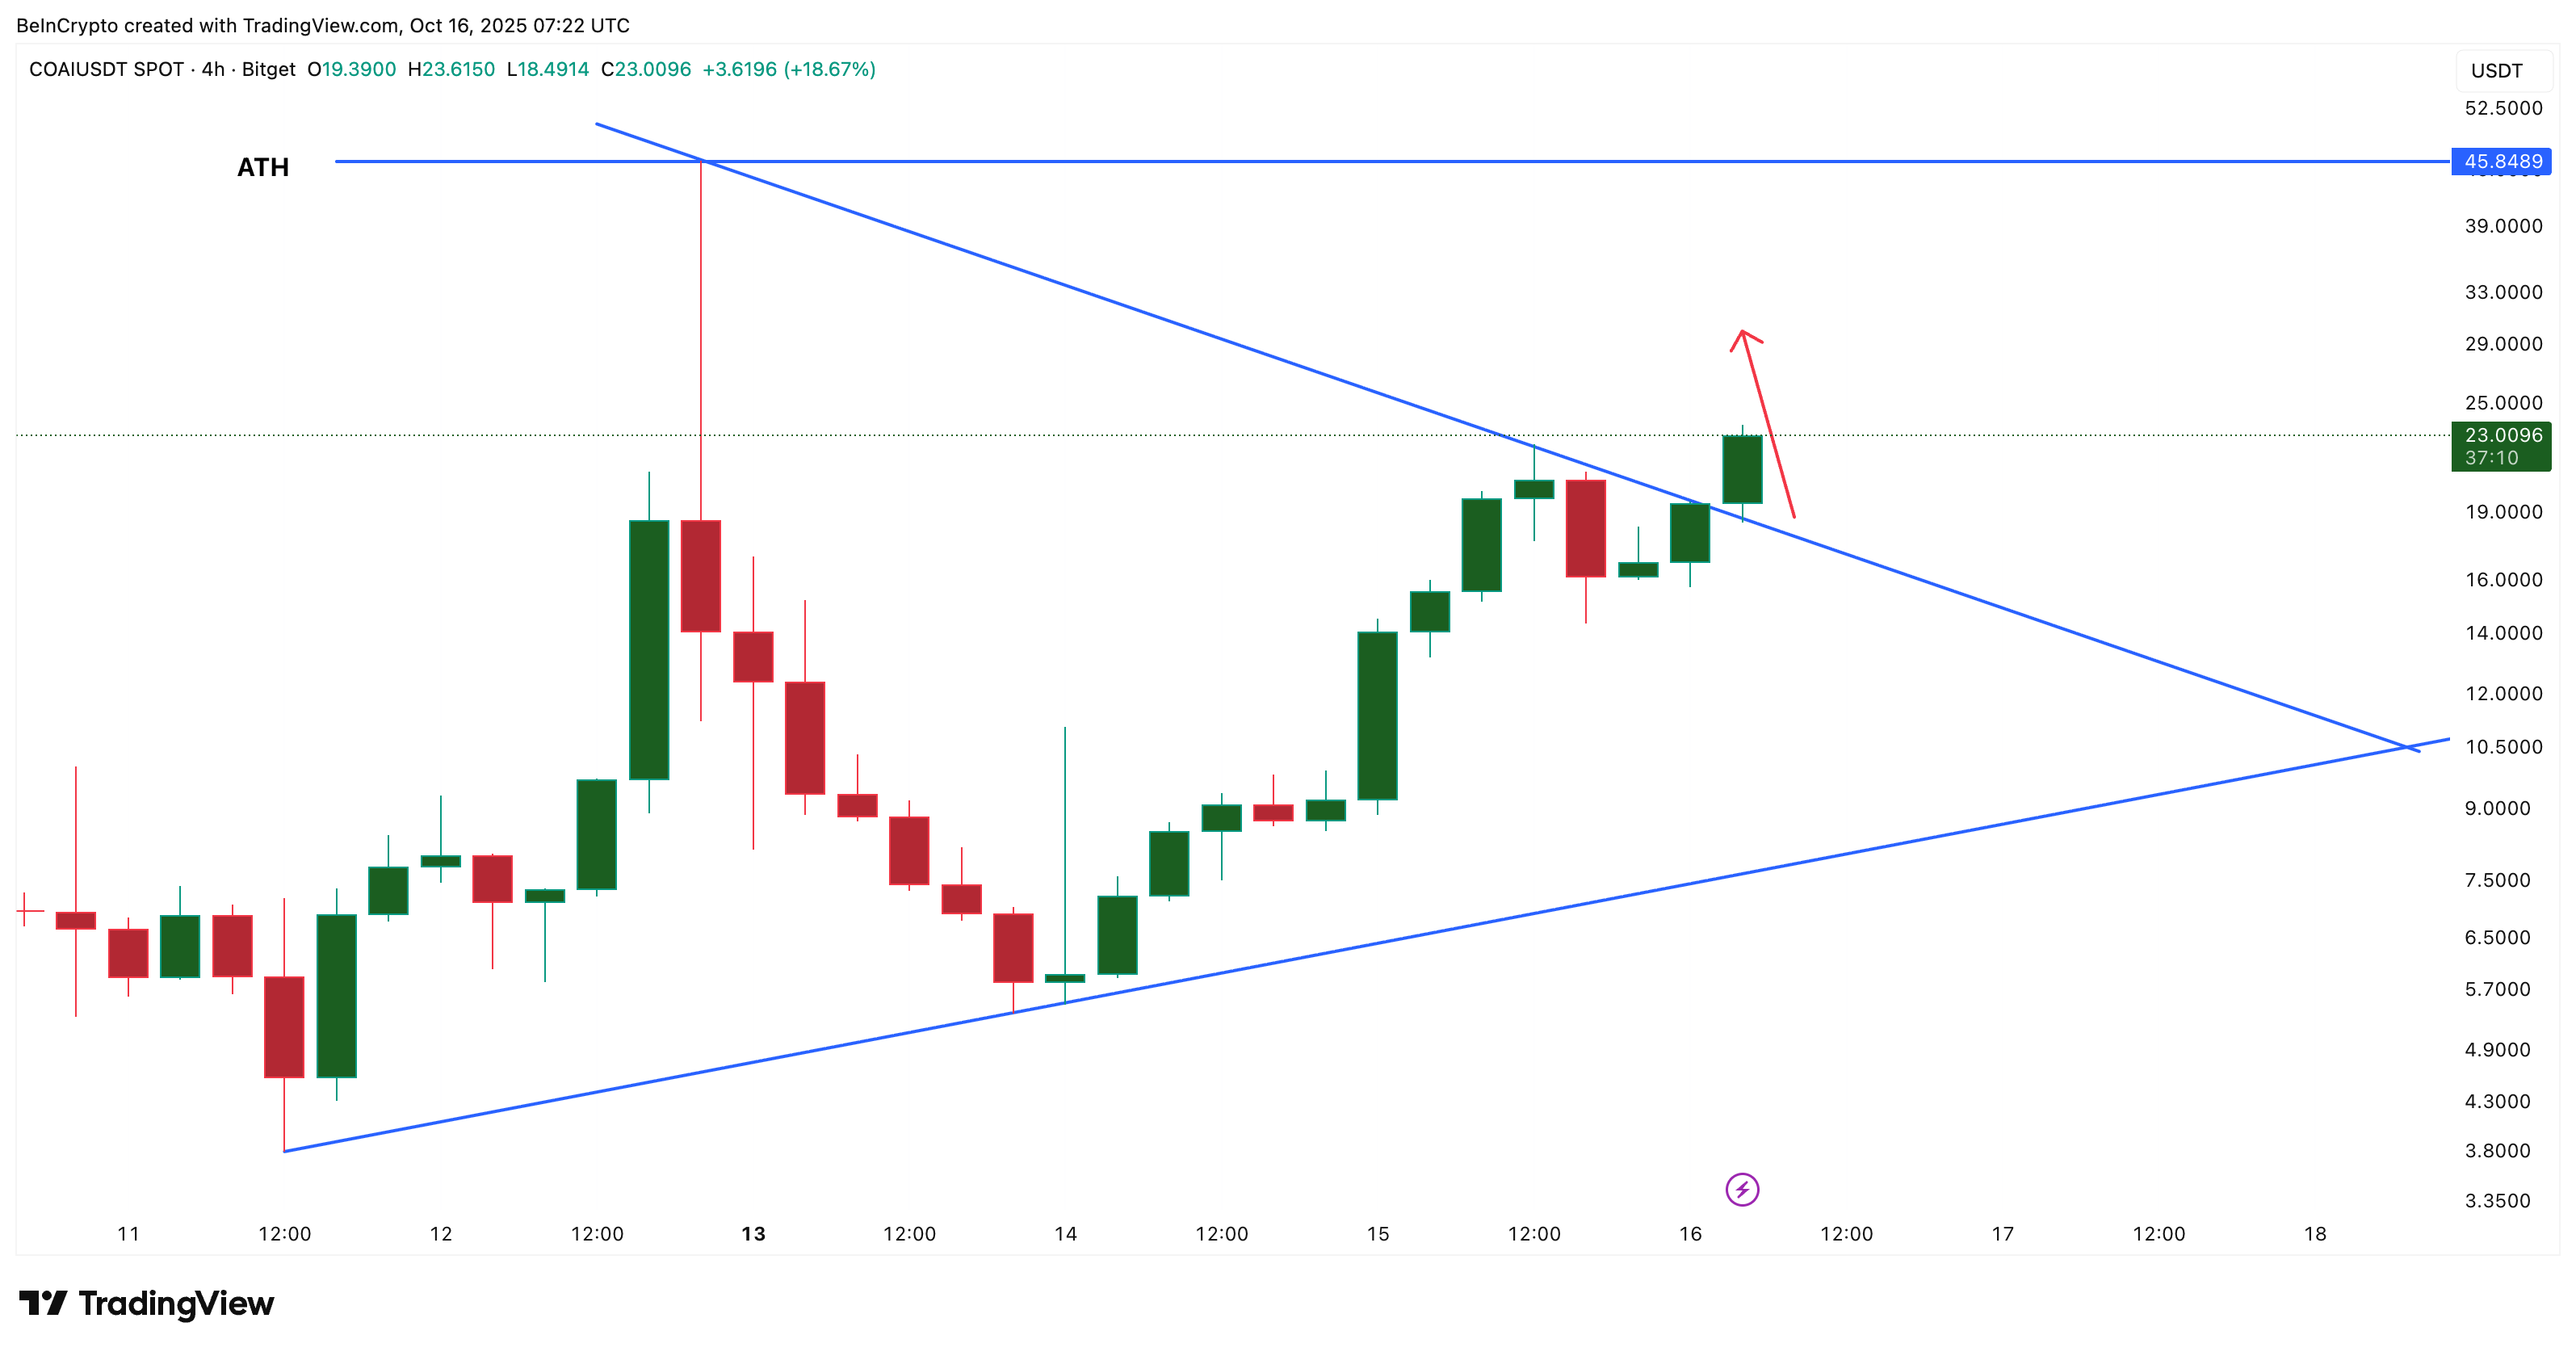
COAI broke out of a symmetrical triangle, a pattern that forms when price makes lower highs and higher lows, showing consolidation before a large move. A confirmed close above this structure usually signals trend continuation, which is now visible on COAI’s 4-hour chart.
Sign up for Editor Harsh Notariya’s Daily crypto Newsletter here.
Supporting this breakout, the Chaikin Money FLOW (CMF) — an indicator that tracks the flow of money from large investors — has started to turn upward after dipping below zero. This shows that large wallets are returning slowly, though conviction is still limited.
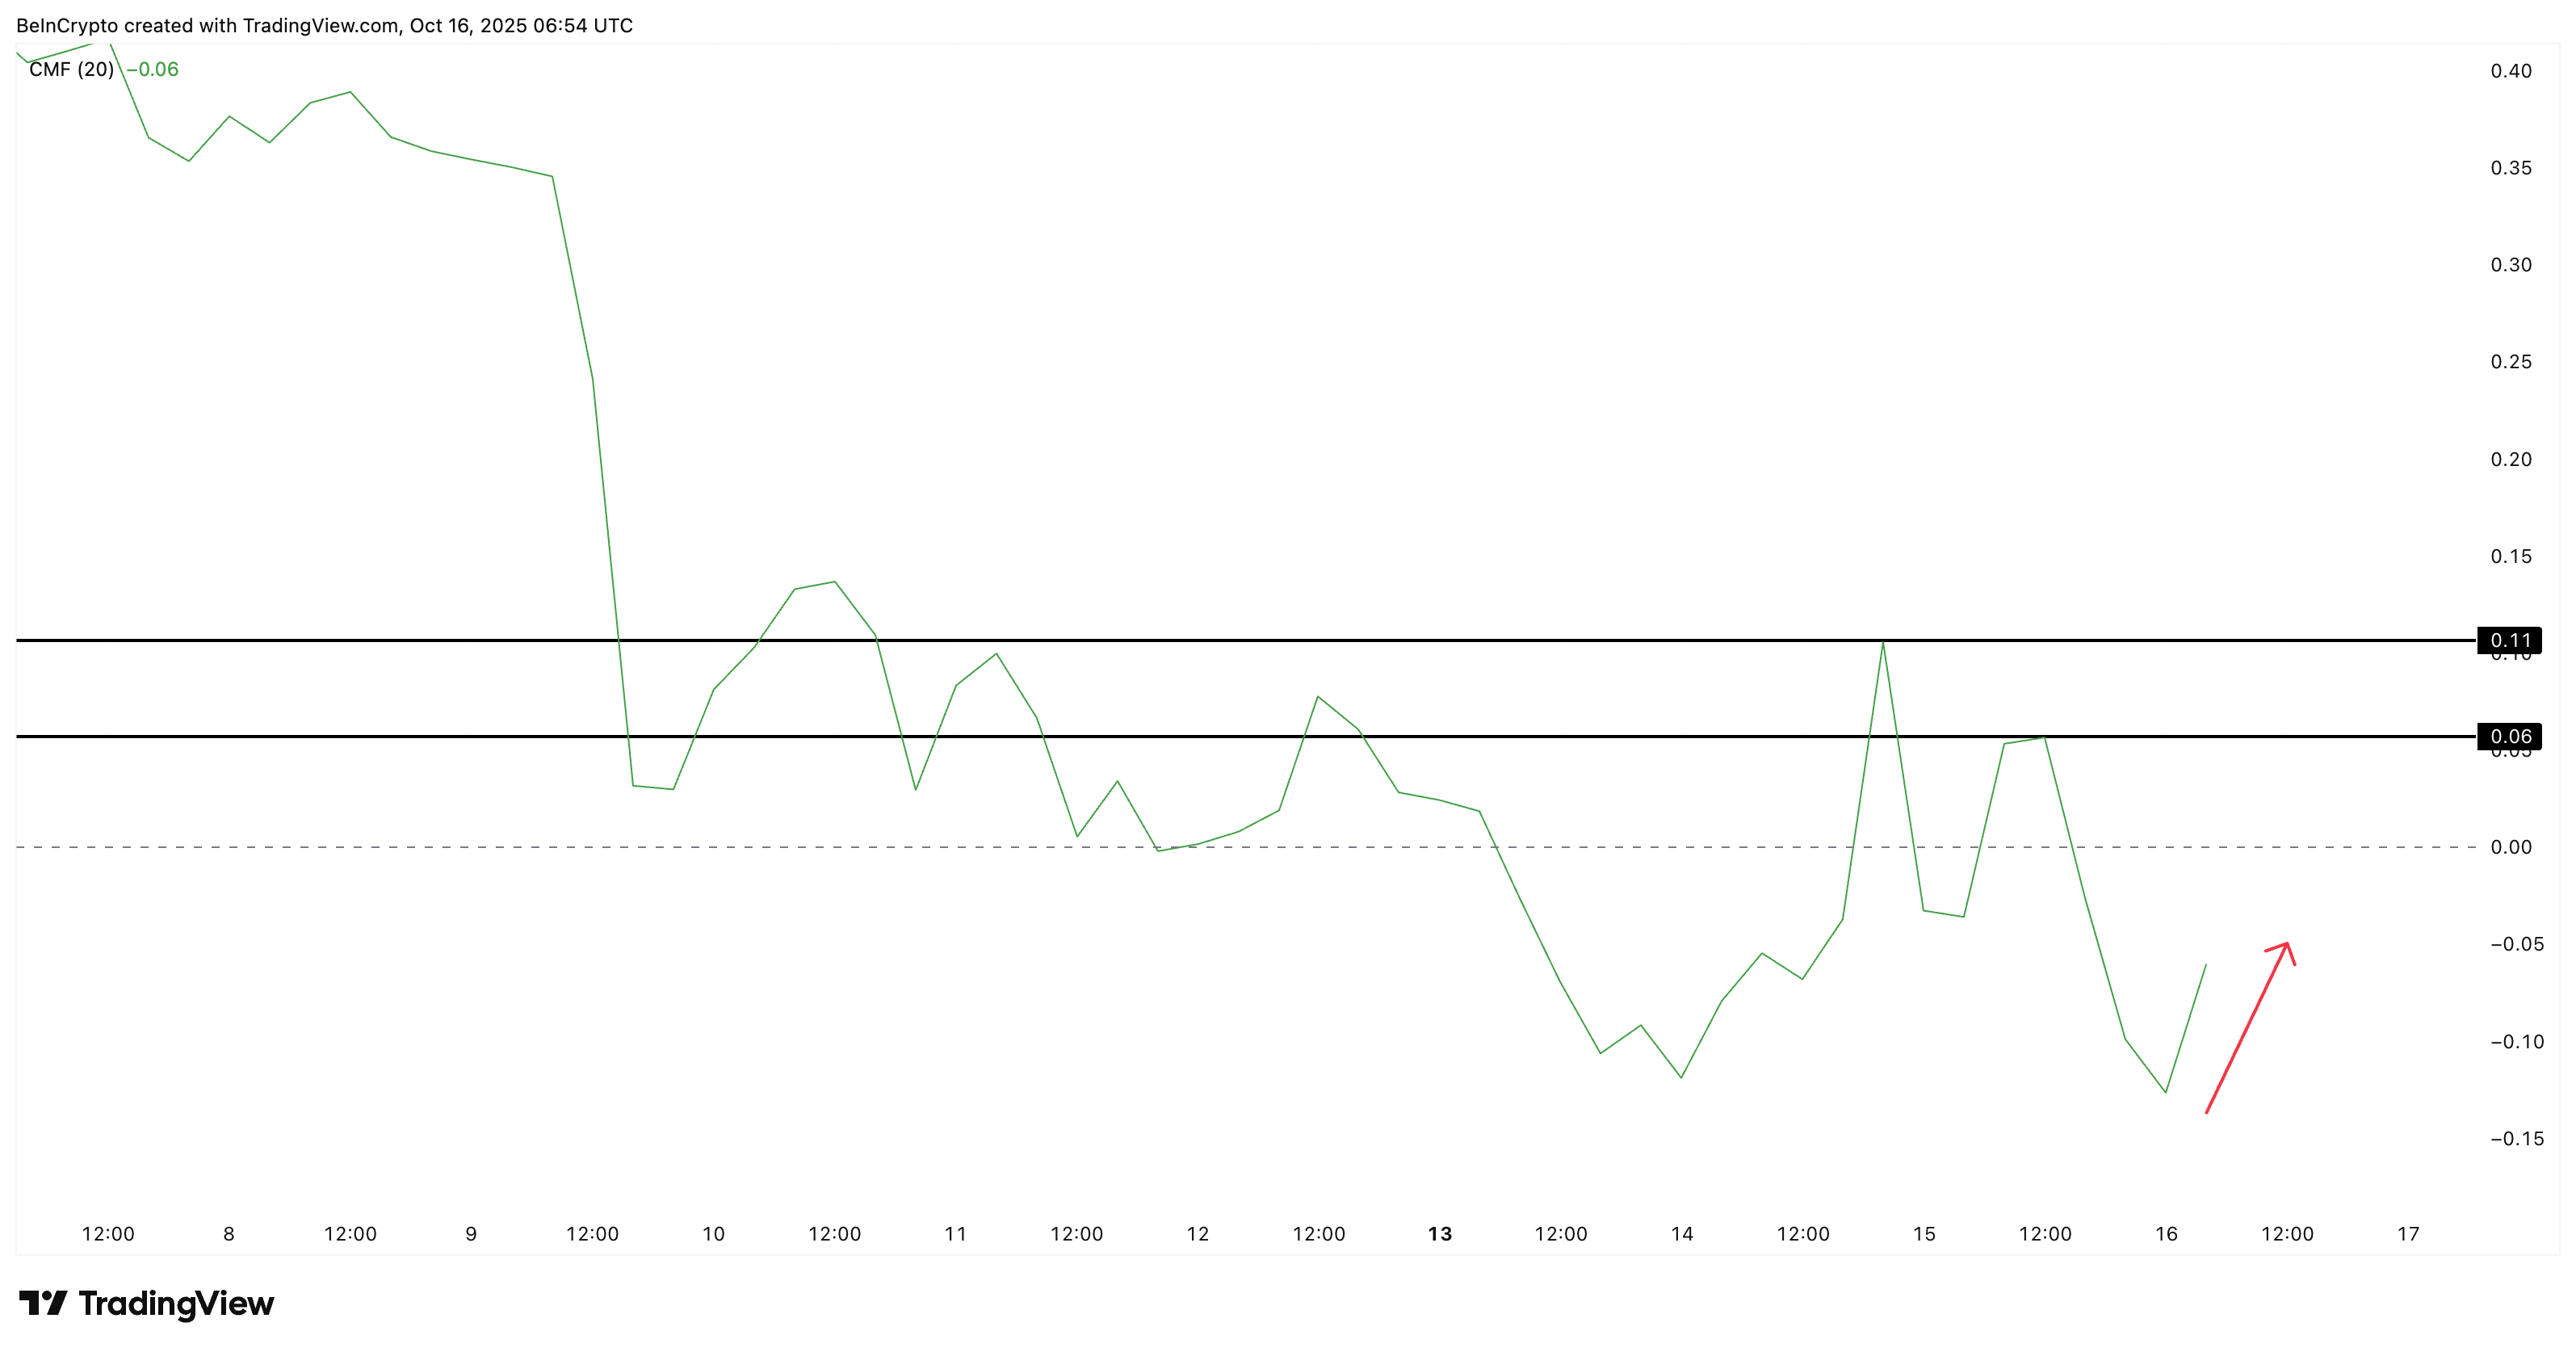
If CMF crosses above 0.06, it WOULD confirm renewed accumulation, while a move toward 0.11 would mark strong inflows and higher whale confidence.
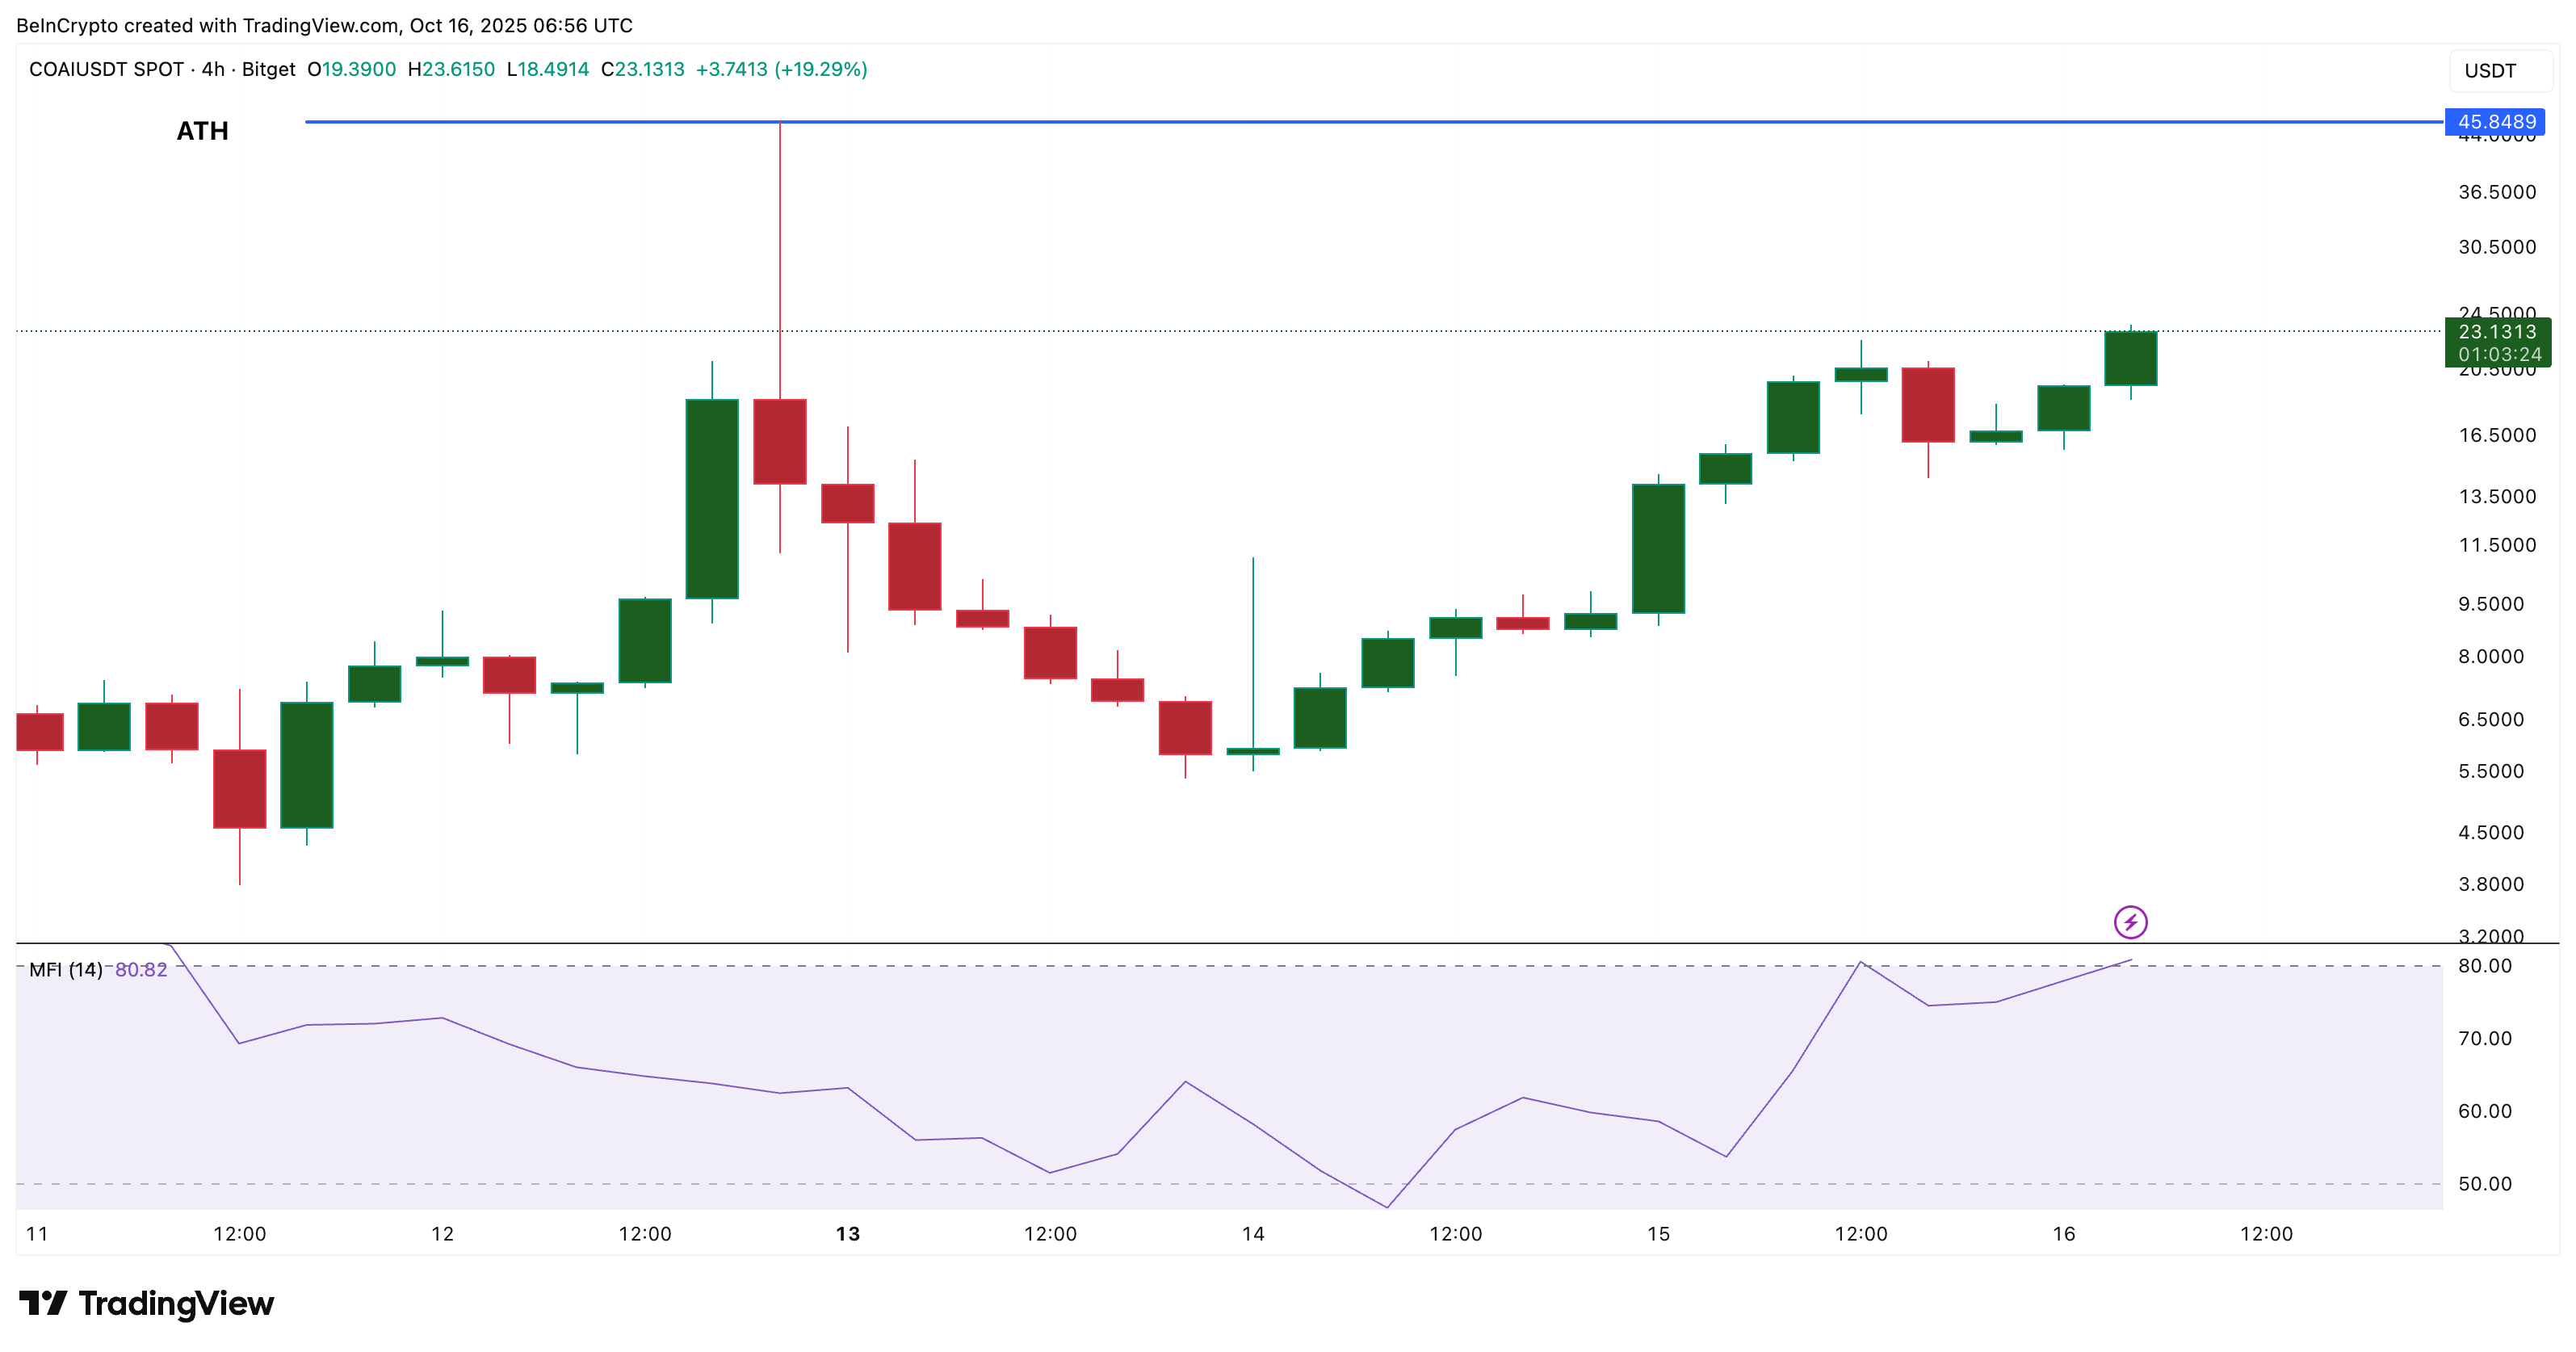
The Money Flow Index (MFI), which measures buying pressure using both price and volume, has climbed steadily since October 14. It indicates active retail participation, but the pattern shows they’re mostly buying strength instead of dips. Every time the COAI price has dipped, MFI has also dipped, indicating a lack of dip-buying money. This pattern might signal a slightly weaker conviction.
Meanwhile, the Relative Strength Index (RSI) — which gauges the pace and intensity of price movement — reveals the only key risk. Although COAI’s price made higher highs, RSI has formed a lower high, a bearish divergence that points to slowing momentum.
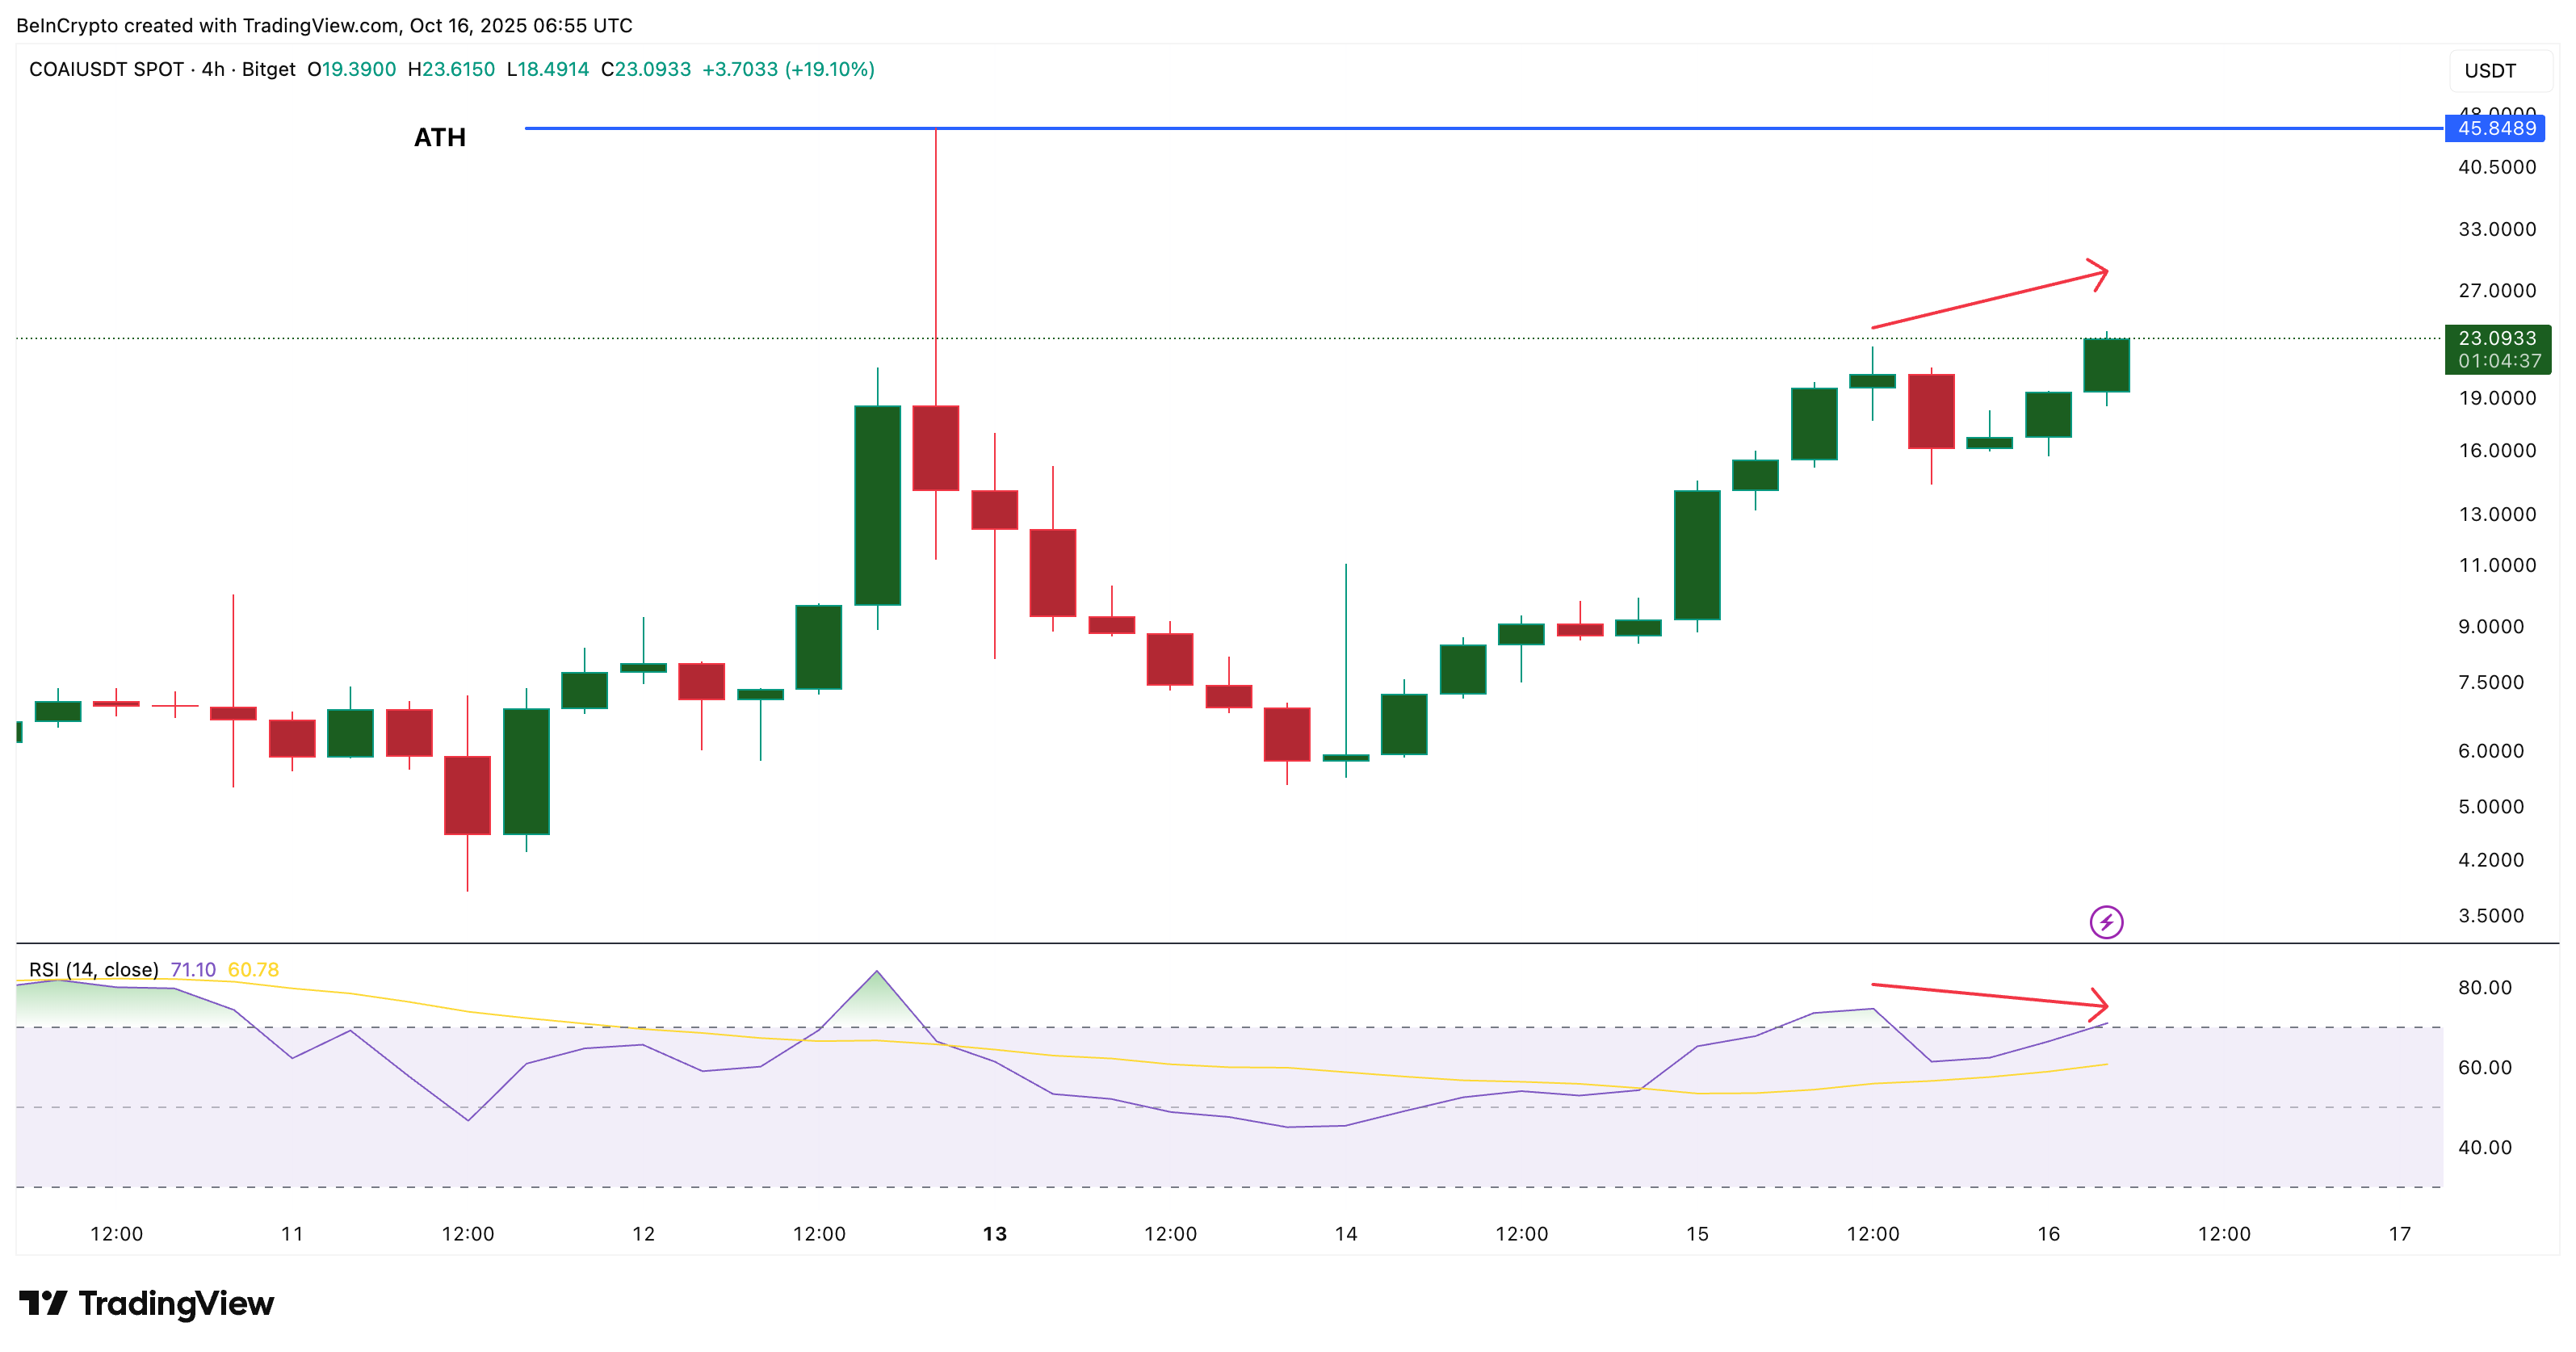
This may lead to a brief correction before the uptrend resumes. And with MFI not rising during dips, the support levels halting a correction might not be as strong for ChainOpera (COAI).
Key Levels That Could Decide Next COAI Price Move
COAI currently trades NEAR $23, right above its breakout zone. The next resistance levels sit at $26, $31, and $38. A daily close above $31 would confirm a continuation pattern, opening the COAI price target path to a retest of the previous all-time high near $45. If that level is breached, COAI could set a new record near $47, per the Fibonacci extension target projection.
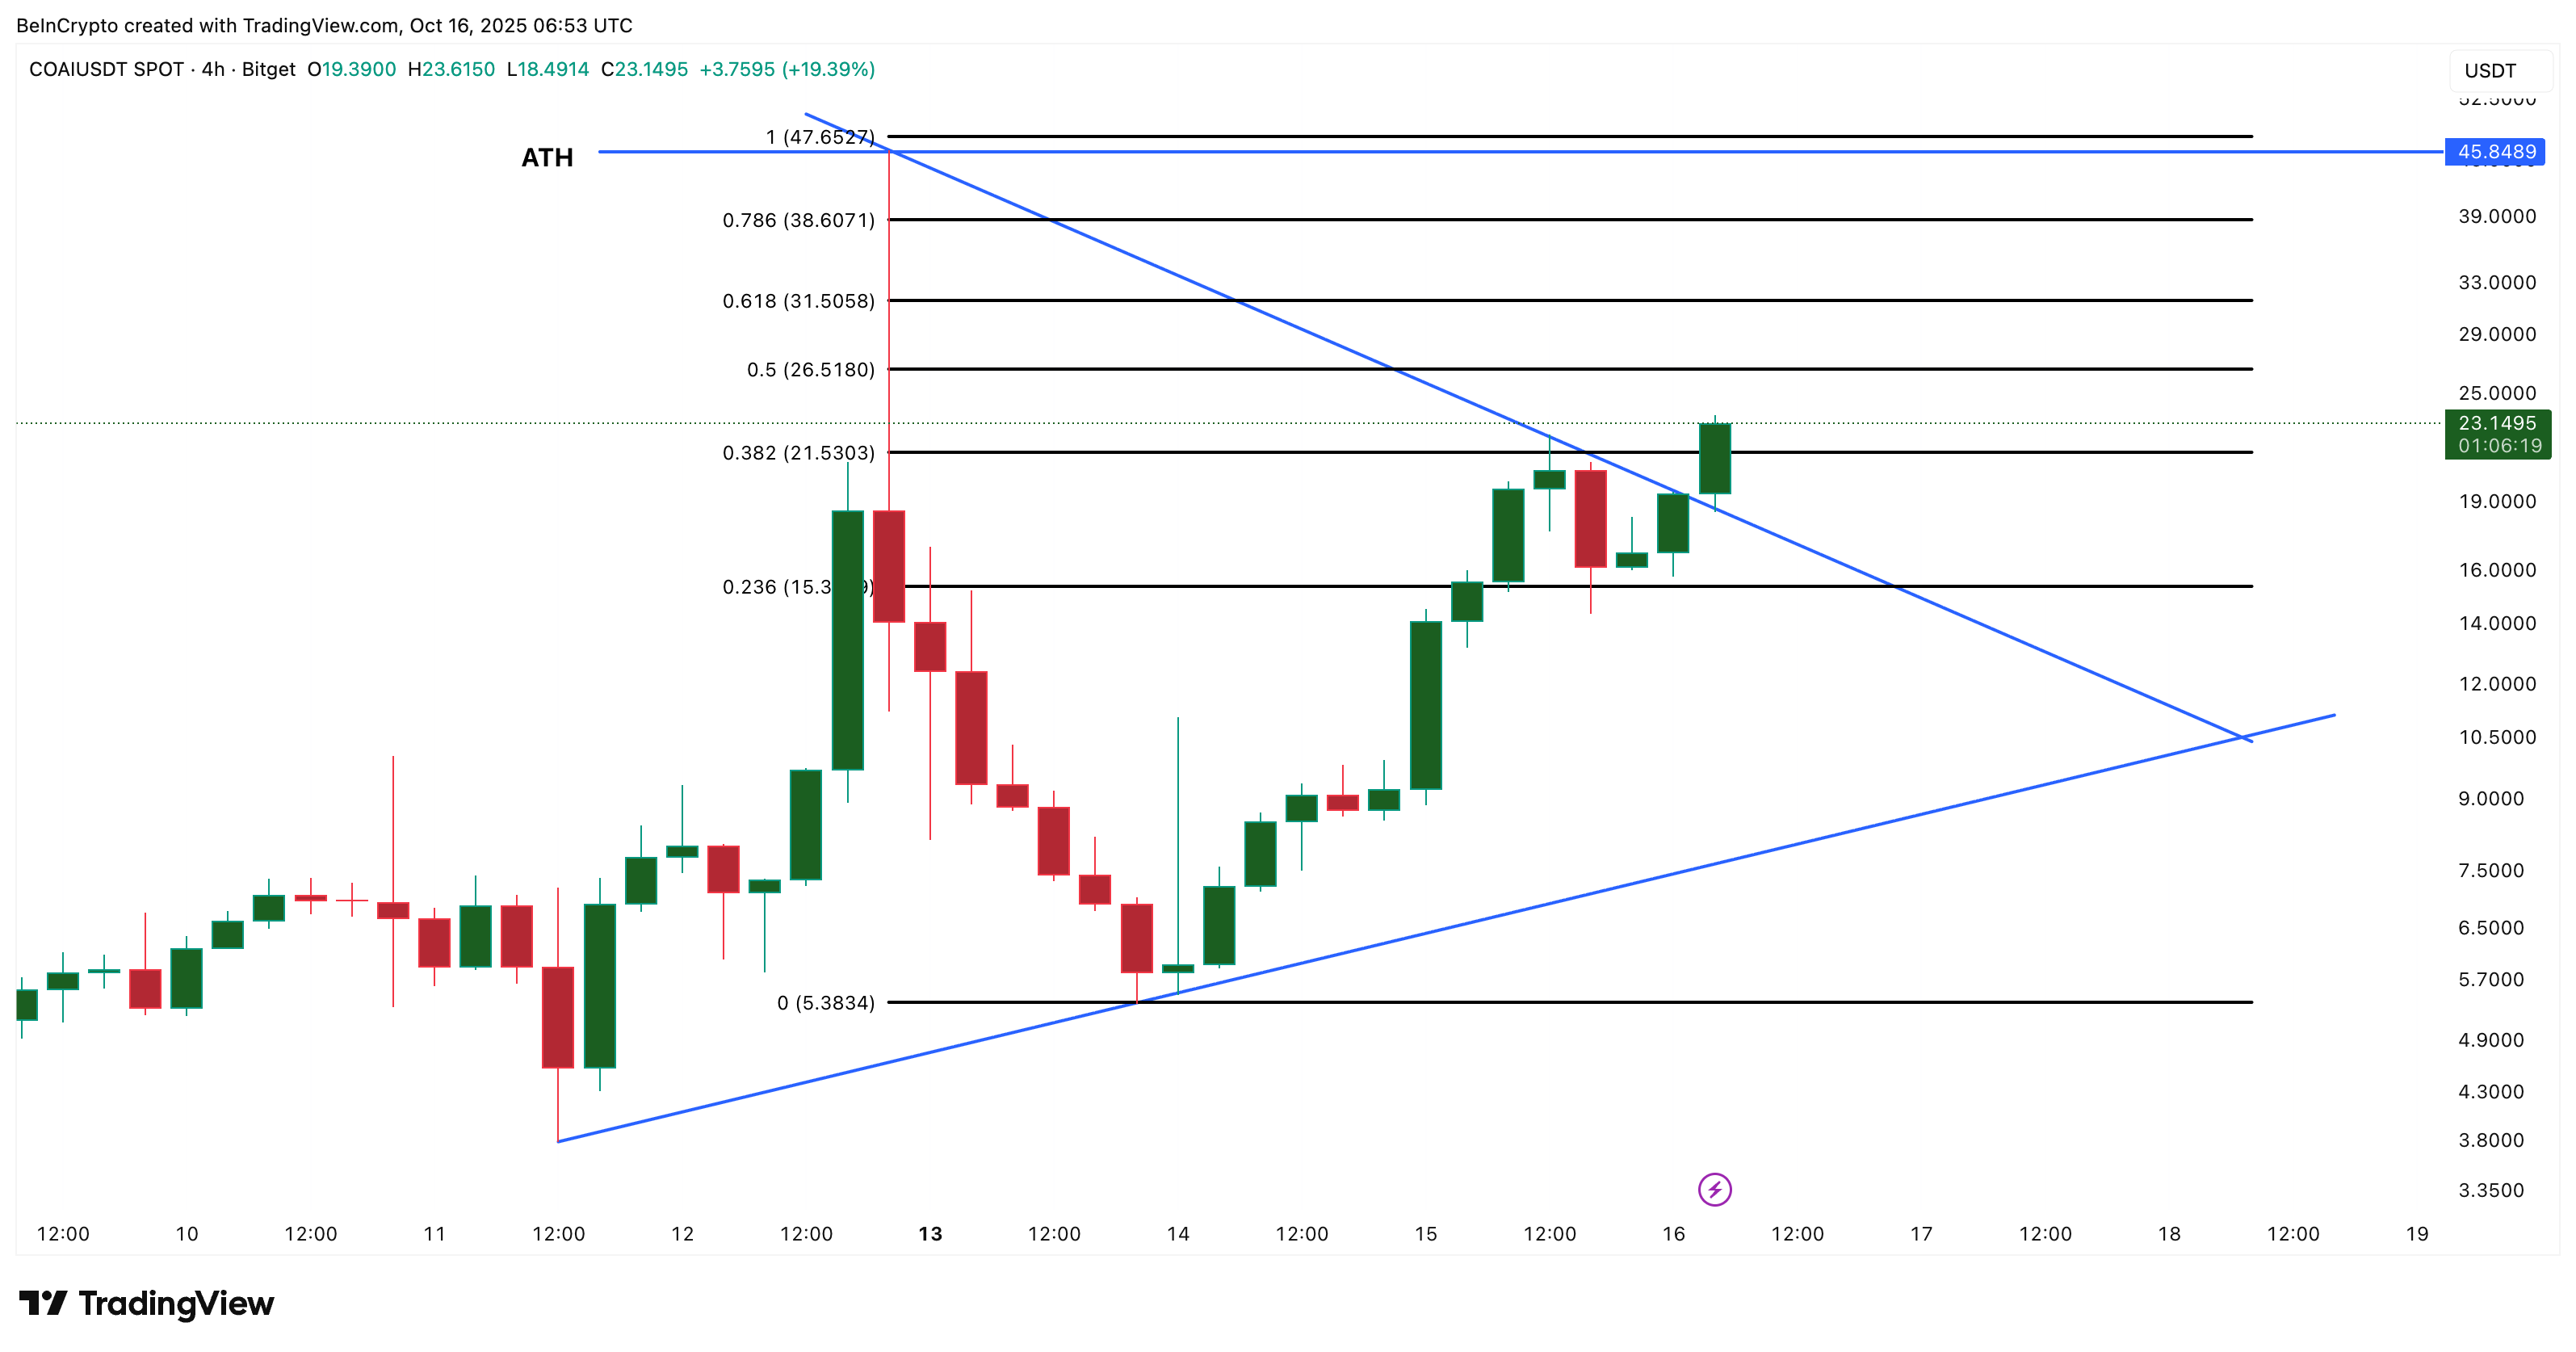
However, if RSI weakness triggers a pullback, supports lie near $21 and $15. These levels will decide whether the breakout holds or fails. A rebound from them would suggest buyers still control the structure of this AI-focused token, but a fall below $15 would risk undoing the recent gains.
For now, COAI’s setup remains bullish: the triangle breakout is valid and buying activity is improving. Still, traders should stay alert — the momentum loss shown by RSI could pause the rally before another attempt at new highs.
