HBAR Plummets to 2-Month Low as Traders Position for Further Downside

HBAR hits lowest level since July as bearish momentum accelerates.
Market Analysis: Technical breakdown triggers wave of short positions.
Trading desks report increased put option activity targeting lower support levels.
Volume spikes 40% on the sell-off—classic capitulation pattern emerging.
Institutional wallets show modest accumulation despite retail panic.
Another reminder that in crypto, 'buy the dip' only works until the dip buys you.
Traders Abandon HBAR, Fueling Risks of Deeper Declines
HBAR currently trades at $0.2077, down 15% in the past seven days. This double-digit price dip has dampened sentiment across the token’s derivatives market, reflected by its plummeting futures open interest. According to Coinglass data, this sits at $350 million as of this writing, falling 26% since September 13.
: Want more token insights like this? Sign up for Editor Harsh Notariya’s Daily crypto Newsletter here.
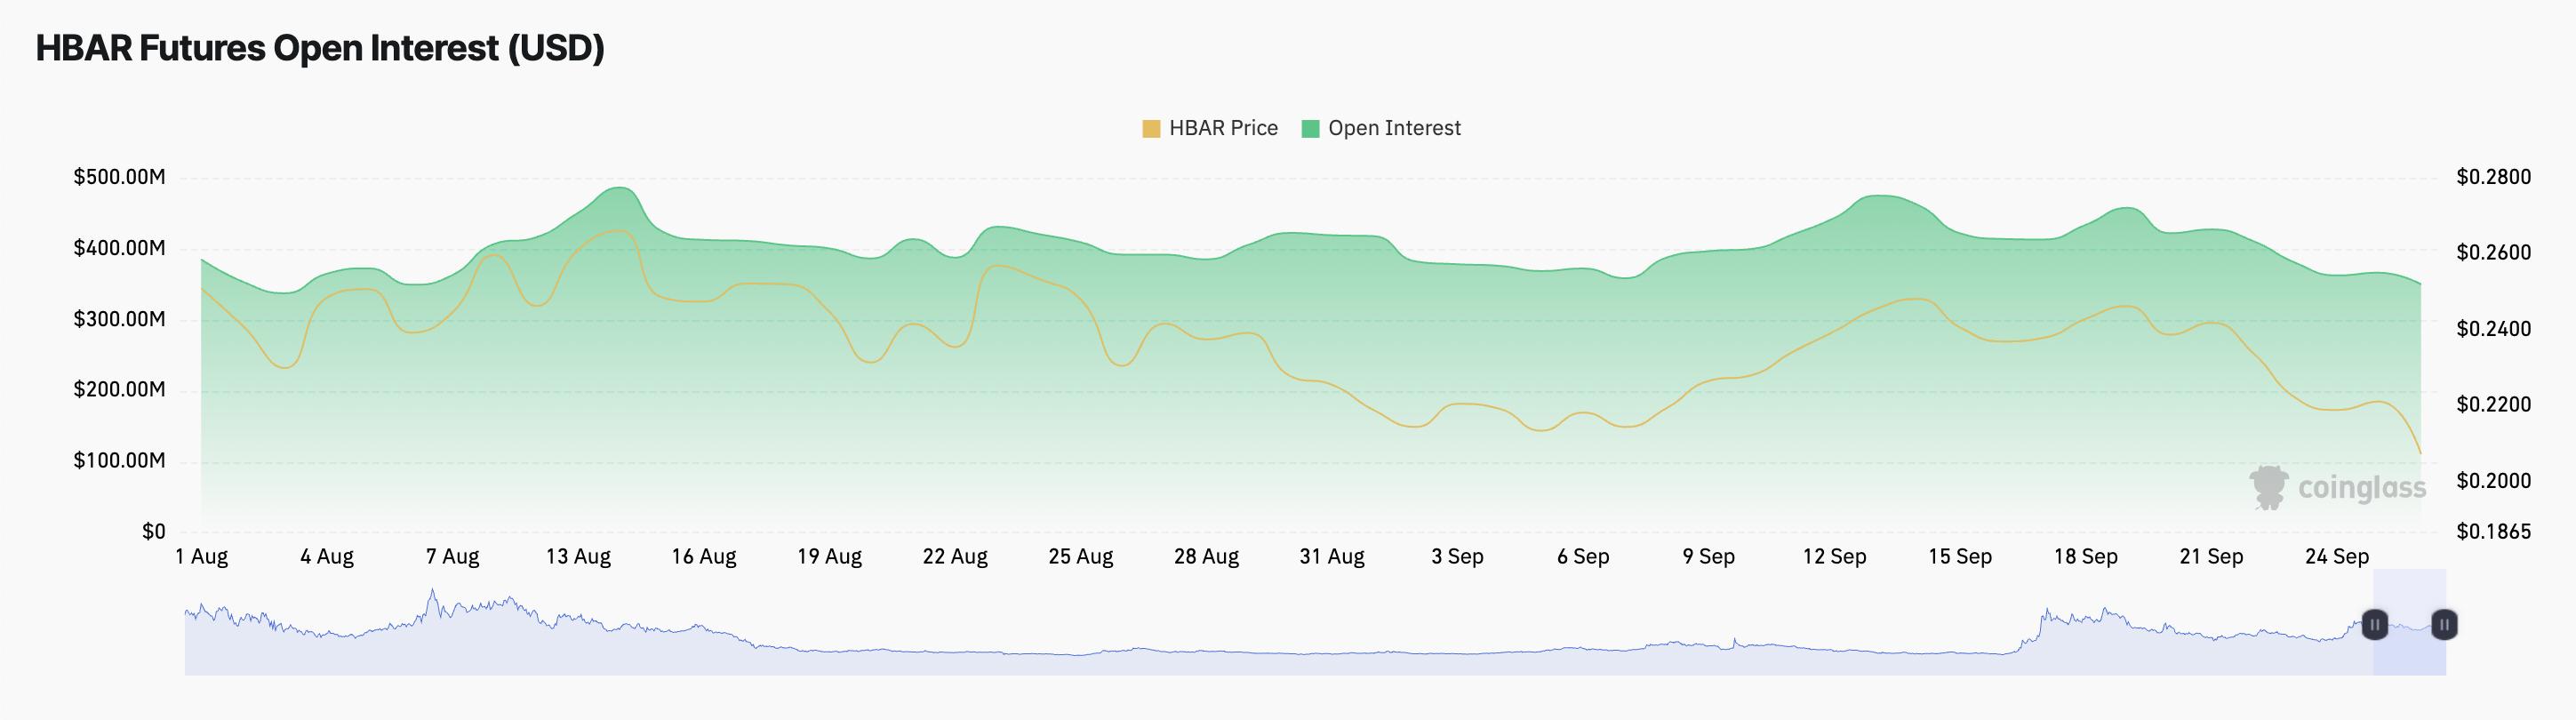
Open interest measures the total number of outstanding futures or options contracts that have not yet been settled. When this figure rises, it signals fresh capital and trader participation flowing into the market.
Conversely, a sharp decline—especially during a price dip like this— suggests that traders are closing positions and withdrawing liquidity from the asset. If the exodus continues, the lack of liquidity could worsen volatility and expose HBAR to more downside moves.
Moreover, readings from HBAR’s Long/Short ratio show it leaning heavily toward shorts, indicating that traders are increasingly betting against HBAR. As of this writing, this stands at 0.86.
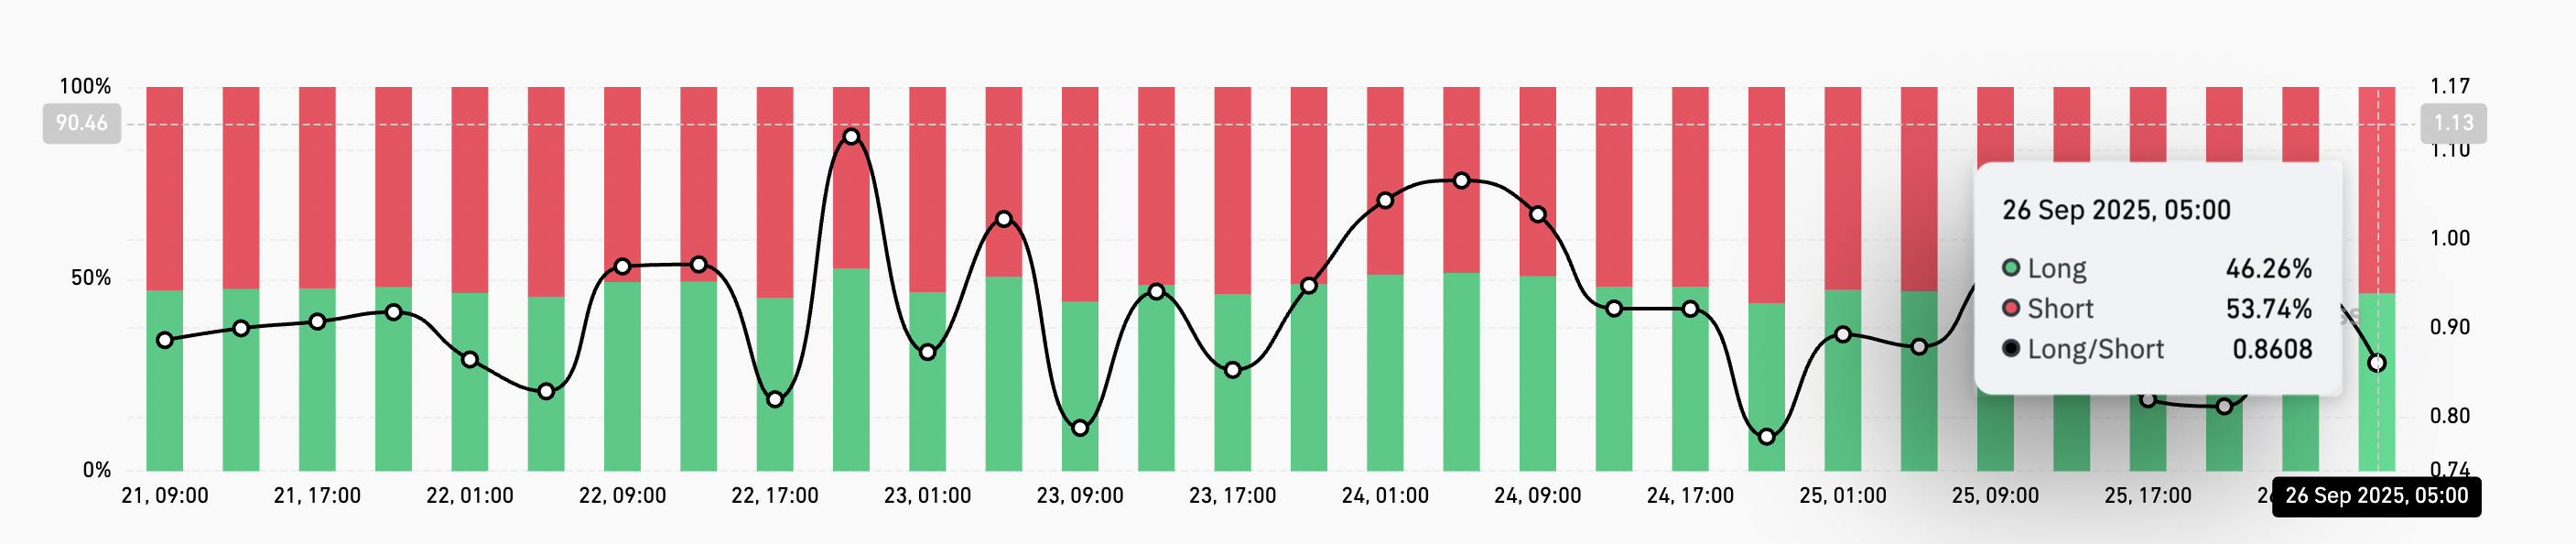
The long/short ratio measures the proportion of long bets to short ones in an asset’s futures market. A ratio above one signals more long positions than short ones. This indicates a bullish sentiment, with most traders expecting the asset’s value to rise.
However, as with HBAR, a ratio under means there are more short than long positions in the market. This signals strong bearish sentiment as futures traders continue to bet on further price declines.
HBAR Weakens Under 20-Day EMA—Can Bulls Reclaim $0.2212?
On the daily chart, HBAR trades significantly below its 20-day exponential moving average, confirming the breakdown of the bullish structure in its spot markets. As of this writing, this key moving average forms dynamic resistance above HBAR’s price at $0.2281.
The 20-day EMA measures an asset’s average price over the past 20 trading days, giving more weight to recent prices. When an asset trades above the 20-day EMA, it signals bullish momentum, with buyers maintaining control and the moving average acting as support during pullbacks.
Conversely, when the price slips below the EMA, it reflects weakening demand, with the indicator flipping into resistance and sellers dictating market direction. This puts HBAR at risk of a decline toward $0.1788.
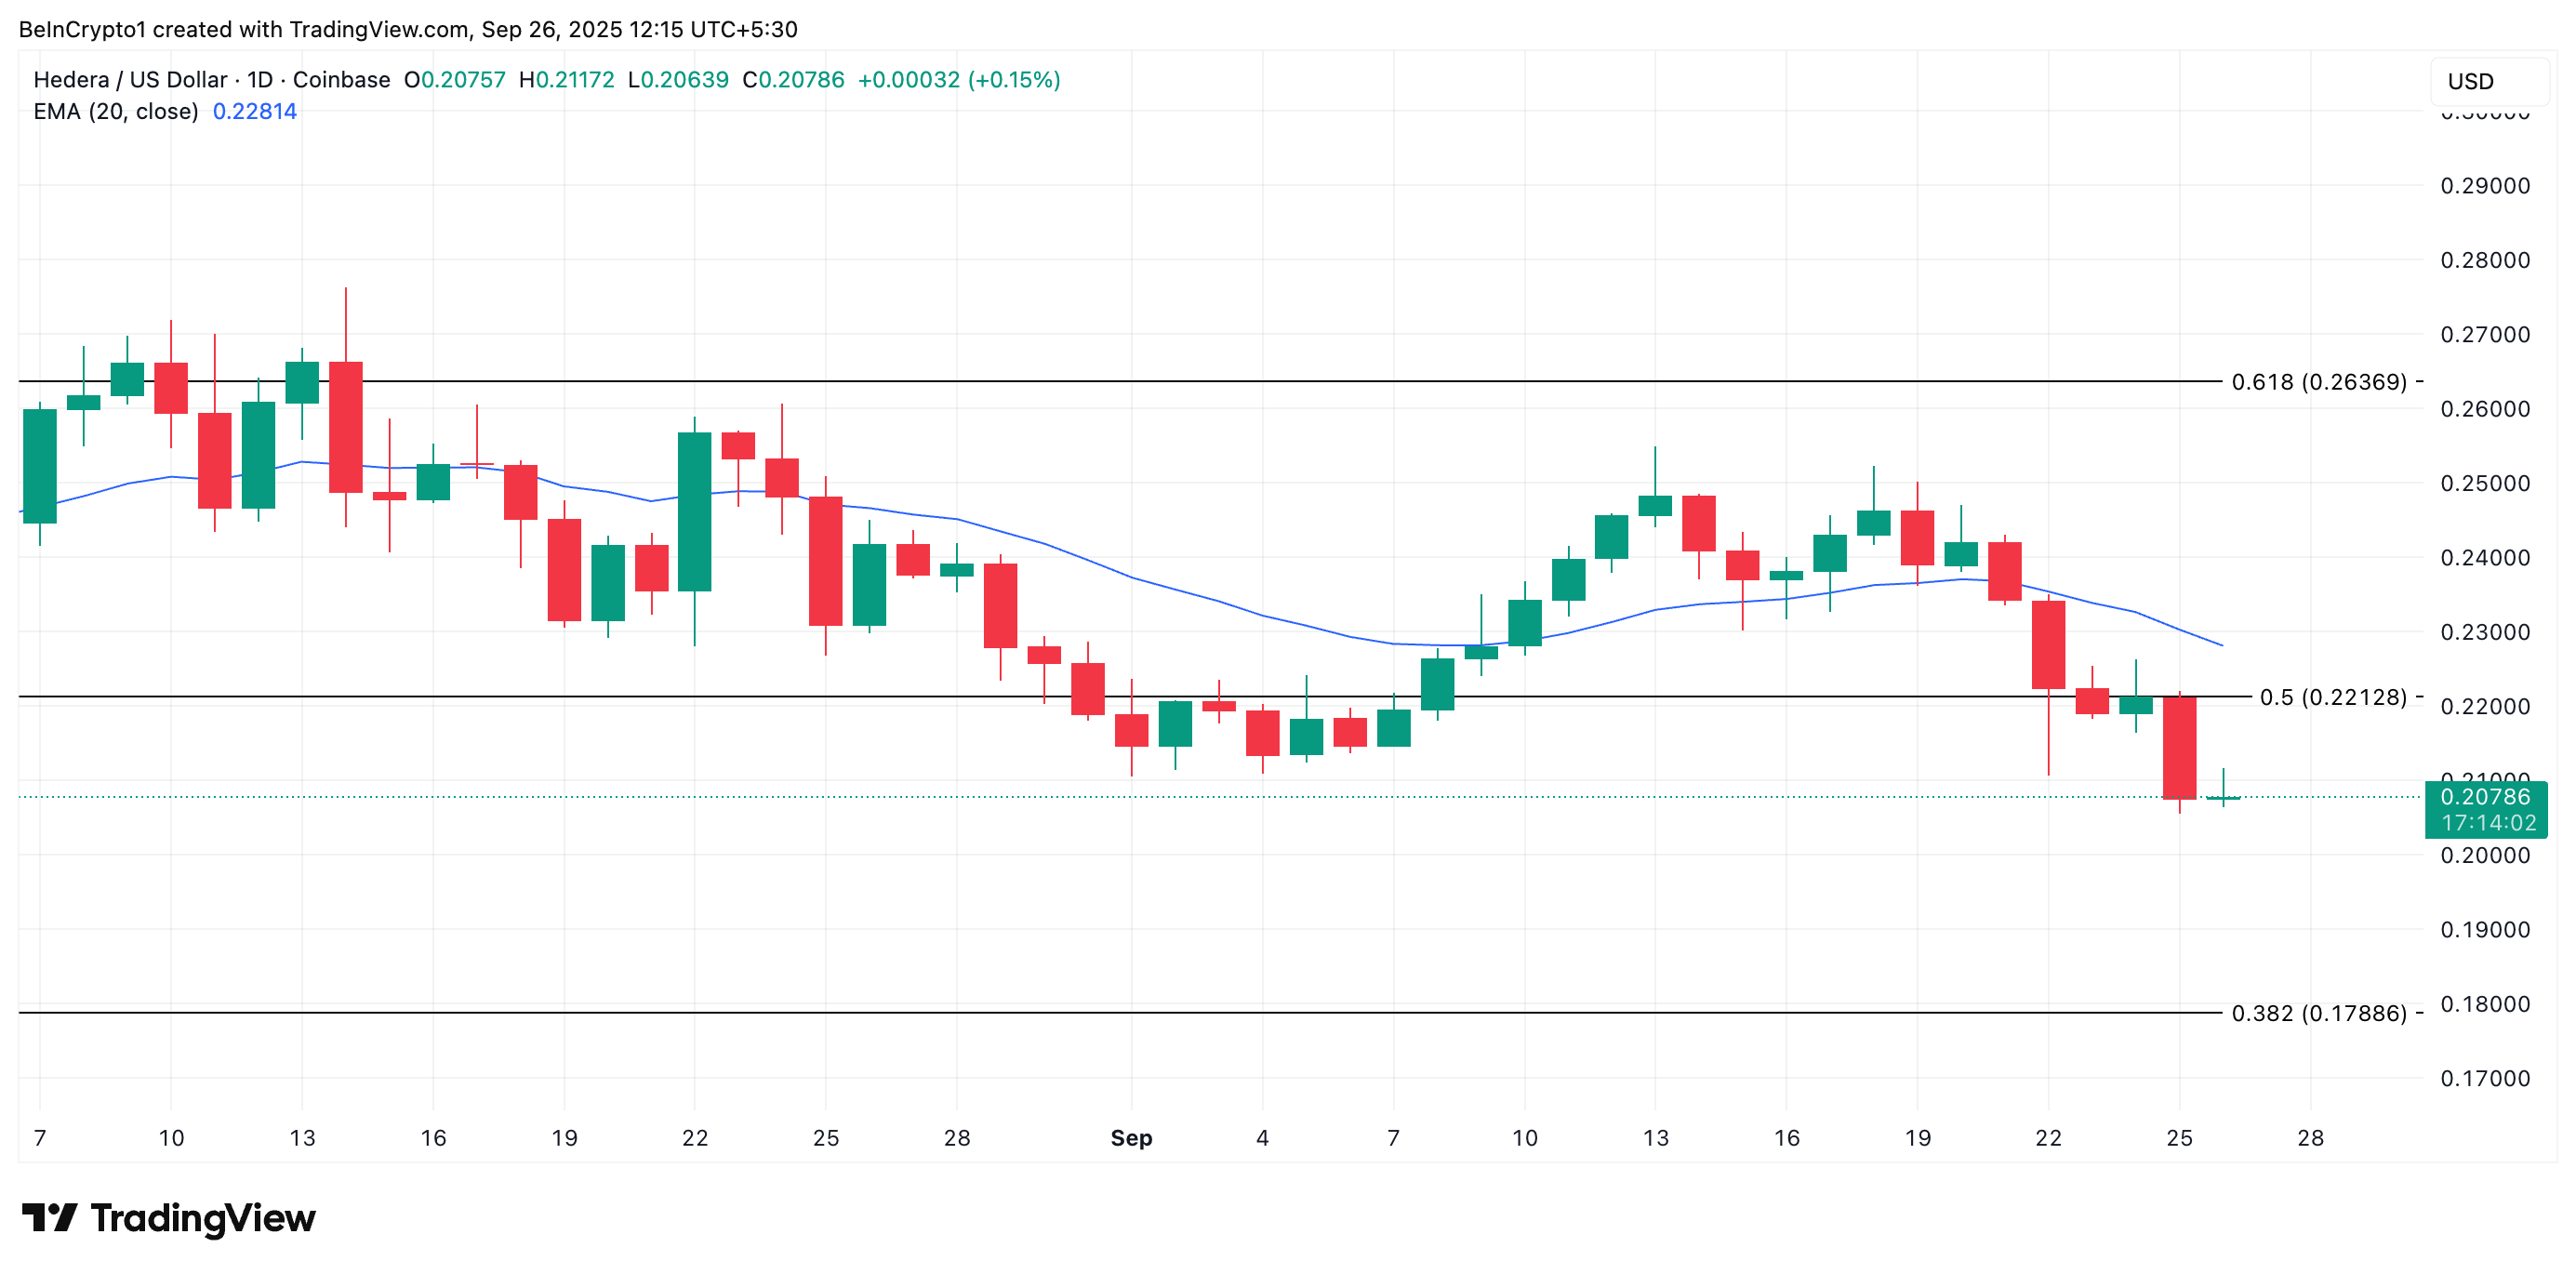
On the other hand, an uptick in new demand for HBAR could push its price above $0.2212.
