BNB’s $1,000 Breakout: The Hidden Risks Behind the Rally

BNB smashes through $1,000 barrier—but seasoned traders spot trouble brewing beneath the surface.
Volume vs. Velocity
Trading volume fails to match the price surge—a classic red flag that's got analysts questioning the breakout's sustainability. The token's parabolic move looks more like speculative frenzy than organic growth.
Regulatory Shadows Loom
Binance's ongoing regulatory battles worldwide cast a long shadow over BNB's prospects. Legal uncertainties could trigger sudden selloffs that wipe out gains faster than a crypto bro's inheritance.
Ecosystem Dependency
BNB's fate remains tethered to Binance's ecosystem strength—a dangerous single-point failure that makes traditional finance types chuckle into their bourbon. Because nothing says 'sound investment' like putting all your eggs in one centralized basket.
This $1,000 milestone might just be the bull trap that separates the believers from the bagholders.
What Drove BNB Chain to Multiple Records in September?
A wave of positive news played a major role in attracting fresh capital into BNB in September.
First, Franklin Templeton, one of the world’s largest investment funds, expanded its Benji Investments platform to BNB Chain. At the same time, BNB Chain witnessed a surge in on-chain activity, fueled by ultra-low transaction fees and record trading volumes.
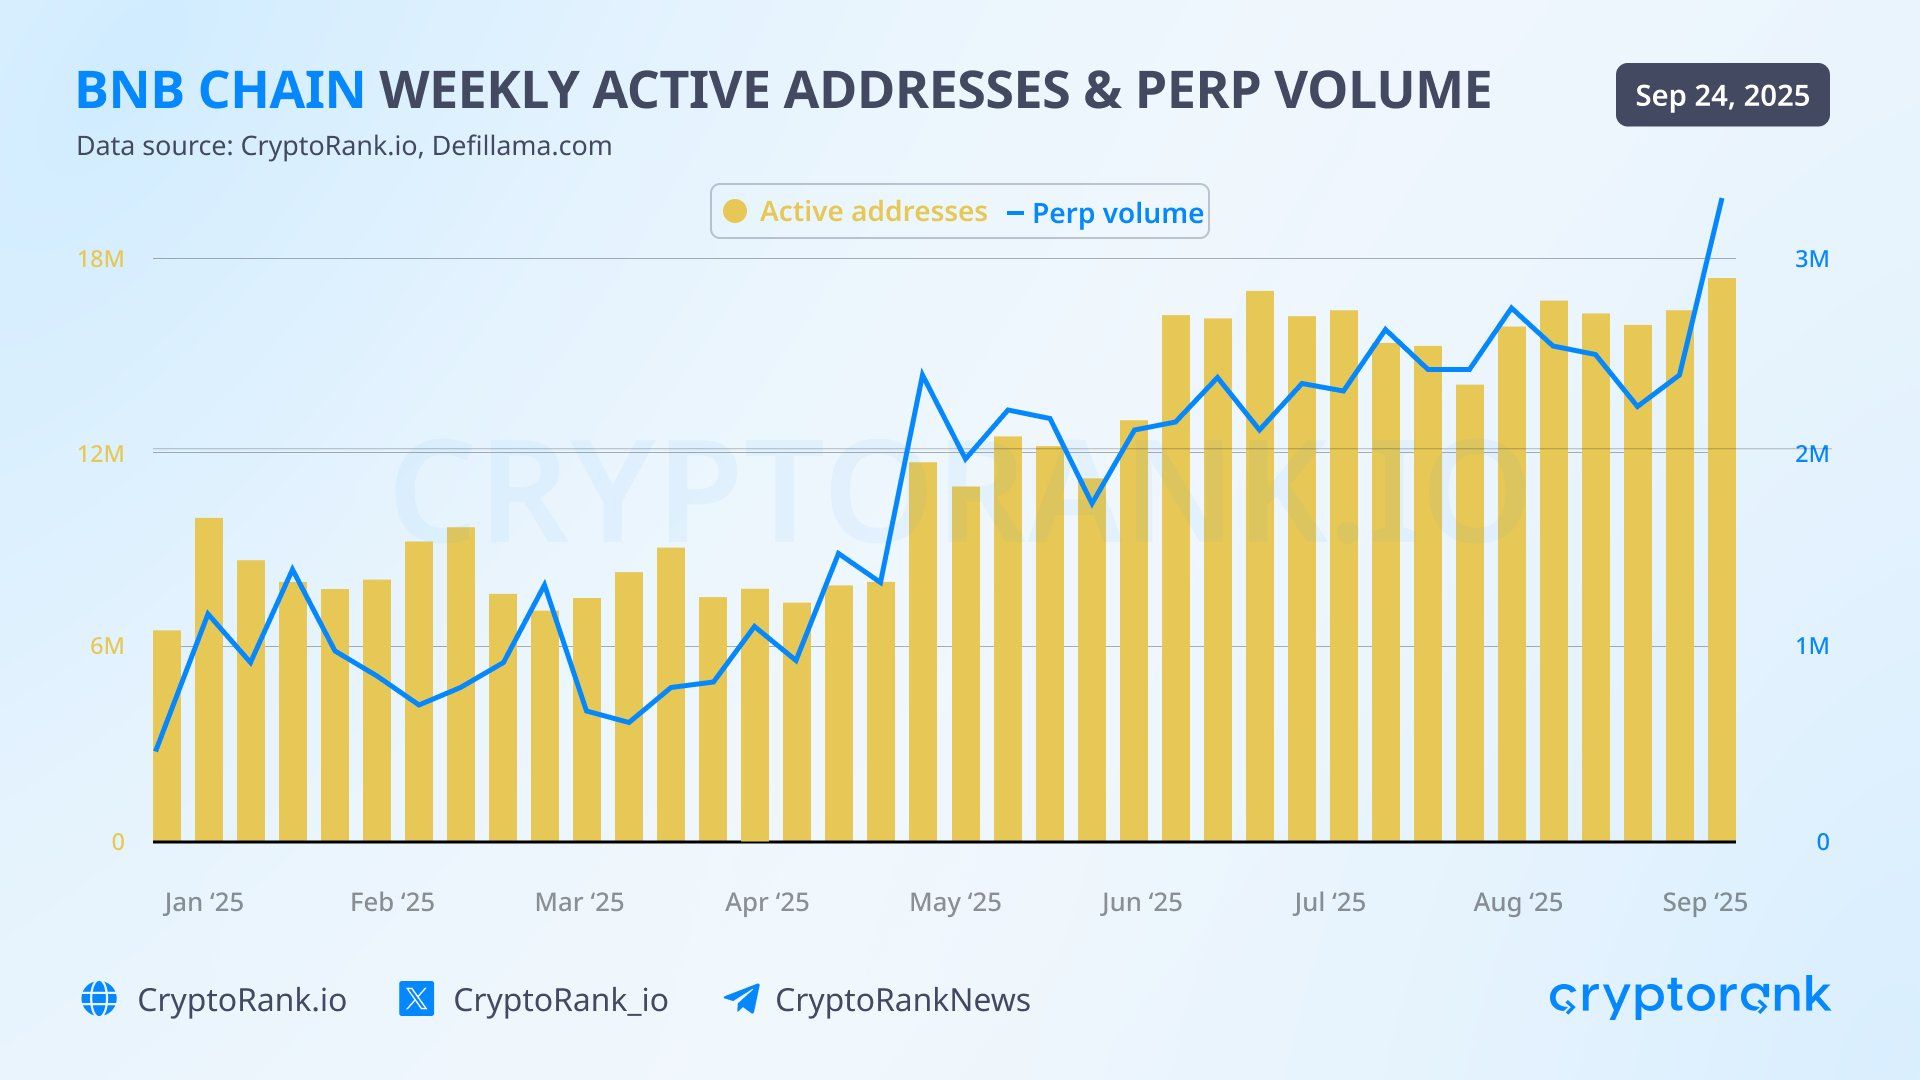
According to CryptoRank data, BNB Chain hit a weekly all-time high with 17.4 million active addresses and $3.32 billion in perpetuals volume, boosted by traders flocking to Aster DEX. Other metrics also soared, including weekly transactions exceeding 100 million and daily fees reaching $1 million.
Currently, BNB trades close to the $1,000 level, with the rally showing signs of stalling in the final week of September.
BNB Enters Overheated Territory, Raising Correction Concerns
Despite the strong outlook, signals indicate an “overheated” market, mainly driven by FOMO (fear of missing out).
CryptoQuant’s Spot Volume Bubble Map shows a trend of moving into the overheating stage. The size of each bubble represents trading volume, while the color reflects the rate of change in volume.
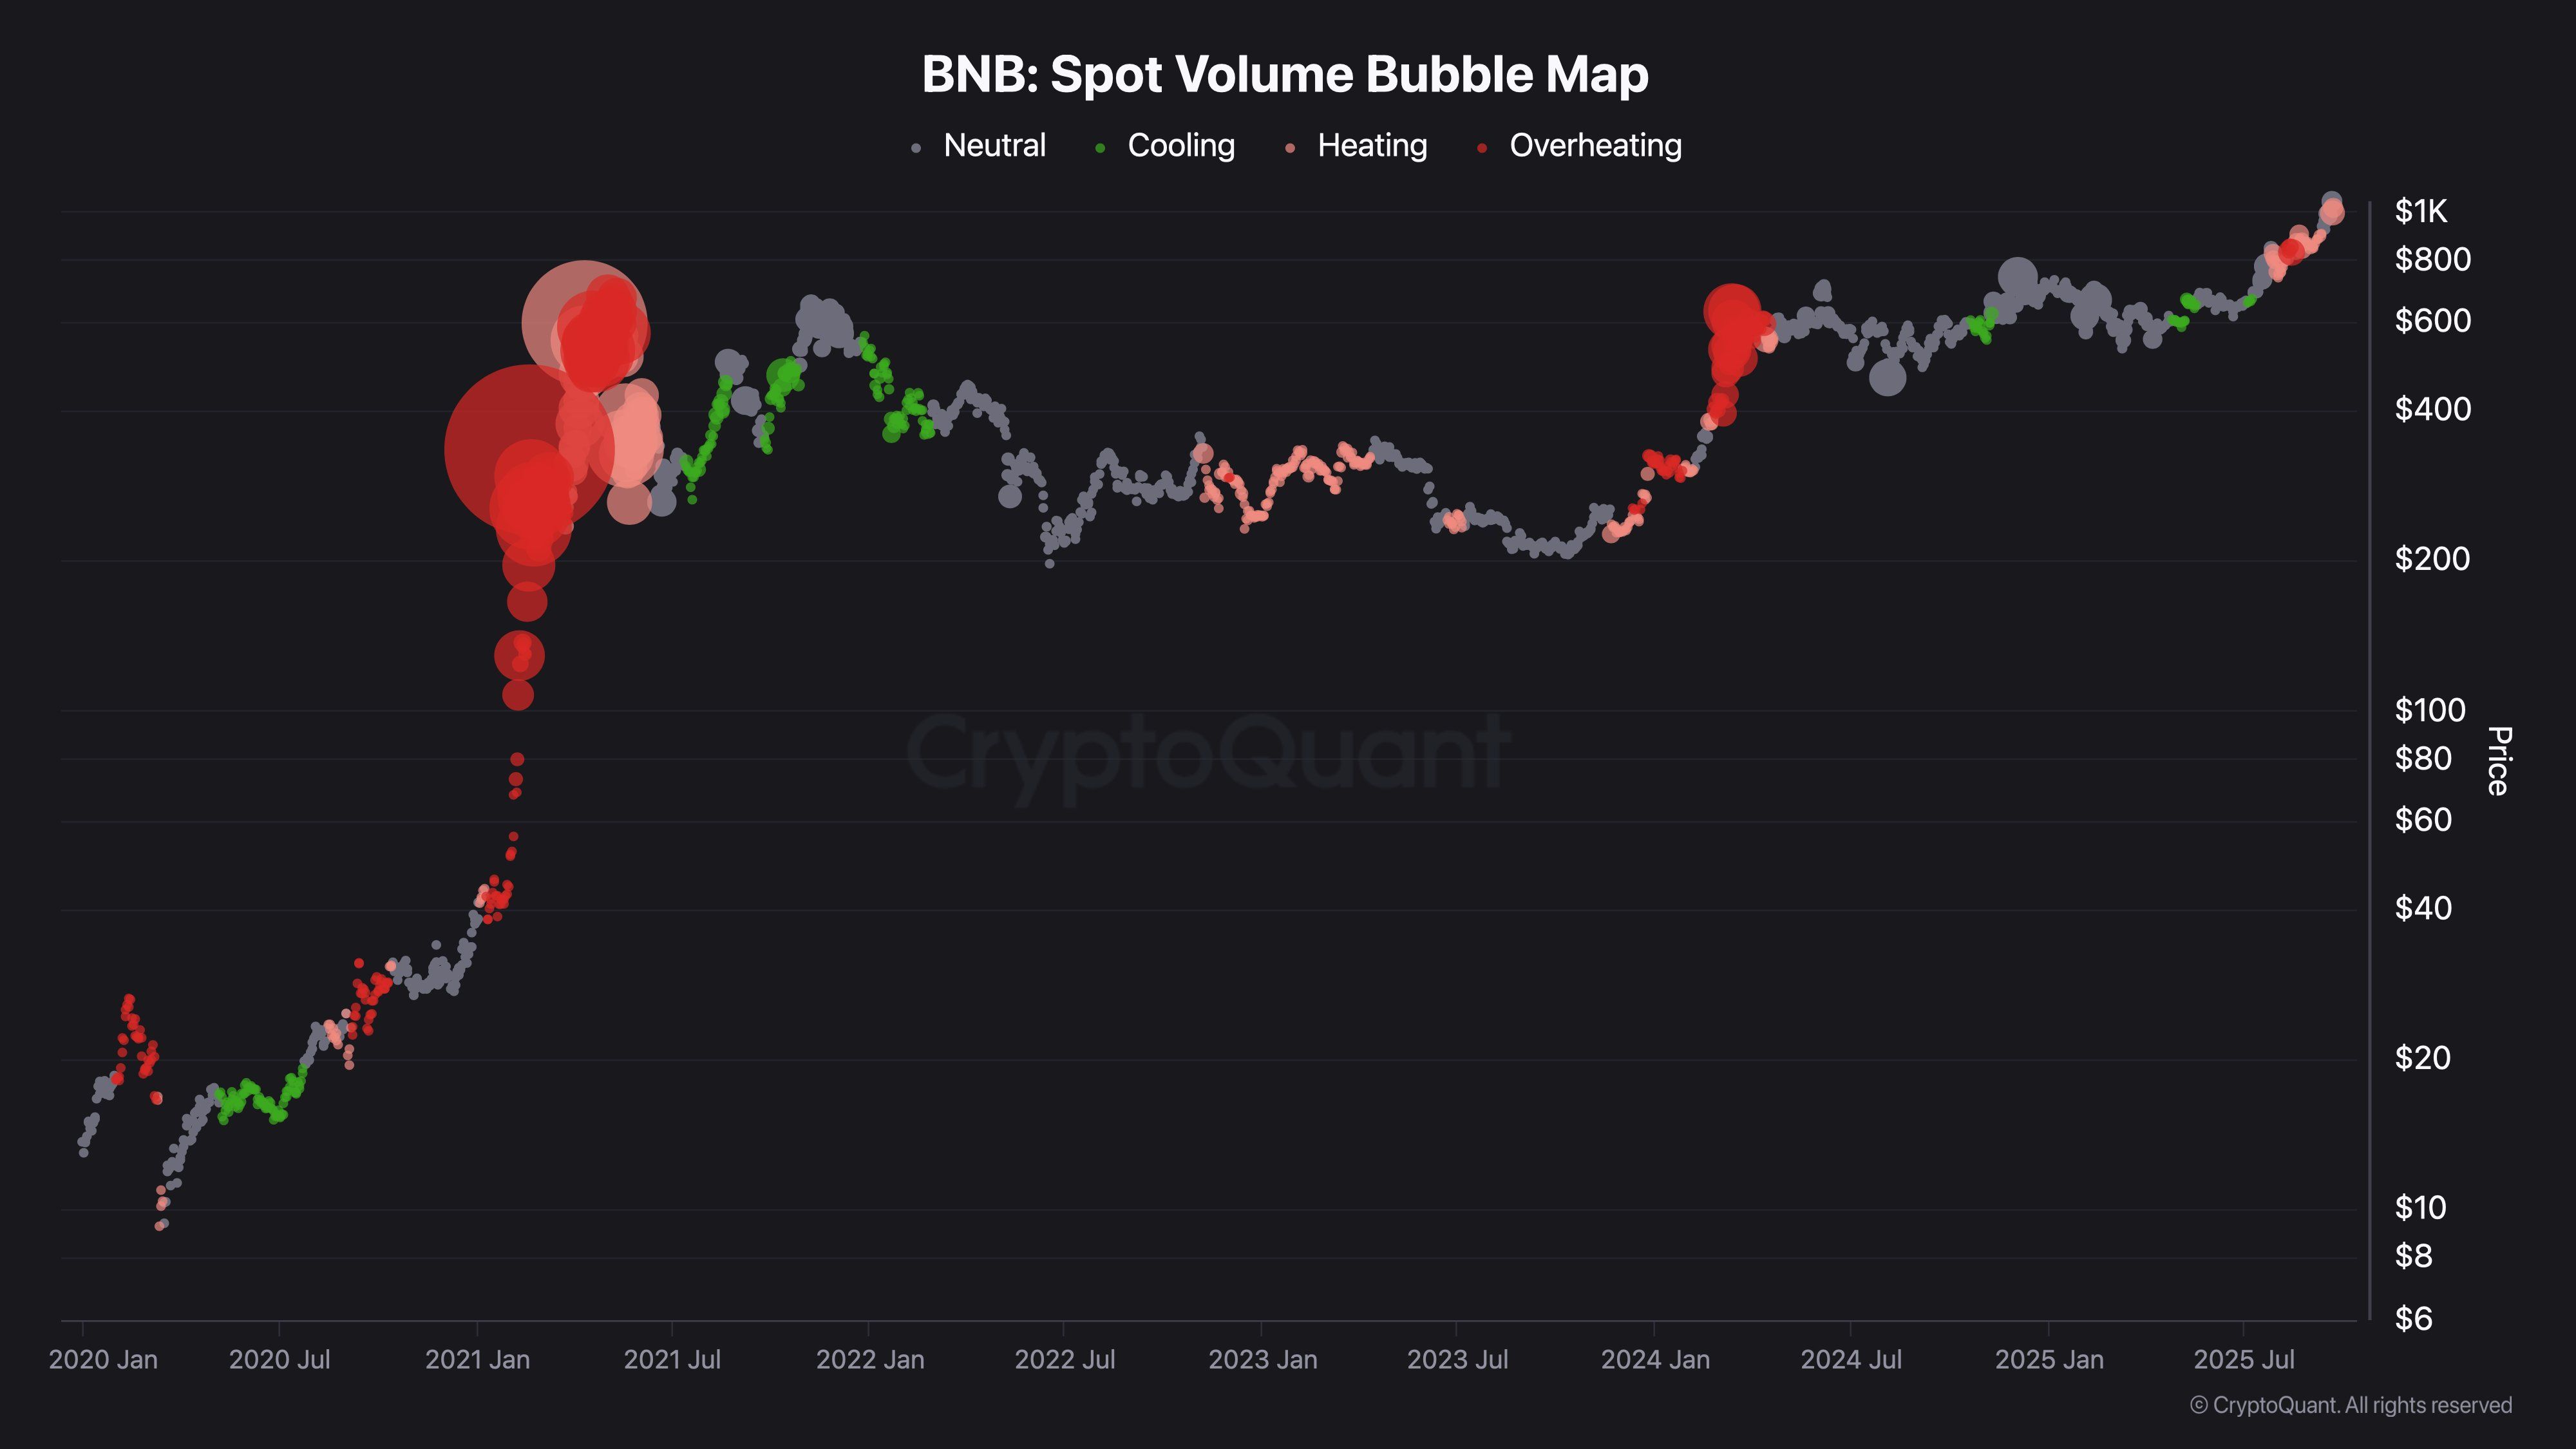
CryptoQuant explained that in the later stages of a bull market, when trading volume remains high but price performance weakens, the asset may enter its Distribution Phase.
“However, trading indicators reflecting spot volume suggest that the trend may now have entered an overheated zone. This surge in trading activity, fueled by FOMO, can sometimes prove risky in the short term, making the price rally more fragile and vulnerable to sharp corrections,” analyst Darkfost commented.
In addition, Santiment’s Positive Sentiment data shows trader enthusiasm has dropped. The chart reveals that the BNB price (green line) surged past $1,080 last week, while the positive sentiment (red line) plummeted.
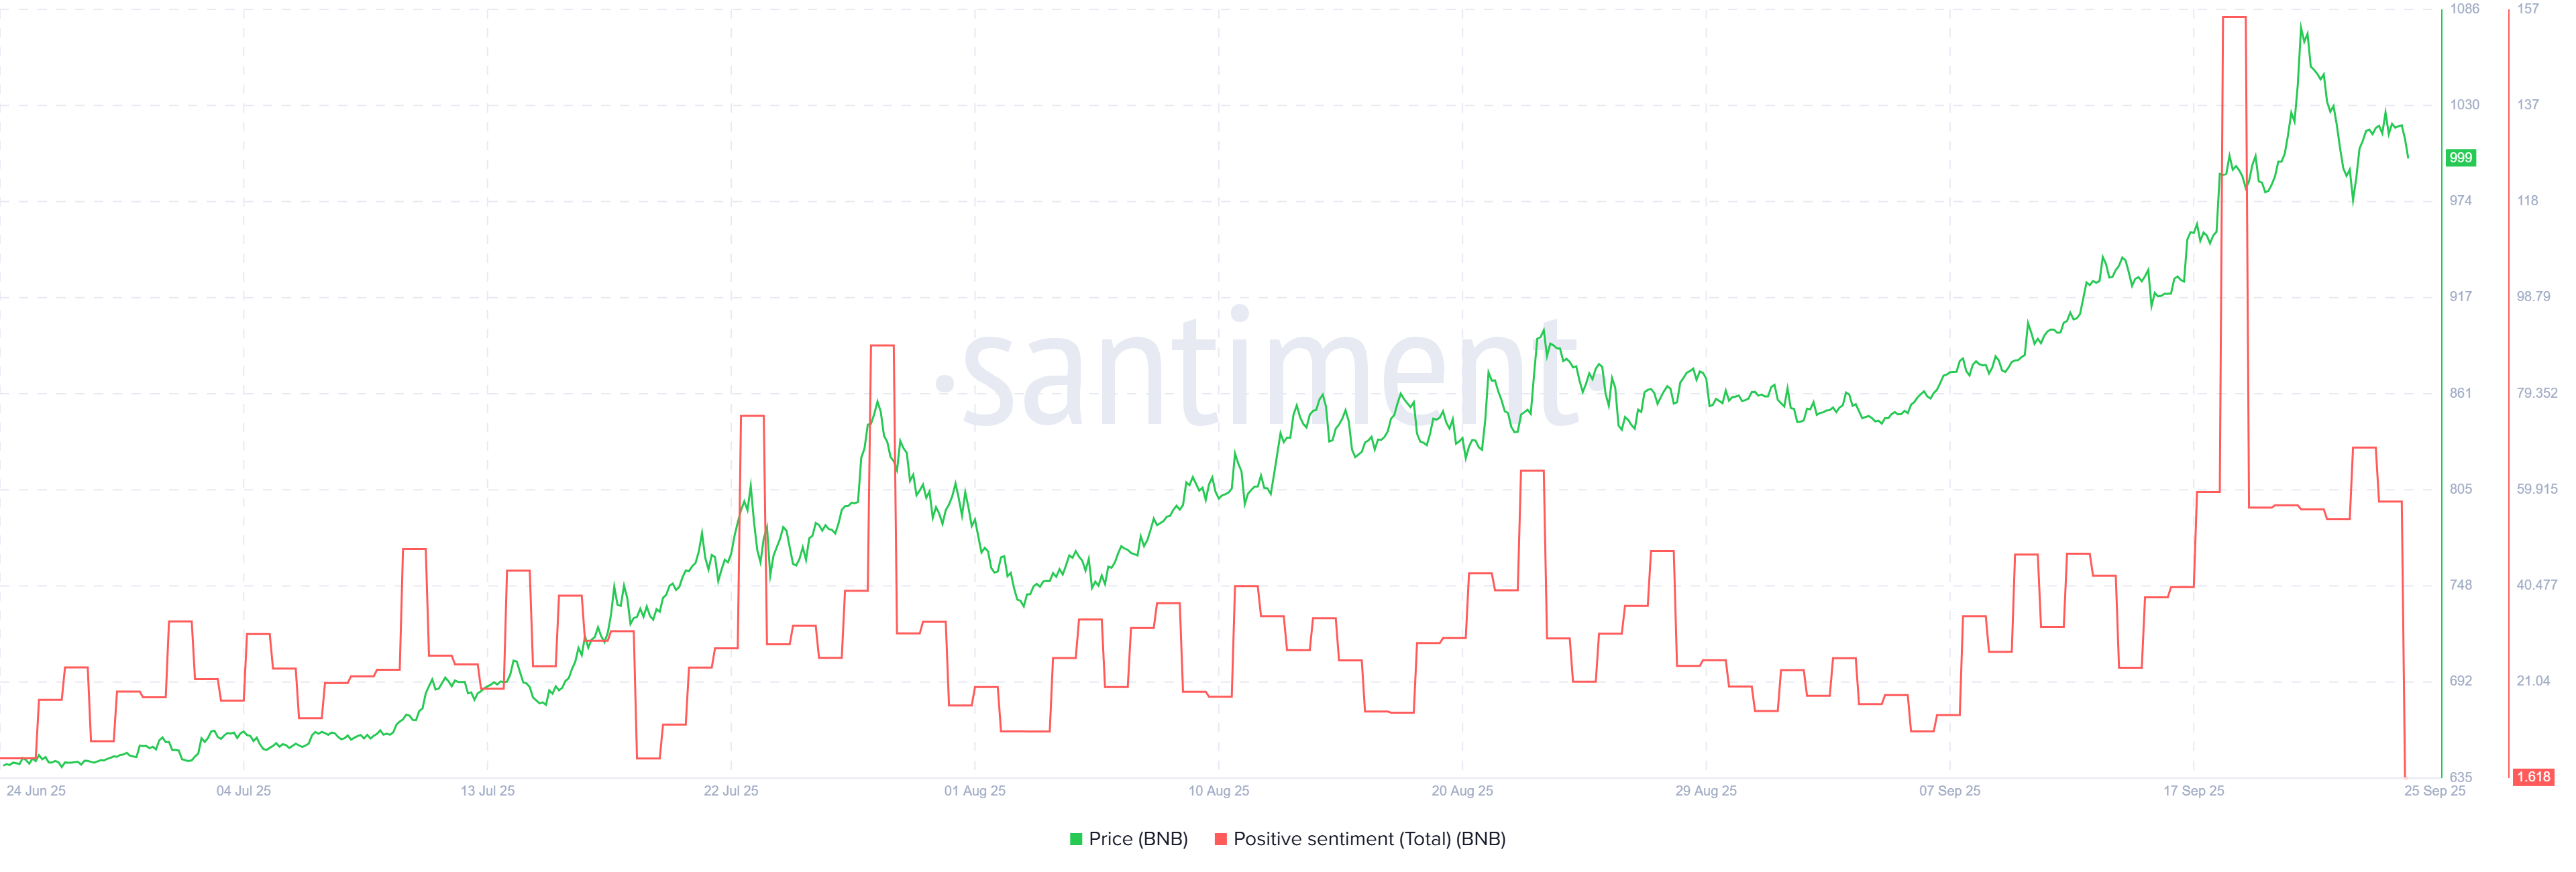
This divergence signals that despite rising prices, short-term confidence is fading. A decline in sentiment often acts as an early warning of a correction, especially when combined with high trading volumes.
BNB benefits from positive news and strong activity. Yet technical indicators and sentiment are flashing risk warnings. Without a clear profit-taking plan or strict capital management, traders may lose the gains BNB delivered this month.
