Glassnode Spots Market Exhaustion Just as Bitcoin’s ’Uptober’ Rally Nears

Bitcoin faces a critical inflection point as on-chain analytics flash warning signs right before its historically bullish October period.
Market Fatigue Sets In
Glassnode's latest data reveals troubling signals across multiple metrics. Network activity shows distinct patterns of exhaustion—the kind that typically precedes significant price movements. Trading volumes stagnate while wallet activity hints at investor indecision.
The Uptober Phenomenon Looms
Historical patterns suggest October brings renewed momentum. The fourth quarter traditionally kicks off with institutional repositioning and renewed retail interest. This year presents a peculiar tension between technical exhaustion and seasonal optimism.
Institutional Whispers Grow Louder
Behind the scenes, major players accumulate positions while publicly expressing caution—because nothing says 'bullish' like hedge funds talking down an asset they're actively buying. The divergence between public sentiment and private action creates perfect conditions for a volatility spike.
Whether this exhaustion leads to breakdown or breakthrough depends entirely on whether traditional finance's seasonal patterns can override crypto's inherent unpredictability. Either way, someone's going to look very smart while everyone else complains about market manipulation.
Why Bitcoin’s Price May Drop Further
In their latest analysis, Glassnode noted that Bitcoin is showing signs of ‘exhaustion’ after the Fed rate cut last week, which pushed the price to $117,000.
“Bitcoin has transitioned into a corrective phase, echoing a textbook ‘buy the rumour, sell the news’ pattern,” Glassnode wrote.
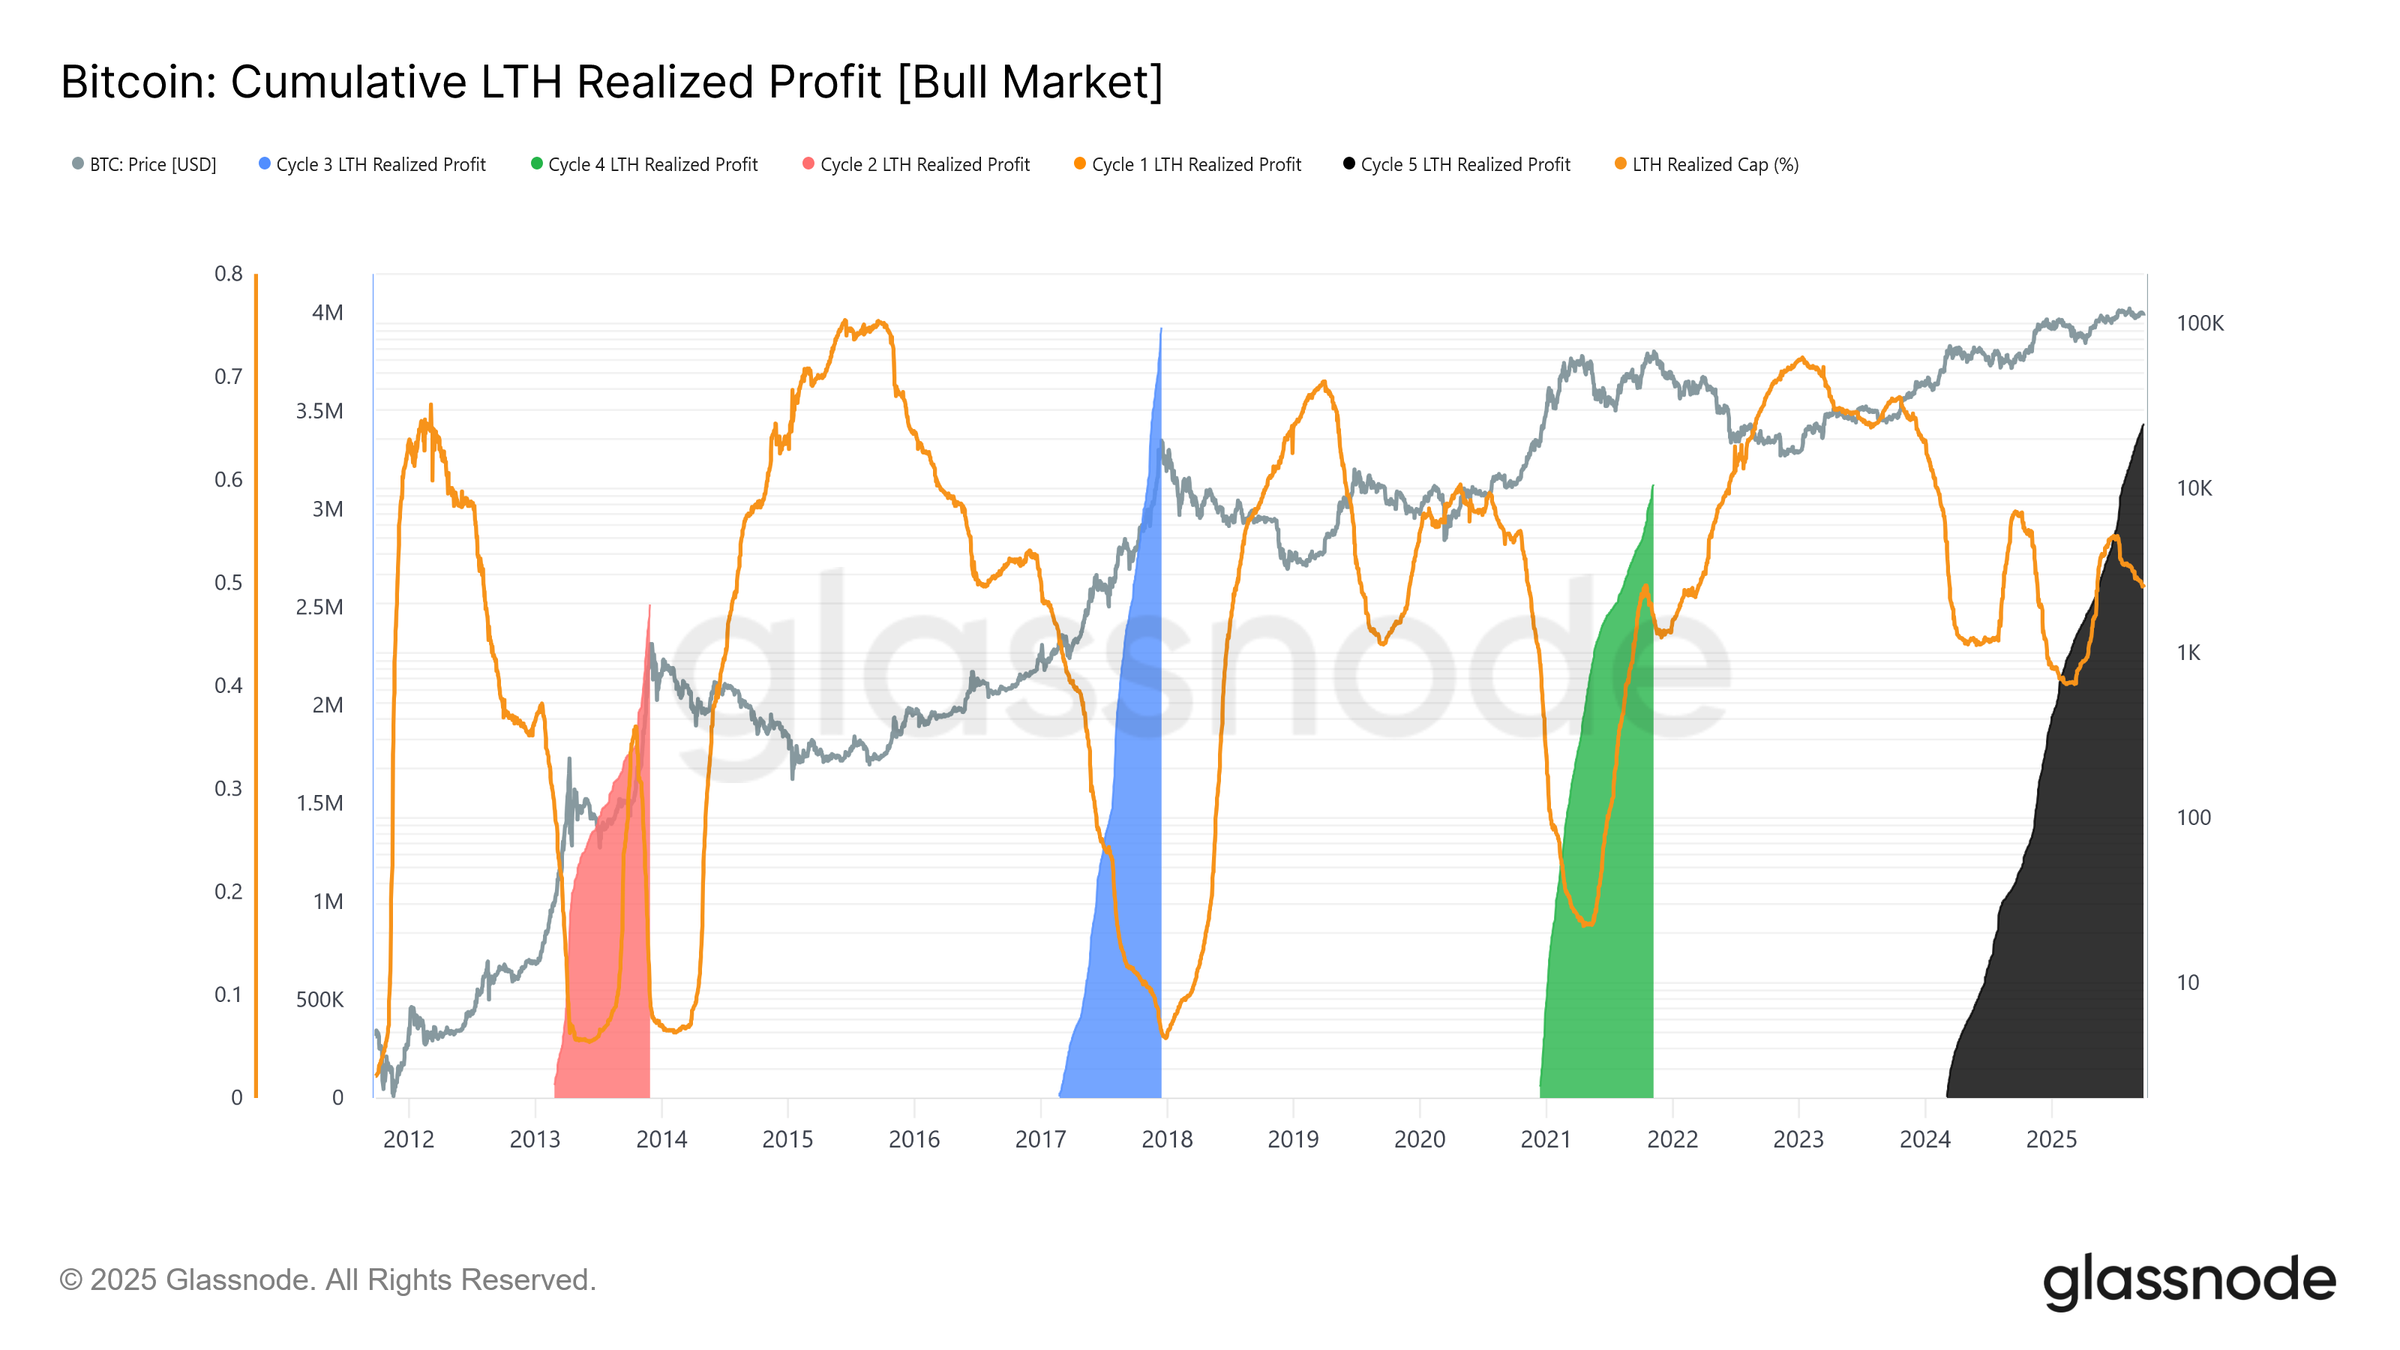
Moreover, underlying metrics suggest vulnerability. The firm highlighted that long-term holders (LTHs) have made massive profits during this phase, realizing around 3.4 million BTC in gains.
This is higher than in any previous cycle. Glassnode added that such large-scale distribution by long-term holders has historically coincided with market tops.
“Unlike the single prolonged waves of earlier cycles, this cycle has seen three distinct multi-month surges. The Realized Profit/Loss Ratio shows that each time profit-taking exceeded 90% of coins moved, marking cyclical peaks. Having just stepped away from the third such extreme, probabilities favour a cooling phase ahead,” the analysts stated.
Meanwhile, a slowdown in fresh demand compounded this pressure. ETF netflows collapsed from 2,600 BTC per day to NEAR zero, just as LTH selling accelerated.
“ETF inflows have so far balanced LTH selling, but with little margin for error. Around the FOMC, LTH distribution surged to 122k BTC/month, while ETF netflows (7D-SMA) collapsed from 2.6k BTC/day to nearly zero. The combination of rising sell pressure and fading institutional demand created a fragile backdrop, setting the stage for weakness,” the analysis read.
In addition, spot markets showed signs of stress as volumes spiked during the post-FOMC sell-off. Futures markets experienced sharp deleveraging, with open interest dropping by billions of dollars.
Options markets also turned defensive, with put demand surging and skew rising sharply, underlining traders’ caution. Amid this, Glassnode pointed out that $111,800, the short-term holder cost basis, is an important level to sustain.
“With spot and futures under stress, the short-term holder cost basis at $111k is the key level to hold or risk deeper cooling,” the firm stressed.
Now, since bitcoin has already slipped below the cost basis, the probability of further declines has increased significantly. Analyst Quinten Francois suggested that while the outlook is not particularly bullish in the short term, the market may lean sideways rather than an immediate bearish breakdown.
“BTC fell under the $111.8k support and the uptrend support. Made its daily close under these important levels. I think we’re in a no-trade zone and see which direction we go. Might go sideways and liquidity flowing to alts, since the BTC.D is still very bearish,” Francois remarked.
Can Uptober Save Bitcoin? Historical Data Suggests Strong Gains
Despite these headwinds, seasonal factors offer a bullish counterpoint. October, often dubbed ‘Uptober’ in cryptocurrency circles, has historically been one of Bitcoin’s strongest months. Data from Coinglass revealed that BTC has posted an average return of 21.89% in the month.
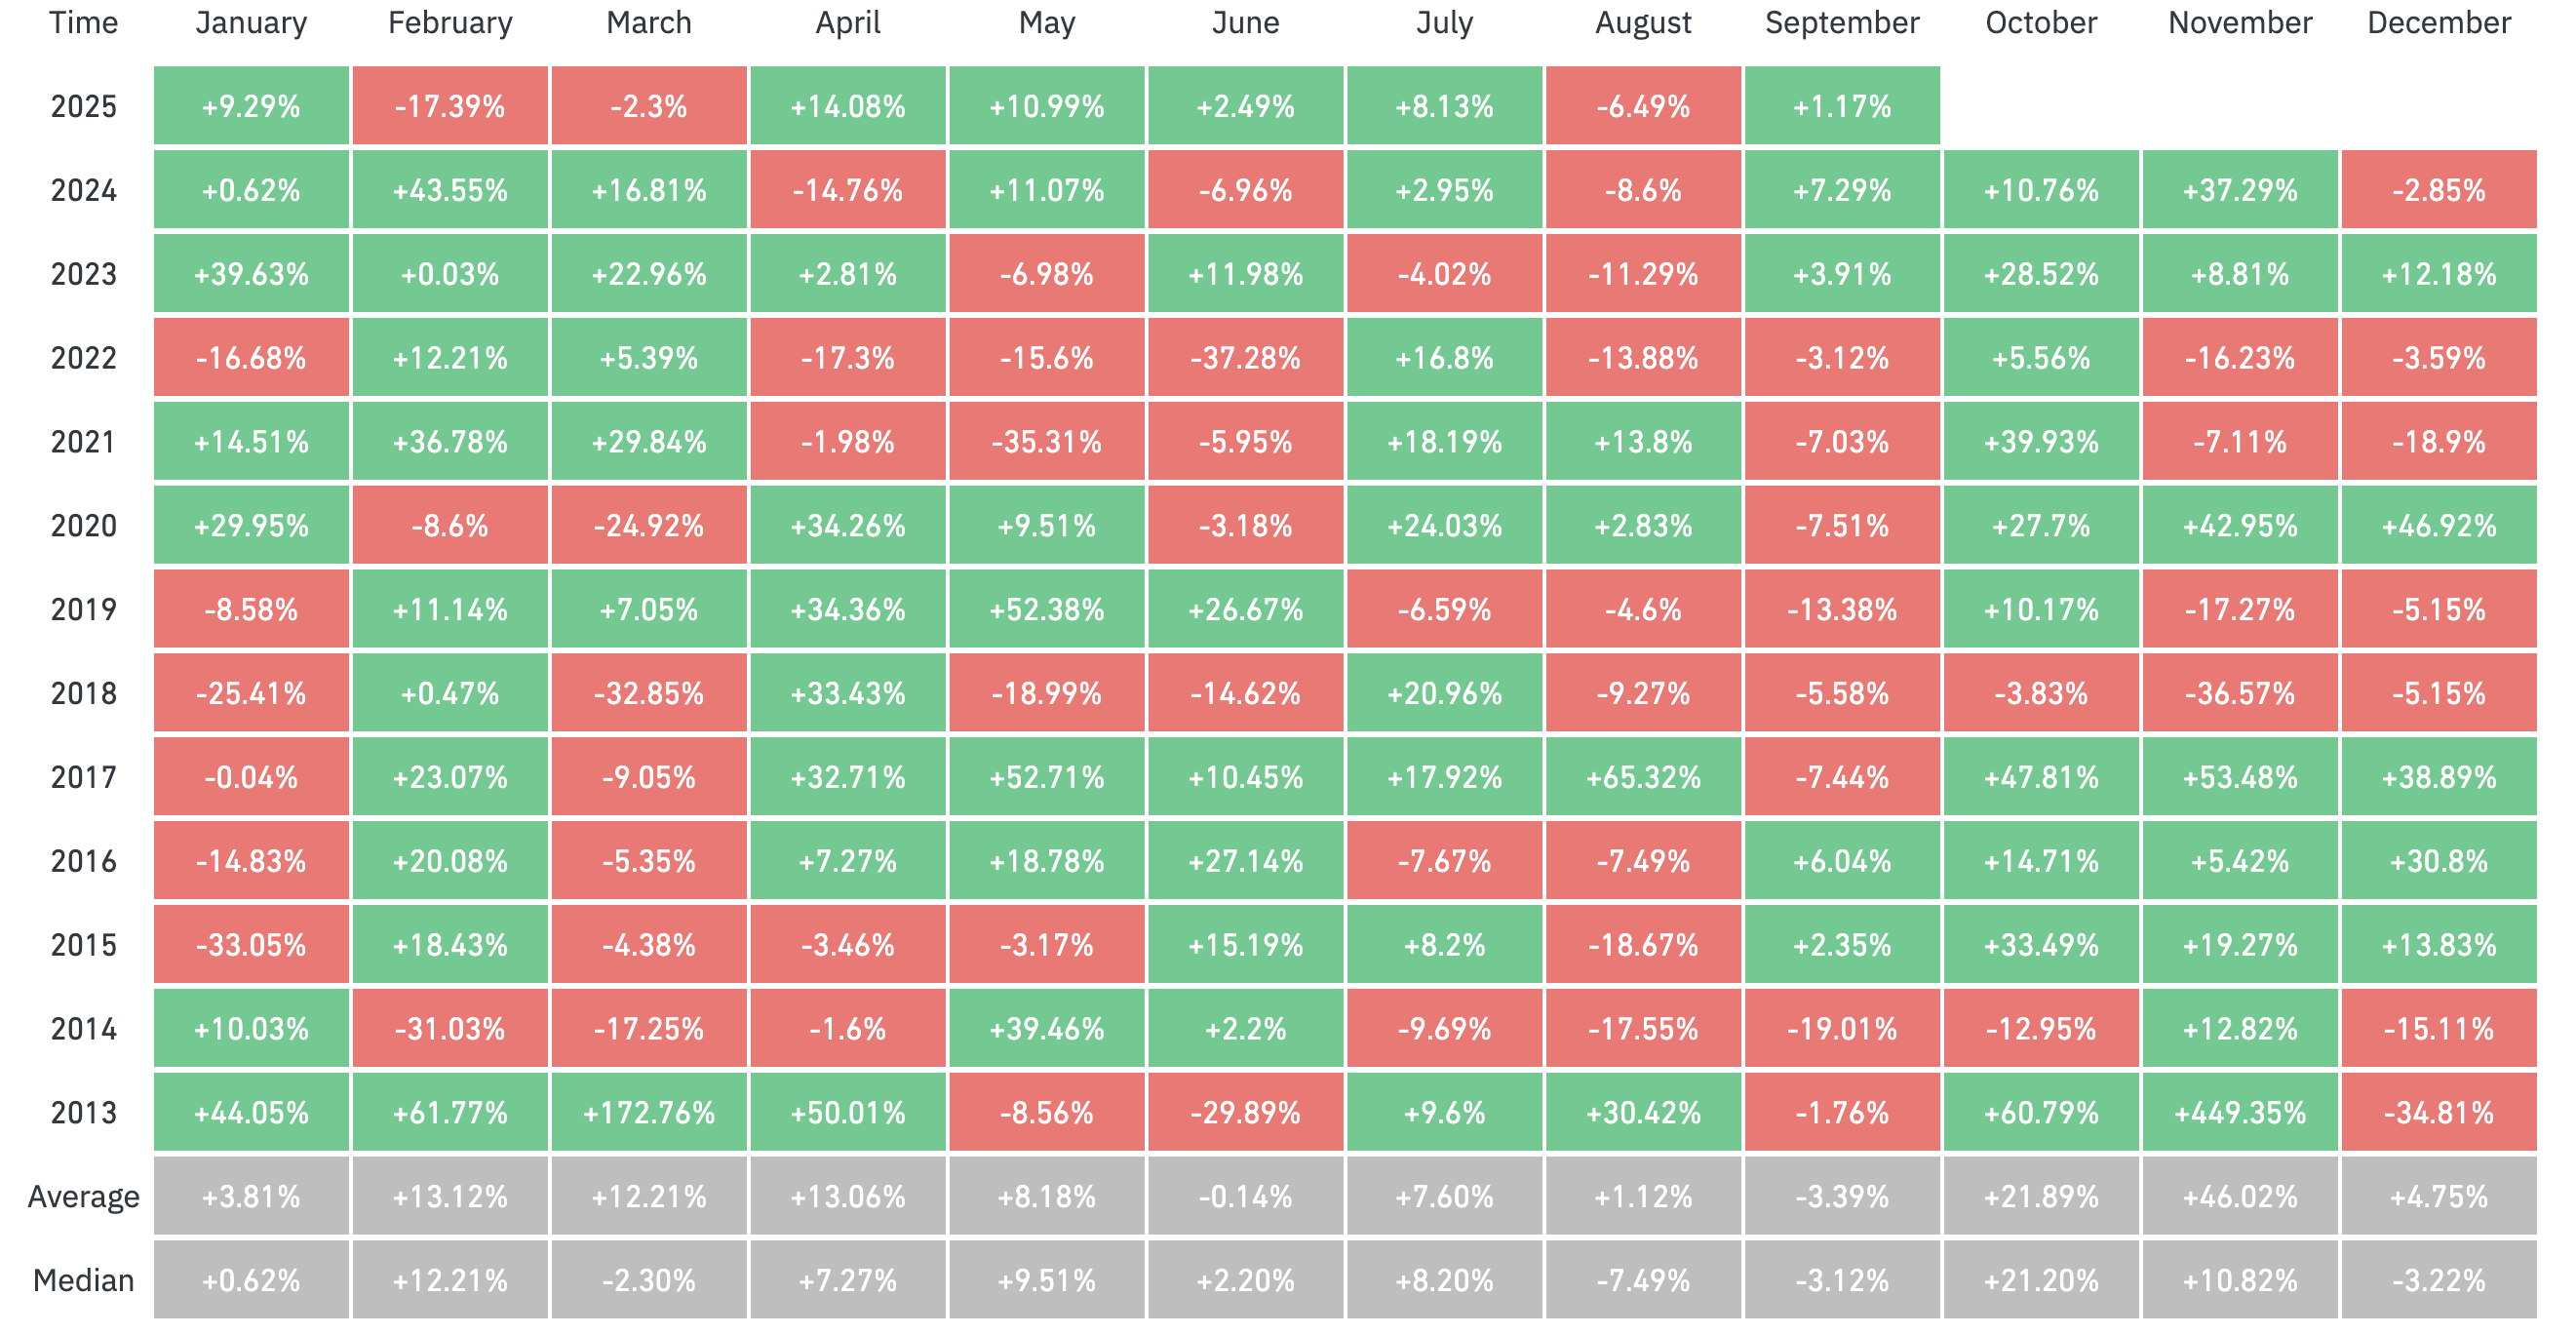
Furthermore, analyst Darkfost noted that over the past 16 years, BTC has closed October in the red only four times.
“If you had invested in BTC on October 1st, you WOULD have ended up in profit 12 times since 2009, with a maximum monthly return of 213% in 2010. Looking more recently since 2020, a simple October 1st investment in BTC would have yielded between 7.5% and 30.5% within the month alone. After this, it’s hard to argue that BTC has no seasonality at all, although it could also be part of a broader seasonal effect across financial markets,” he posted.
This performance has raised market hopes of a potential rally in the upcoming month.
October is called UPTOBER for a reason.
This is highly bullish in post-halving years.
Position yourself before Q4. pic.twitter.com/T2Rcz8FlwN
As Bitcoin trades below key support levels, the coming weeks will test whether the asset will fulfill its Uptober promises or if the correction will continue.
