OKB Defies Market Downturn—$200 Breakthrough Imminent This Month?

While traditional markets wobble, OKB charges ahead against the grain—defying gravity as rivals stumble.
Technical Breakout Pattern Emerges
The token's consolidation above key support levels signals accumulating strength. Trading volume spikes suggest institutional interest brewing beneath the surface.
Exchange Token Dominance Accelerates
OKB's ecosystem expansion mirrors BNB's historic growth trajectory—but with sharper tokenomics. New utility features create burning mechanisms that tighten supply while demand grows.
The $200 Psychological Barrier
Market watchers eye the $200 level as a make-or-break resistance point. Previous attempts saw profit-taking pressure, but this time derivatives data shows different positioning.
Of course, traditional finance pundits will call it speculation—until they quietly allocate 3% of their portfolio next quarter. The question isn't if OKB breaks $200, but when the mainstream financial media finally notices.
OKB Rally Builds Steam
OKB’s price rally comes amid a notable spike in demand, with its daily trading volume surging almost 200% in the past day. This totals $293 million at press time, suggesting that the rally is not driven by speculation.
: Want more token insights like this? Sign up for Editor Harsh Notariya’s Daily crypto Newsletter here.
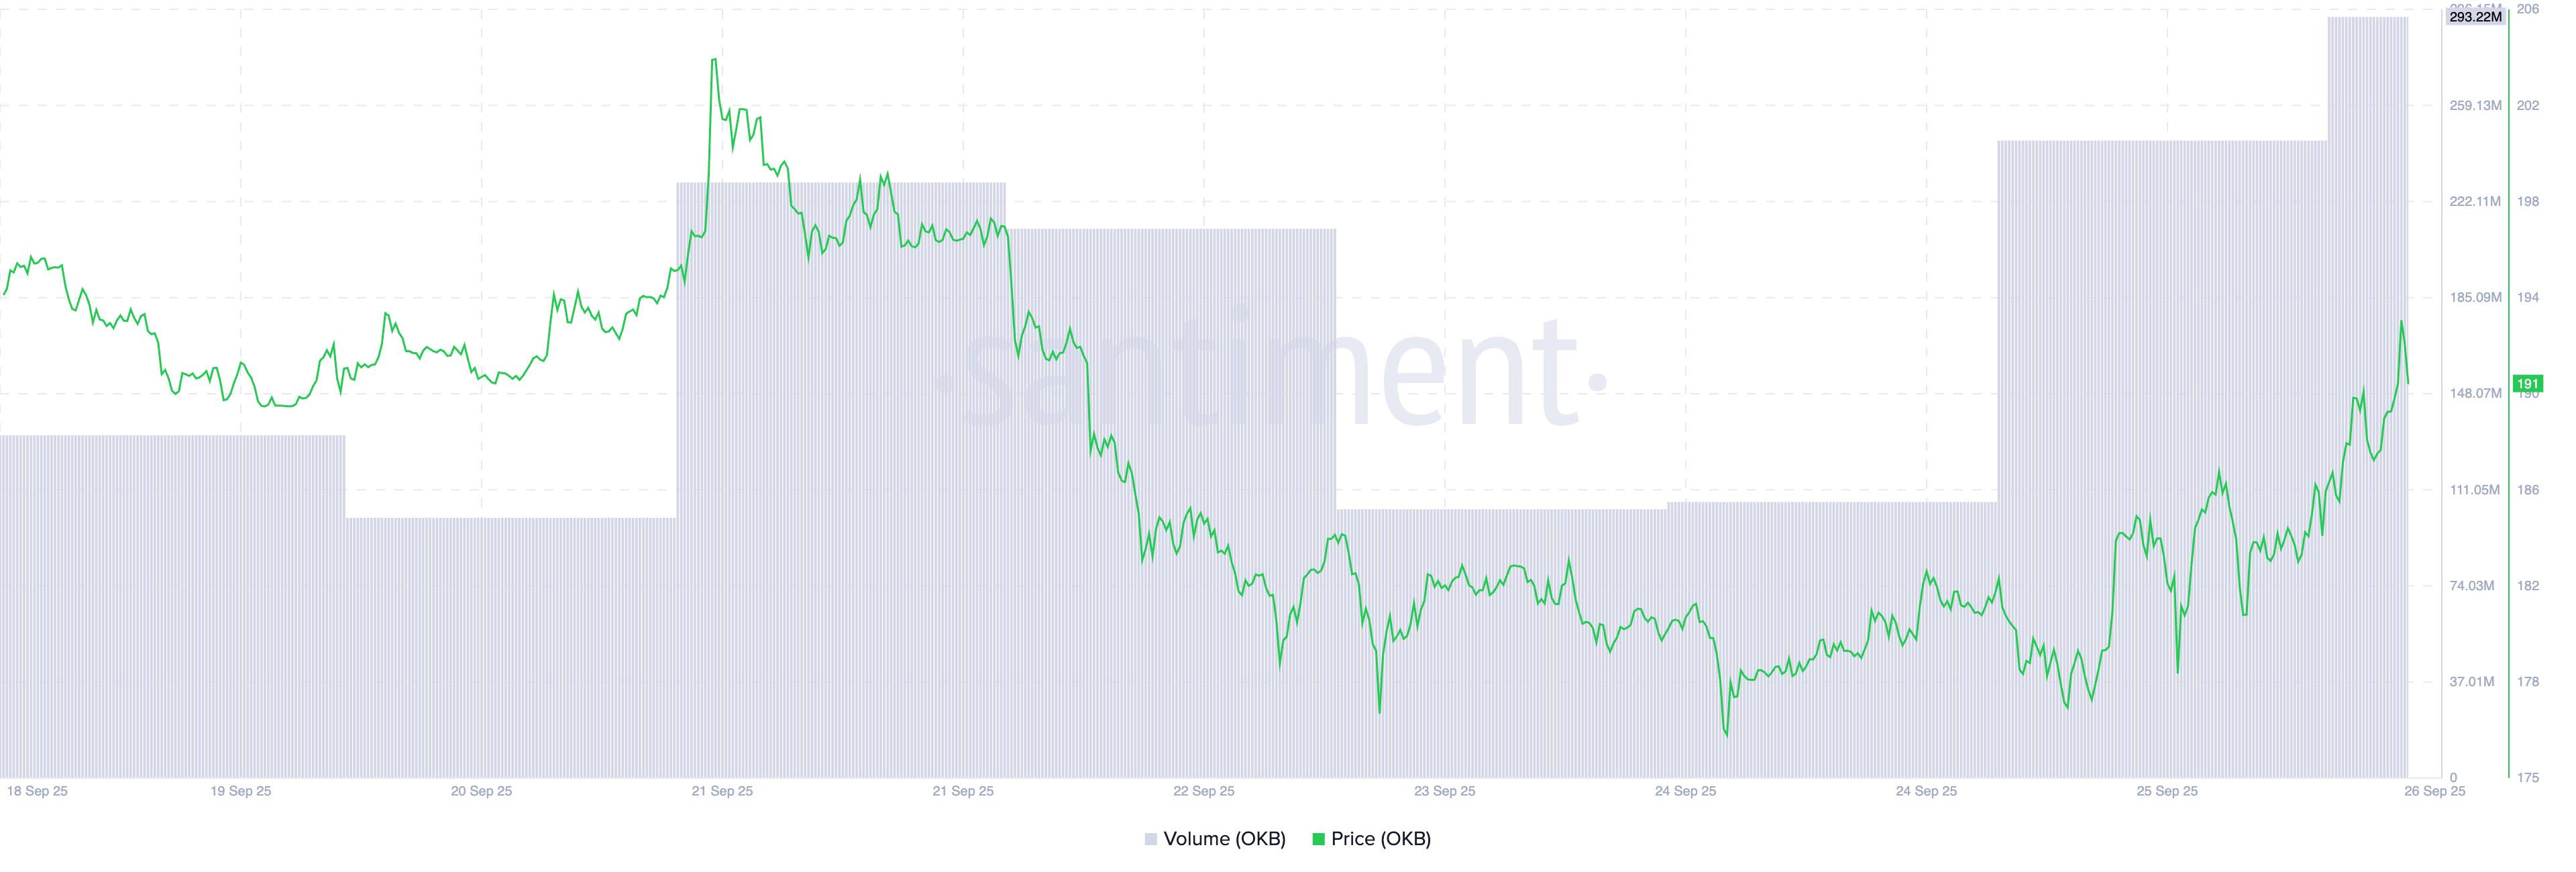
When an asset’s price rises alongside a sharp increase in trading volume, it signals strong conviction among buyers rather than short-term hype.
Higher volumes mean more market participants are involved in the move, lending credibility to OKB’s rally and reducing the risk of a quick reversal. If demand continues at this pace, the increased depth in the market could provide the support needed for OKB to test the $200 level.
Further, readings from the daily chart show that OKB trades solidly above its Super Trend Line, reflecting a strong bullish tilt in market sentiment. At press time, this indicator forms dynamic support below OKB’s price at $169.35.
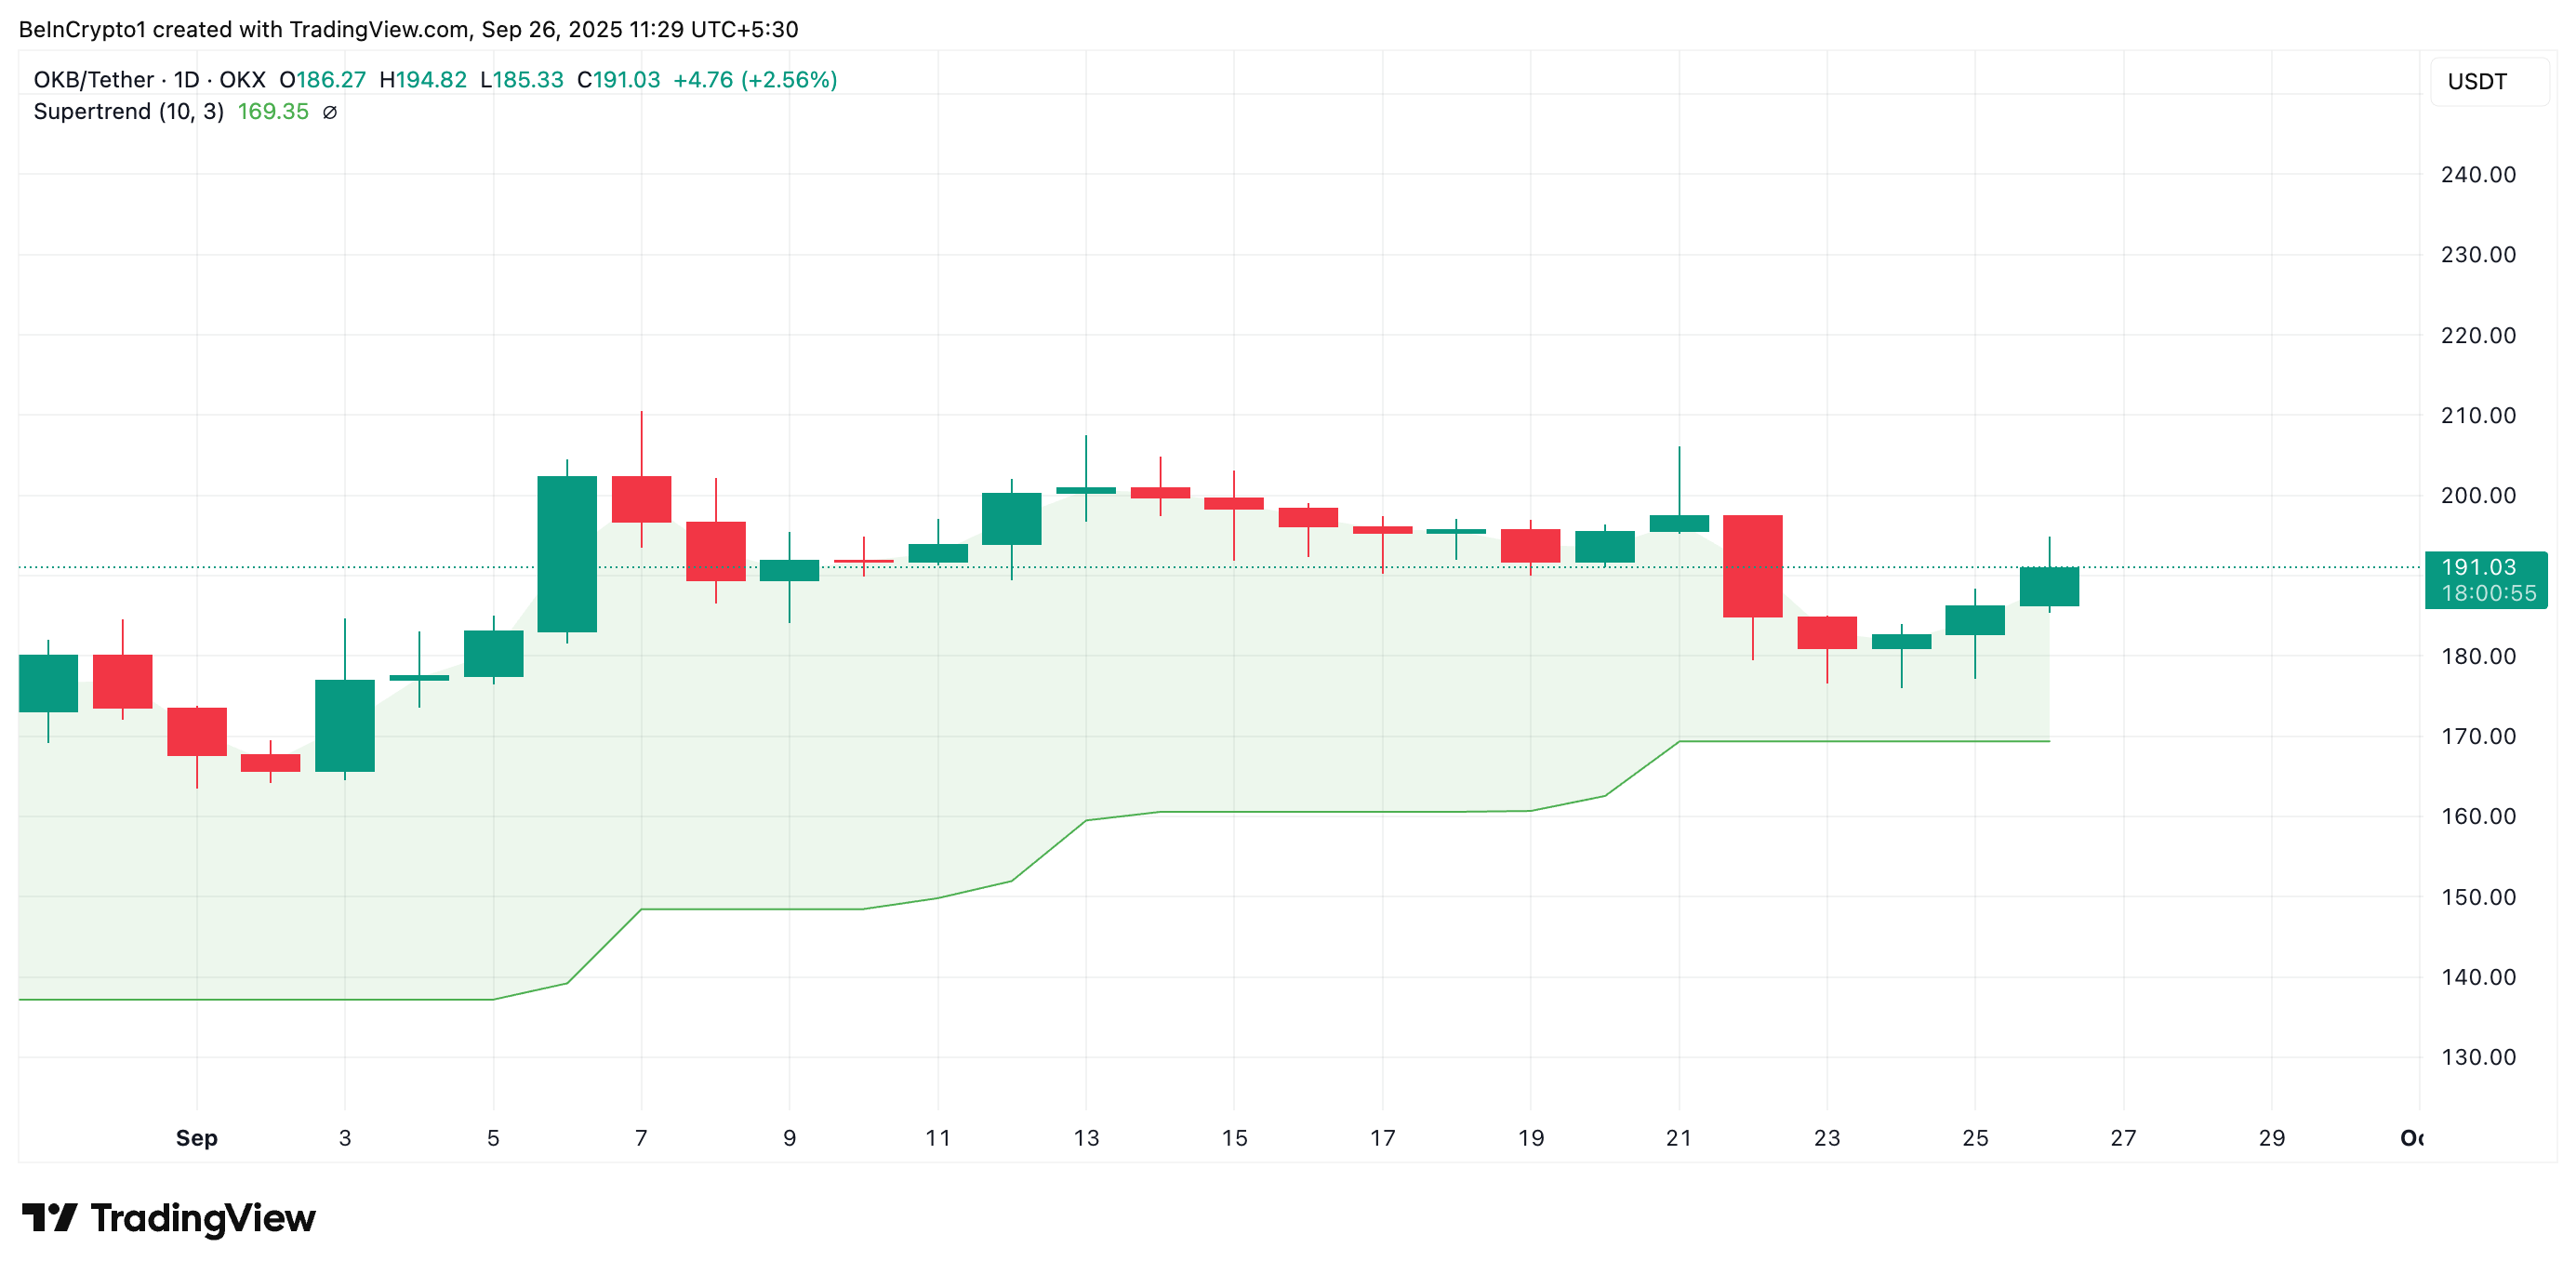
The Super Trend indicator tracks the market’s direction by placing a line above or below the price chart based on the asset’s volatility.
As with OKB, when an asset’s price trades above the Super Trend line, it signals a bullish trend. It highlights that the market is in an uptrend that may persist as buying pressure dominates.
OKB Bulls Target $210, Yet Profit-Taking Threatens a Pullback
As September nears its close, all eyes are now on whether this momentum will be enough to propel the token toward the $200 milestone. For that to happen, OKB must first break above its next major resistance, which lies at $196.84.
A successful breach of this level could propel its price toward $210.57 in the NEAR term.
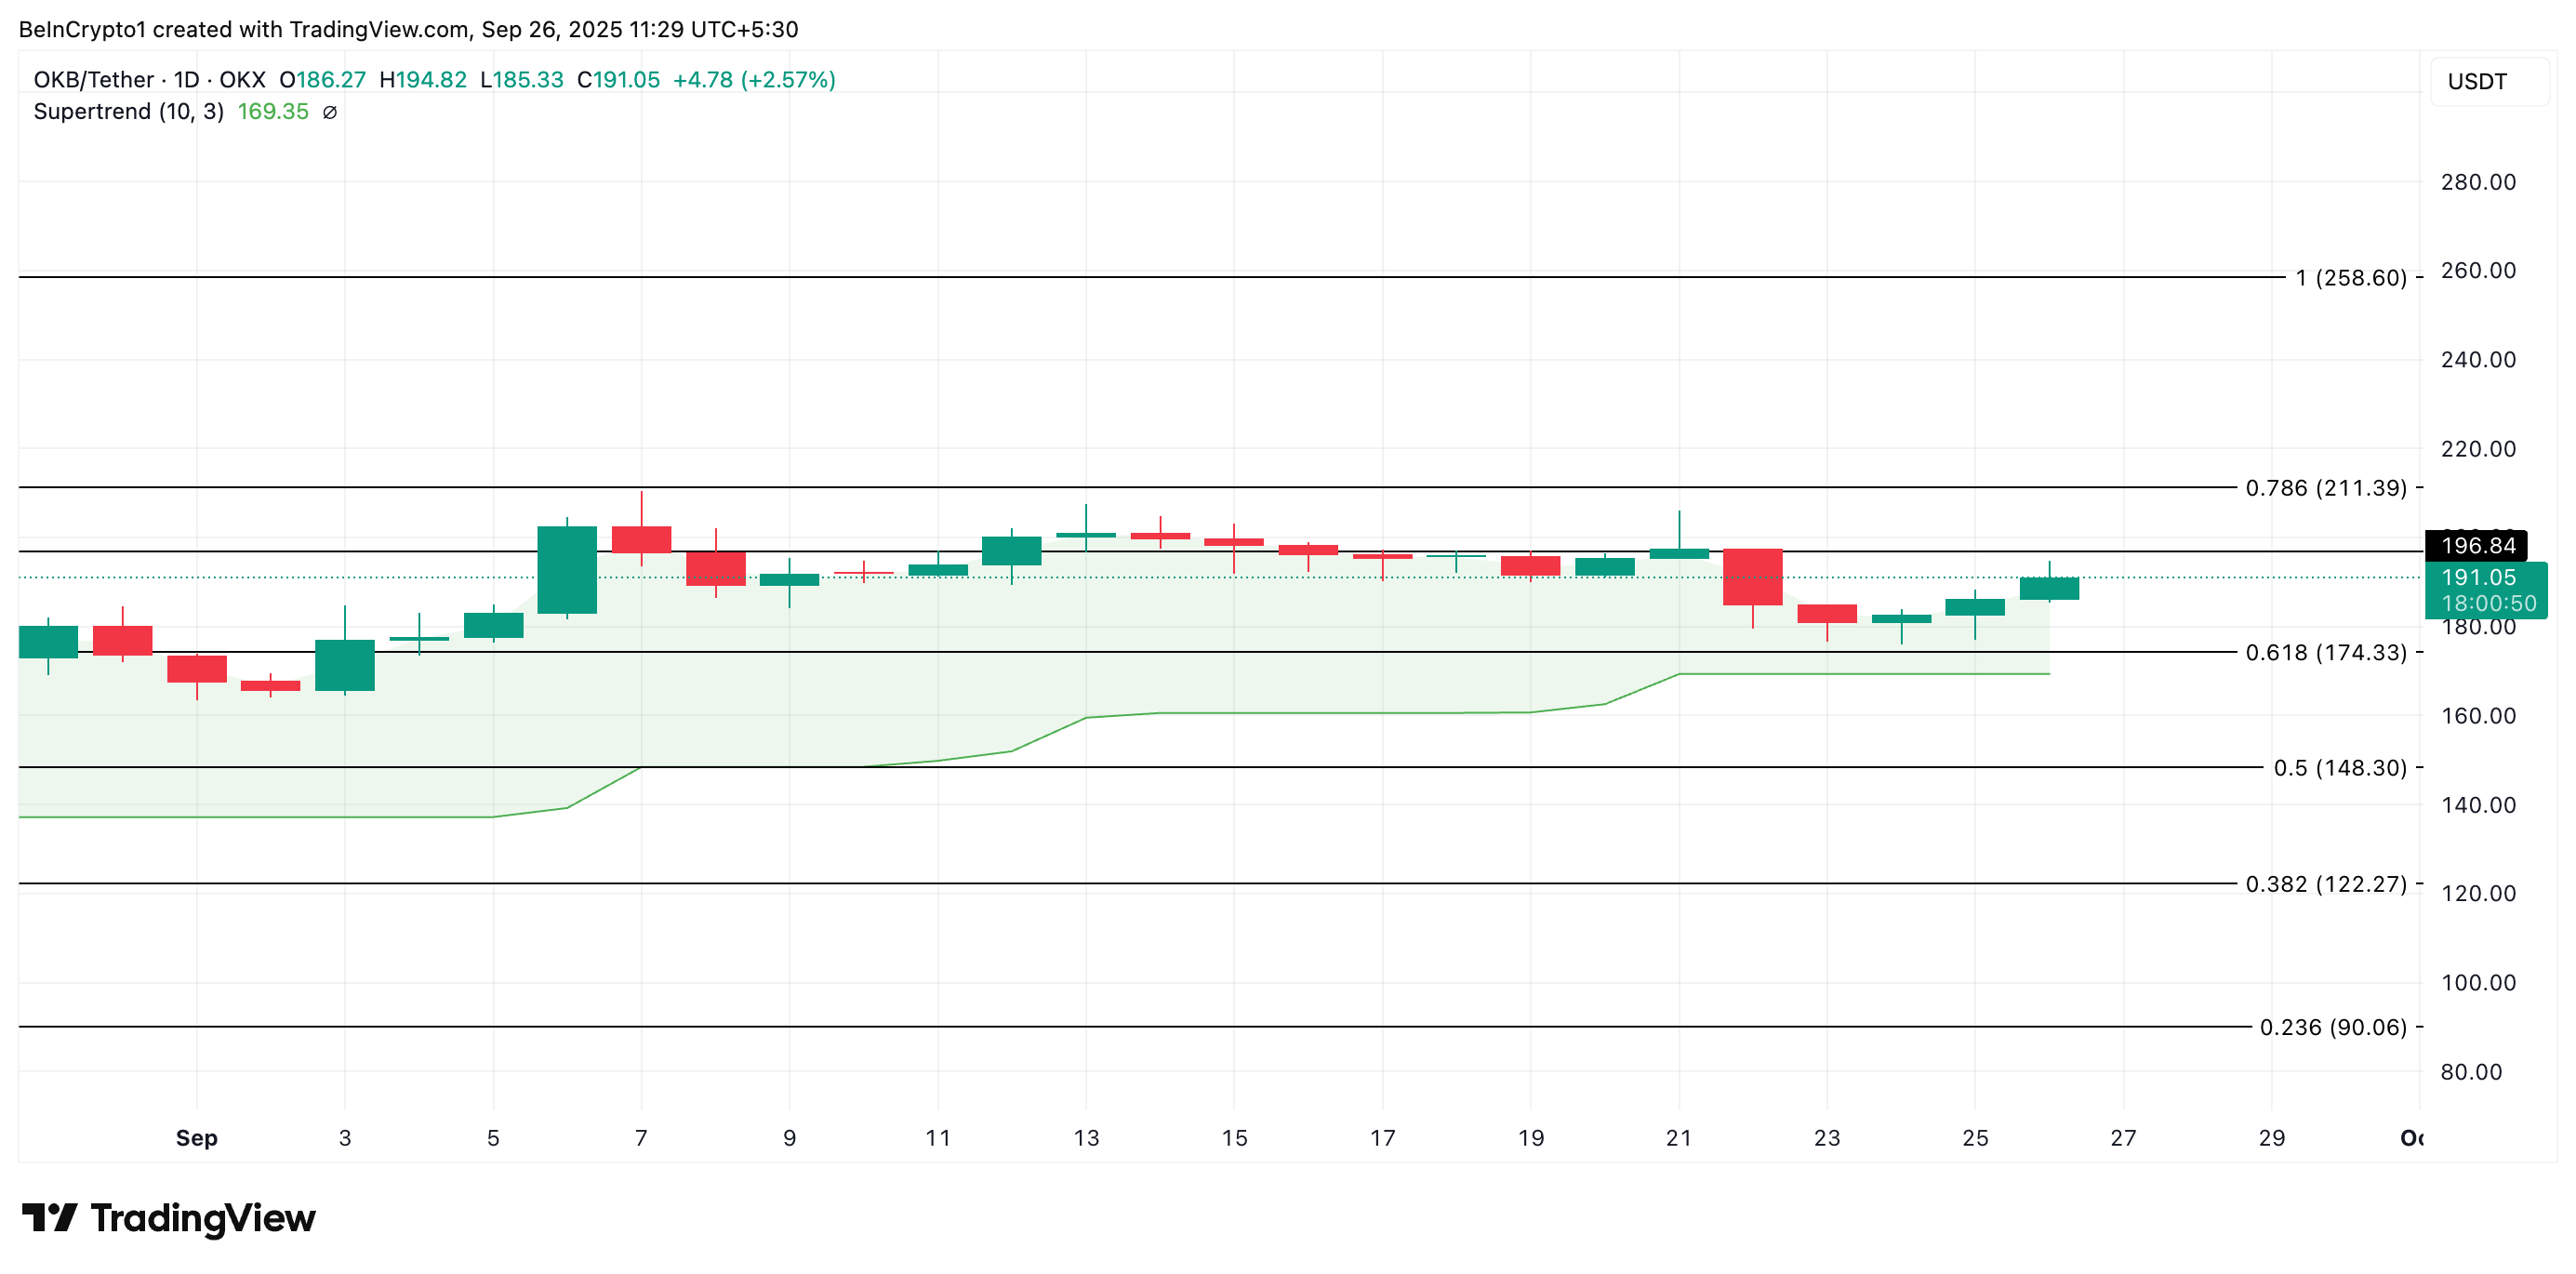
However, a surge in profit-taking WOULD invalidate this bullish outlook. In that scenario, OKB could shed some of its recent gains and test support at $173.69.
OKB could fall toward the dynamic support of its Super Trend line at $169.35 if this level gives way.
