ETHFI Defies Market Gravity with 11% Surge - Bullish Momentum Builds for Major Breakout

While traditional markets obsess over quarterly reports, ETHFI just schooled everyone on how real assets move.
Defying Gravity
The token ripped through resistance levels like they were tissue paper—posting an 11% gain that left bears scrambling. No fancy fundamentals needed, just pure market momentum doing what it does best.
Technical Breakout Mode
Chart patterns suggest this is merely the warm-up act. Volume spikes indicate institutional fingers are getting itchy—when the whales start circling, retail better pay attention.
Traditional Finance's Blind Spot
Meanwhile, Wall Street analysts are still trying to figure out if blockchain is a new type of accounting software. Their loss—digital assets wait for no one.
Next resistance levels look vulnerable. Either this rally has legs, or someone's about to learn why crypto volatility isn't for the faint-hearted.
ETHFI Rally Finds Strong Support
On the daily chart, ETHFI’s Super Trend indicator has formed dynamic support below its current price level, reflecting the bullish bias among traders.
: Want more token insights like this? Sign up for Editor Harsh Notariya’s Daily crypto Newsletter here.
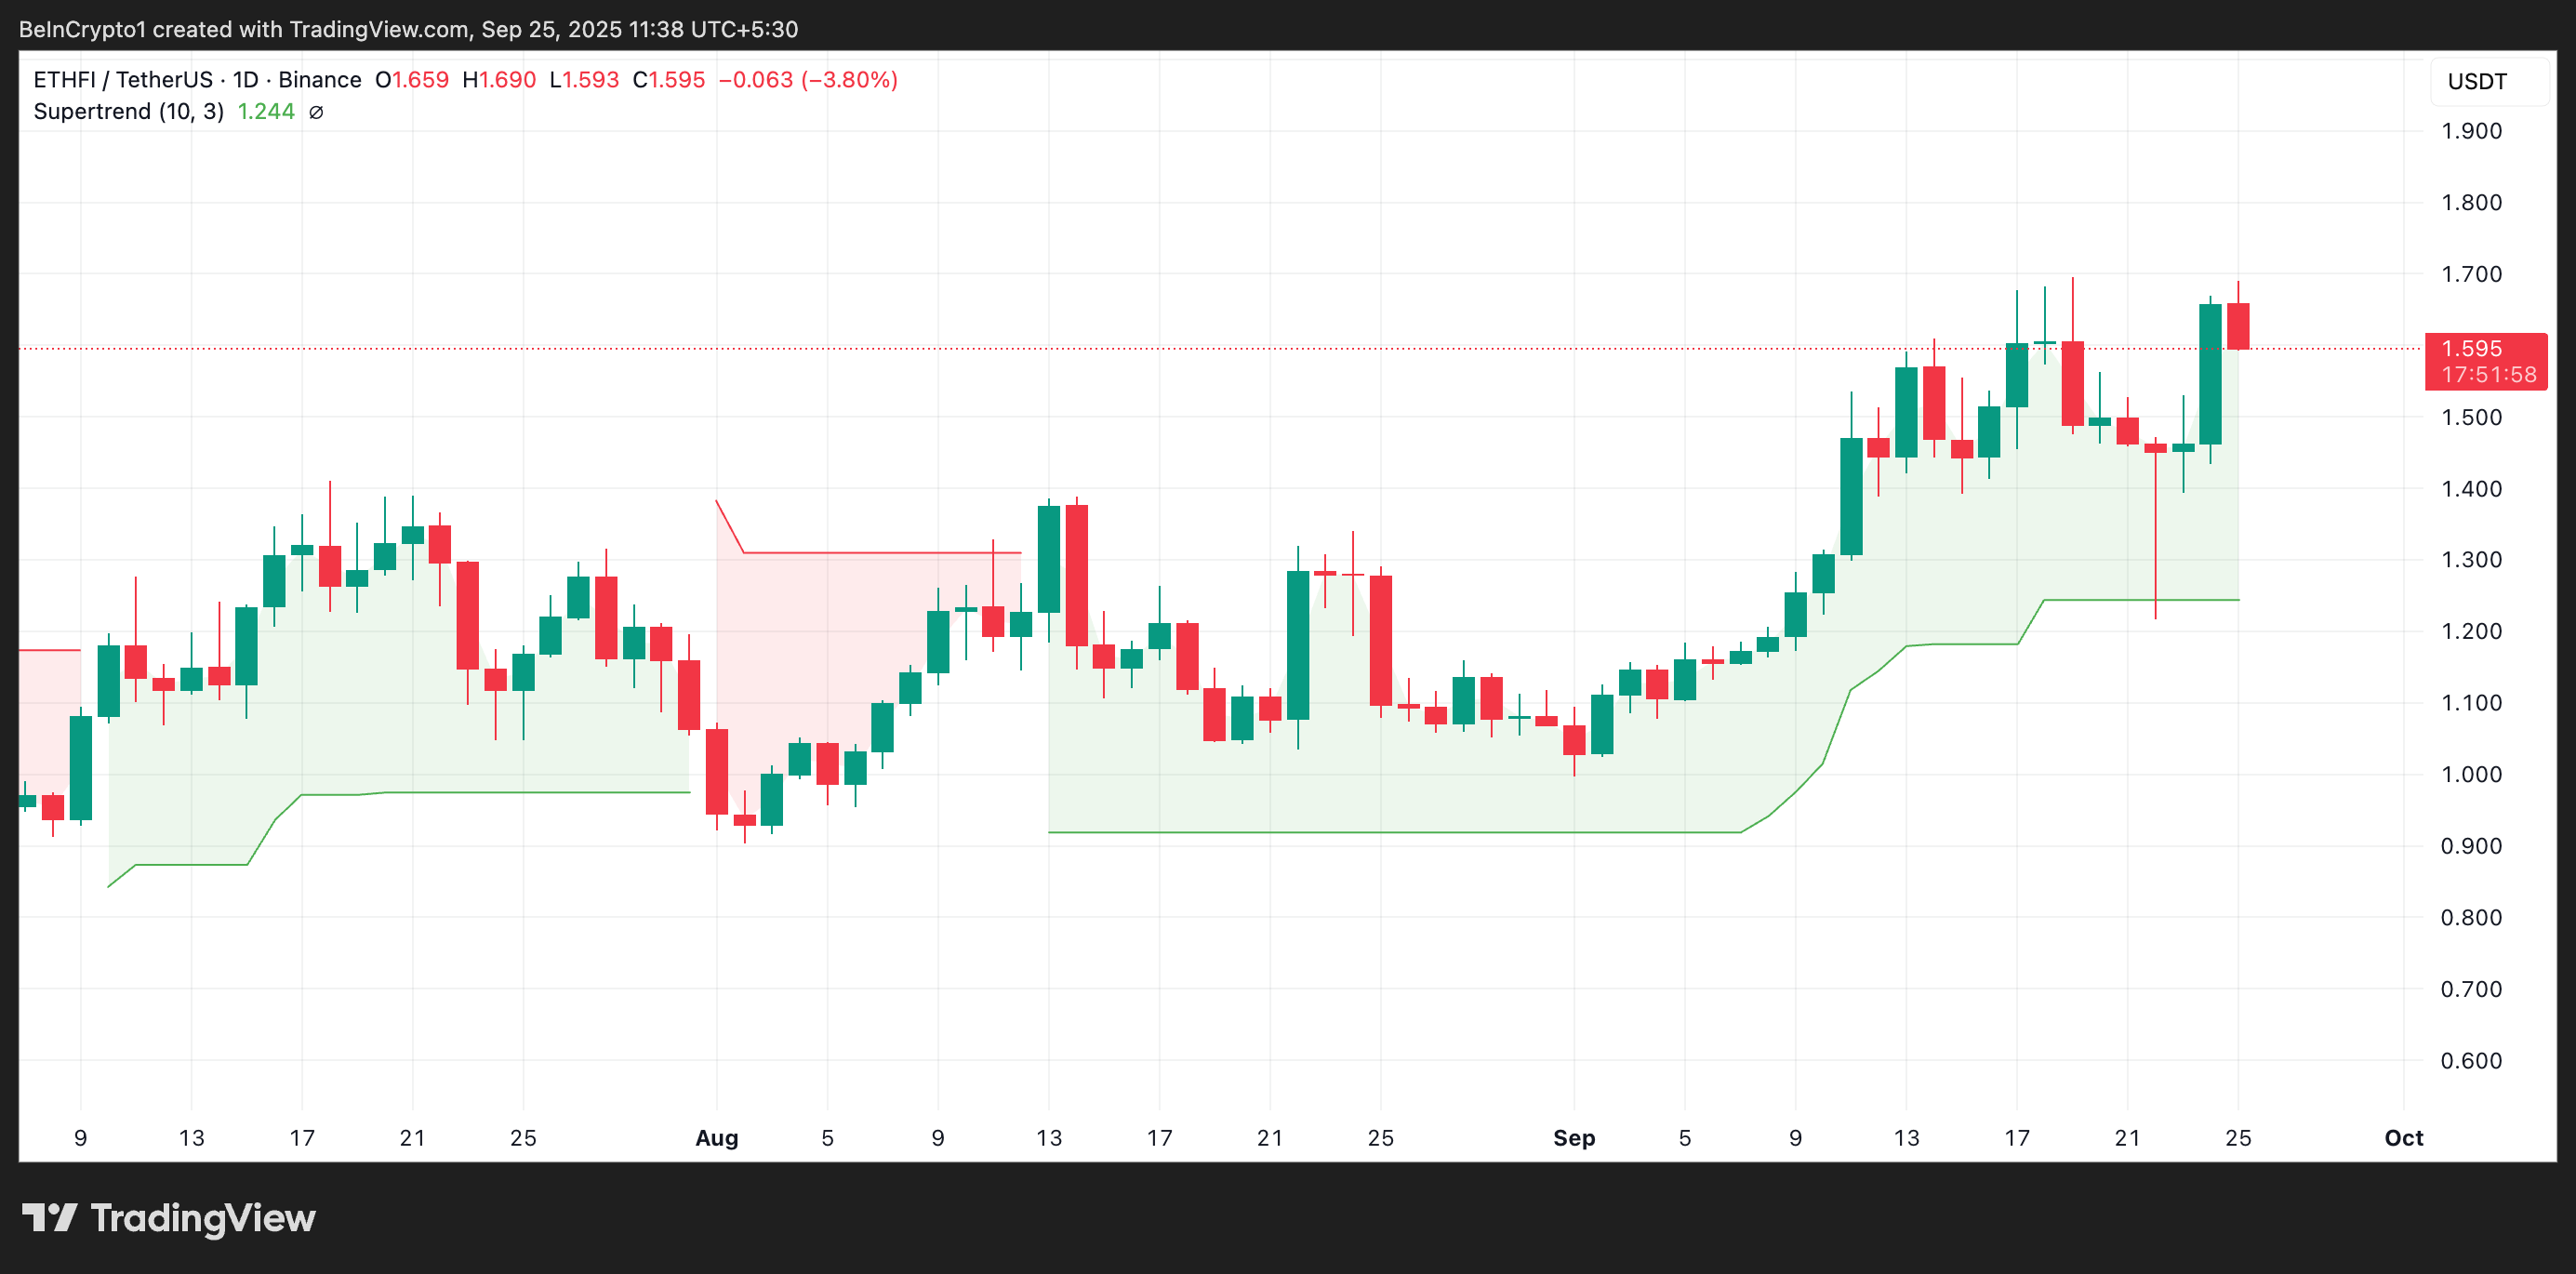
This indicator helps traders identify the market’s direction by placing a line above or below the price chart based on the asset’s volatility.
When an asset’s price trades above the Super Trend line, it signals bullish momentum, suggesting that buyers remain in control. Conversely, when the price dips below the line, it indicates a shift toward bearish sentiment, with sellers likely to dominate.
Therefore, ETHFI’s price action above the Super Trend line confirms that the recent rally is supported by strong underlying momentum rather than short-term volatility. The indicator provides traders with a support floor, reducing the risk of sharp downside moves in the NEAR term.
Further, ETHFI’s Accumulation/Distribution (A/D) line has been on the rise, signaling an uptick in buying pressure. This momentum indicator is 109.84 million at press time, climbing 59% since September 21.
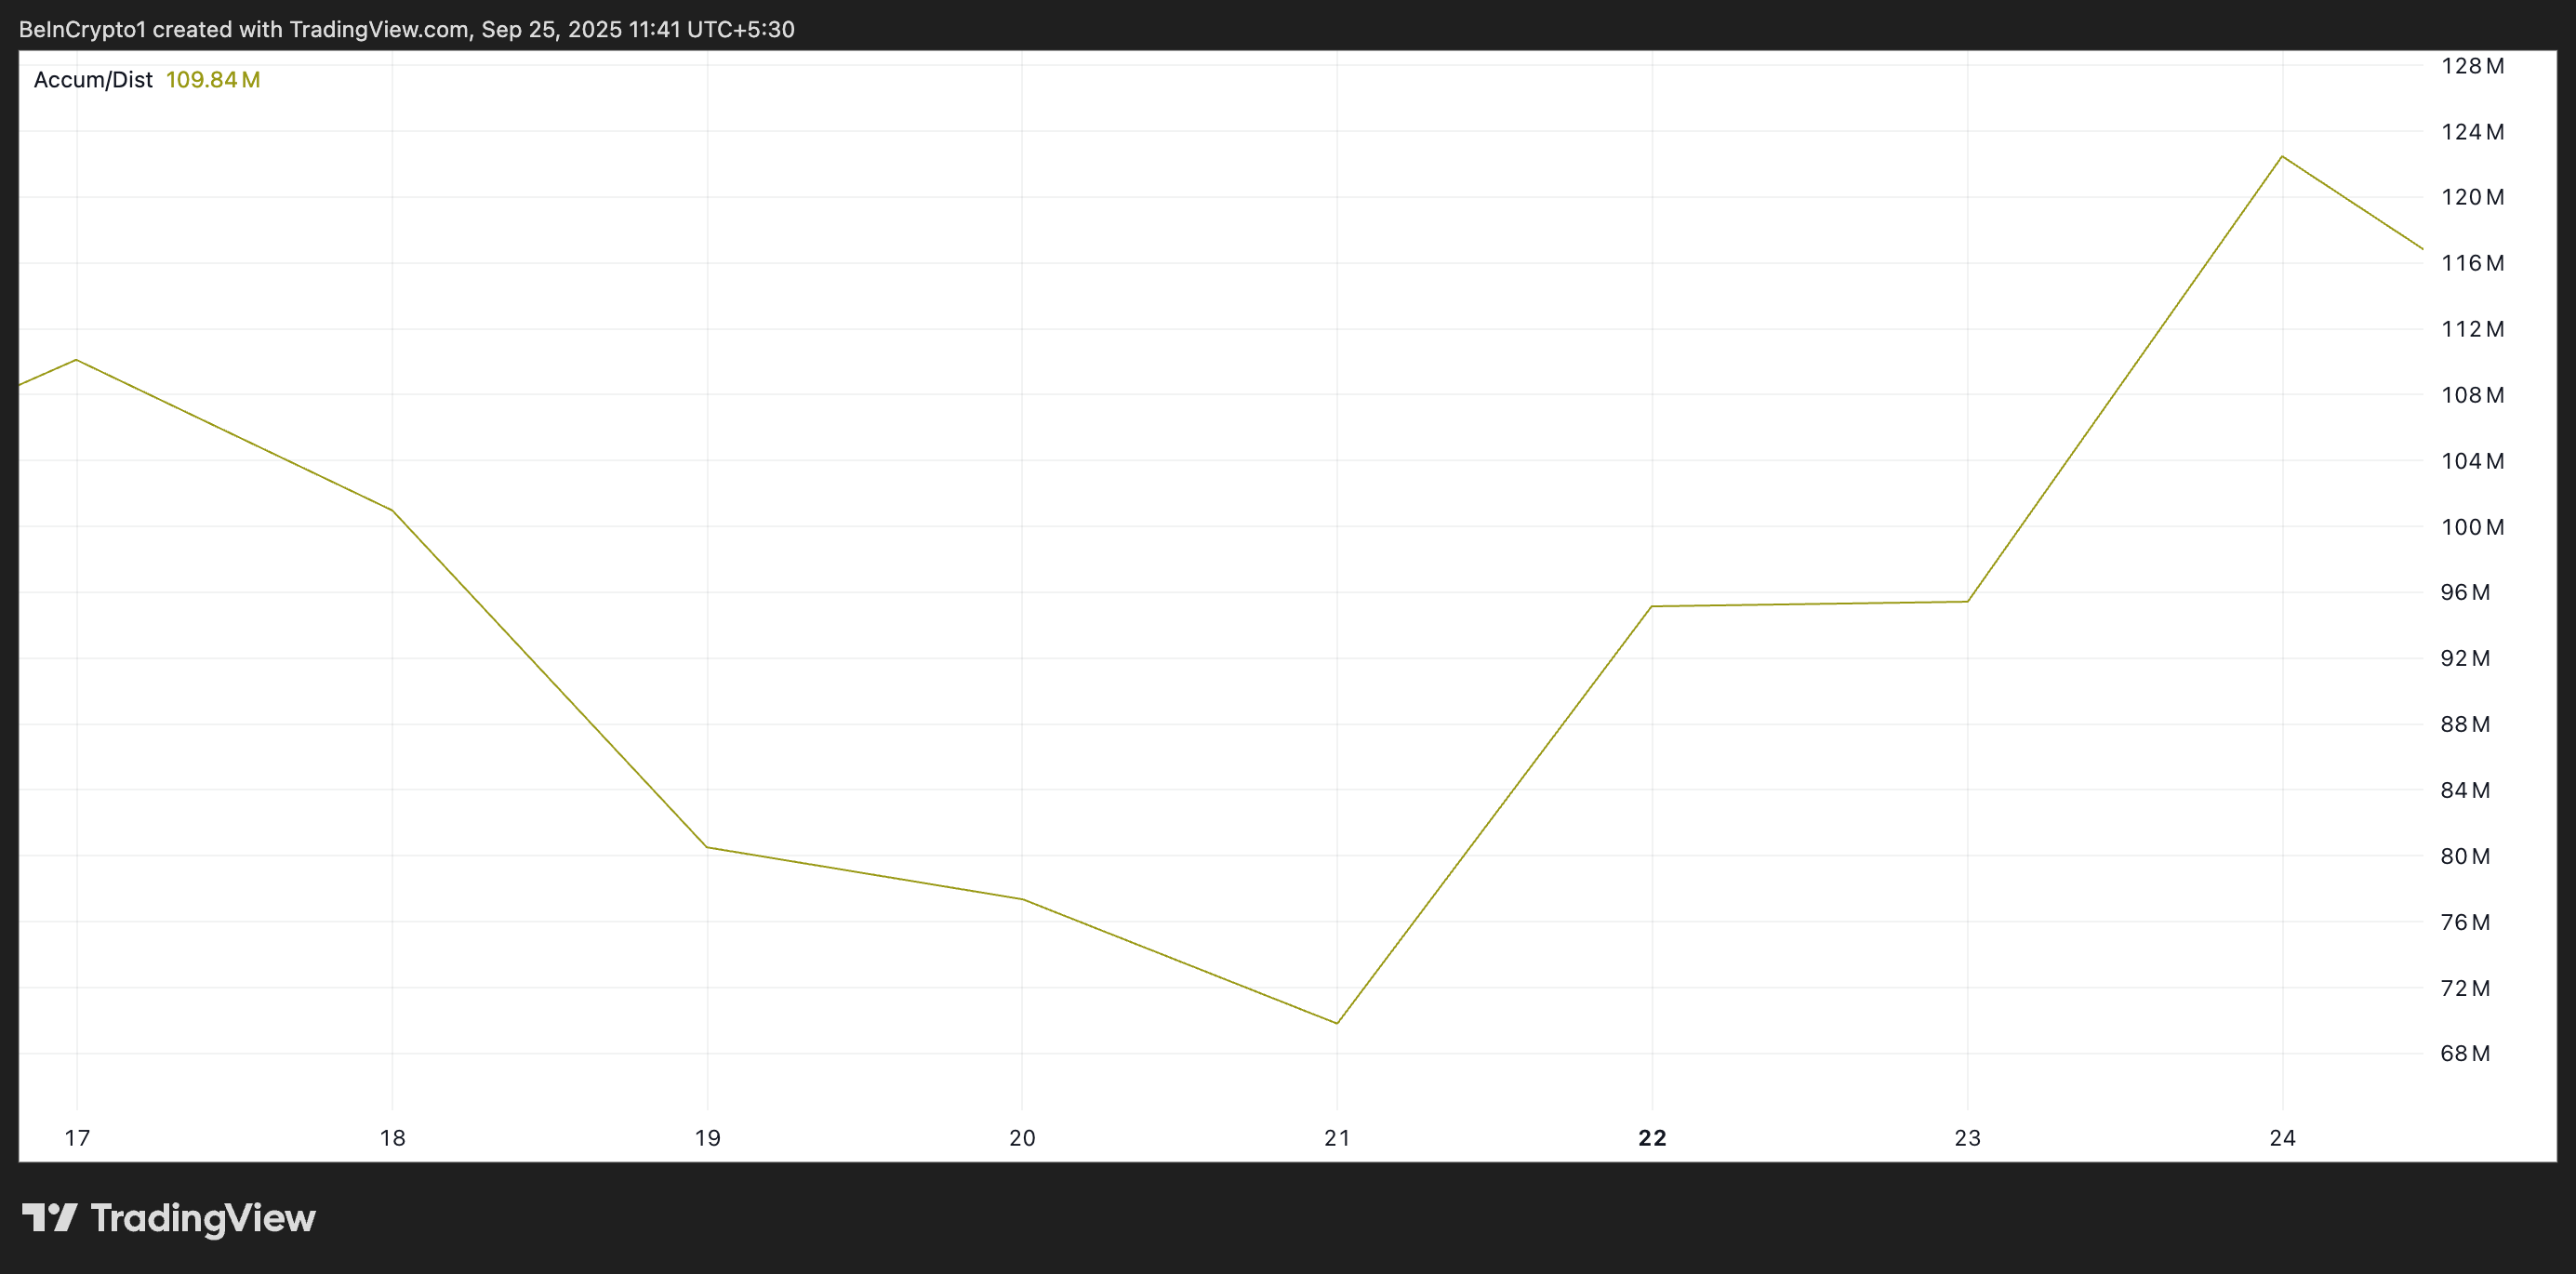
This metric measures the FLOW of capital into and out of the token. Its upward trend indicates that investors are steadily accumulating ETHFI despite broader market weakness, supporting the case for a further price rally.
ETHFI Eyes $2 Breakout, But Market Headwinds Could Stall Rally
ETHFI’s price could extend its rally if buy-side momentum is maintained. In this scenario, the altcoin could breach the resistance at $1.779 and rally toward the $2 price level.
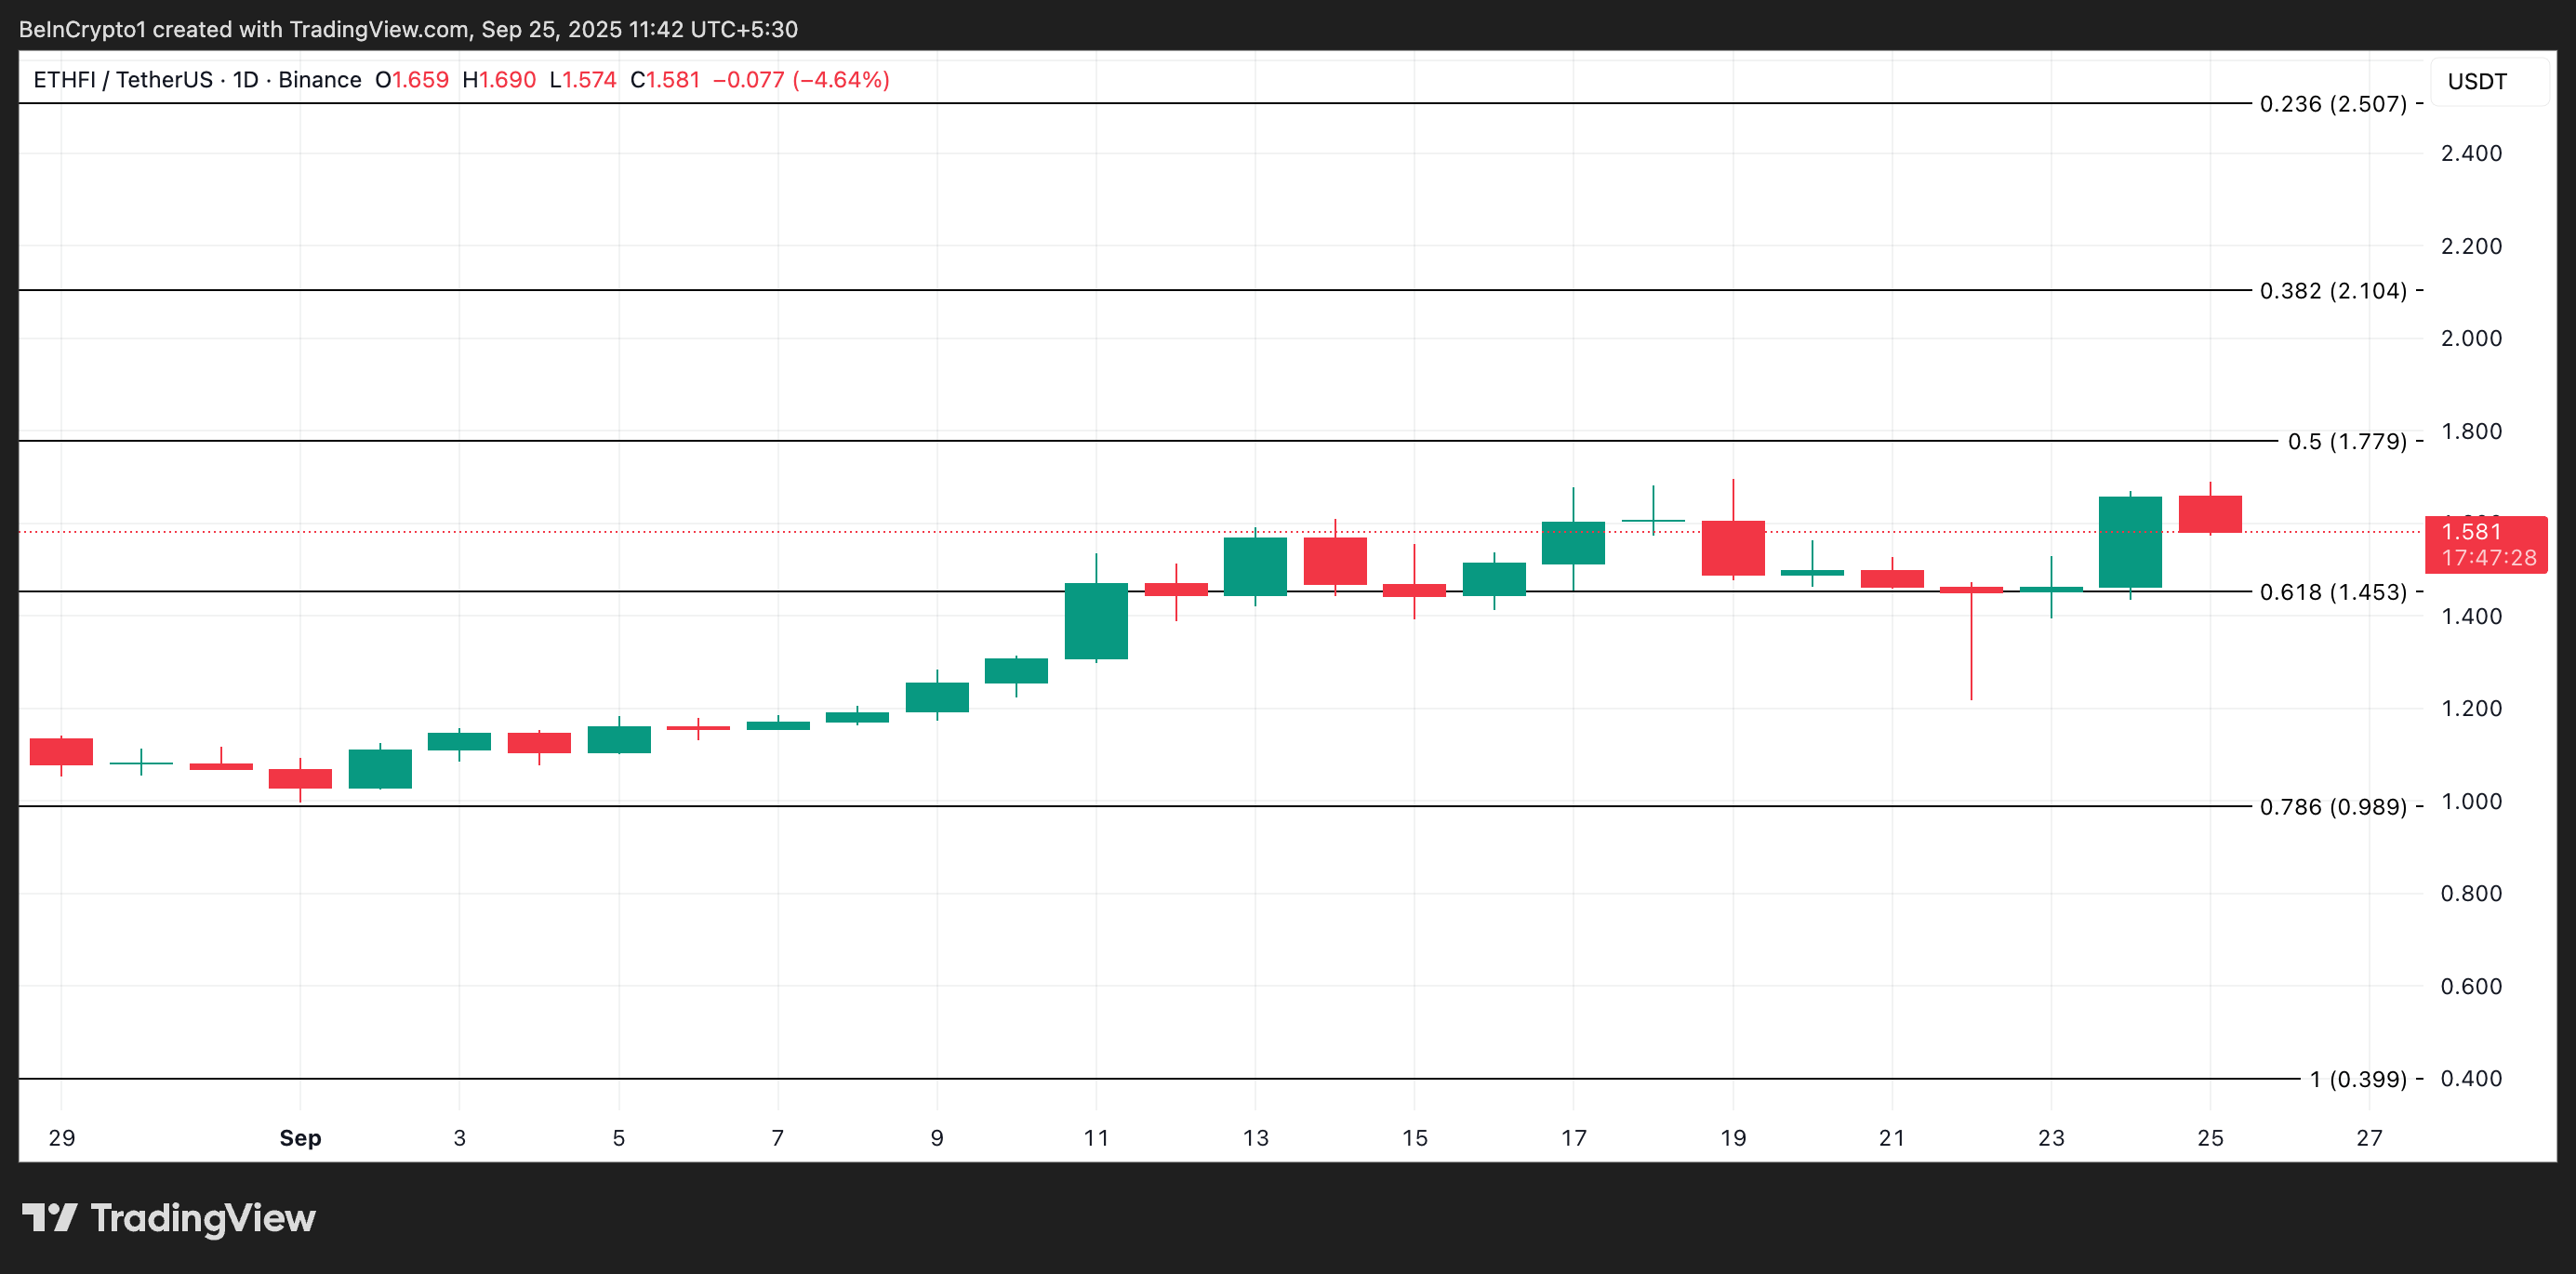
However, if the broader market downturn deepens, the token may face resistance in sustaining its gains. This could trigger an uptick in selloffs, potentially leading to consolidation around current levels. It may even lead to a decline below $1.435.
