HBAR Nears Two-Month Low as Investor Interest Wanes - Here’s Why It Matters

HBAR teeters on the edge of its lowest valuation in 60 days as capital flows elsewhere.
The Bleeding Continues
Investor appetite shrinks daily - trading volumes evaporate while larger cryptocurrencies soak up what little market enthusiasm remains. This isn't just a minor dip; it's a concerning trend that signals deeper market skepticism.
Technical Breakdown
Price action shows consistent rejection at key resistance levels. Each attempted recovery gets smothered by selling pressure, creating a pattern that would worry even the most optimistic chartists. The network's fundamental metrics aren't providing much support either.
Market Psychology Shift
Traders rotate into flashier narratives while HBAR gets left in the dust. It's the crypto equivalent of watching hedge funds chase the next shiny object while solid technology gathers dust - typical short-term thinking overshadowing long-term potential.
Don't count HBAR out just yet. Every crypto winter eventually thaws, and infrastructure projects often emerge strongest when the hype cycle resets. Sometimes the best investments are the ones nobody wants today.
HBAR Faces Rising Selling Pressure Amid Market Retreat
The setup of HBAR’s Moving Average Convergence Divergence (MACD) indicator on a daily chart highlights the negative bias toward the altcoin.
At press time, the token’s MACD line (blue) rests below the signal line (orange), while the red histogram bars have grown in size in the past three sessions, a sign that bearish activity is increasing.
: Want more token insights like this? Sign up for Editor Harsh Notariya’s Daily crypto Newsletter here.
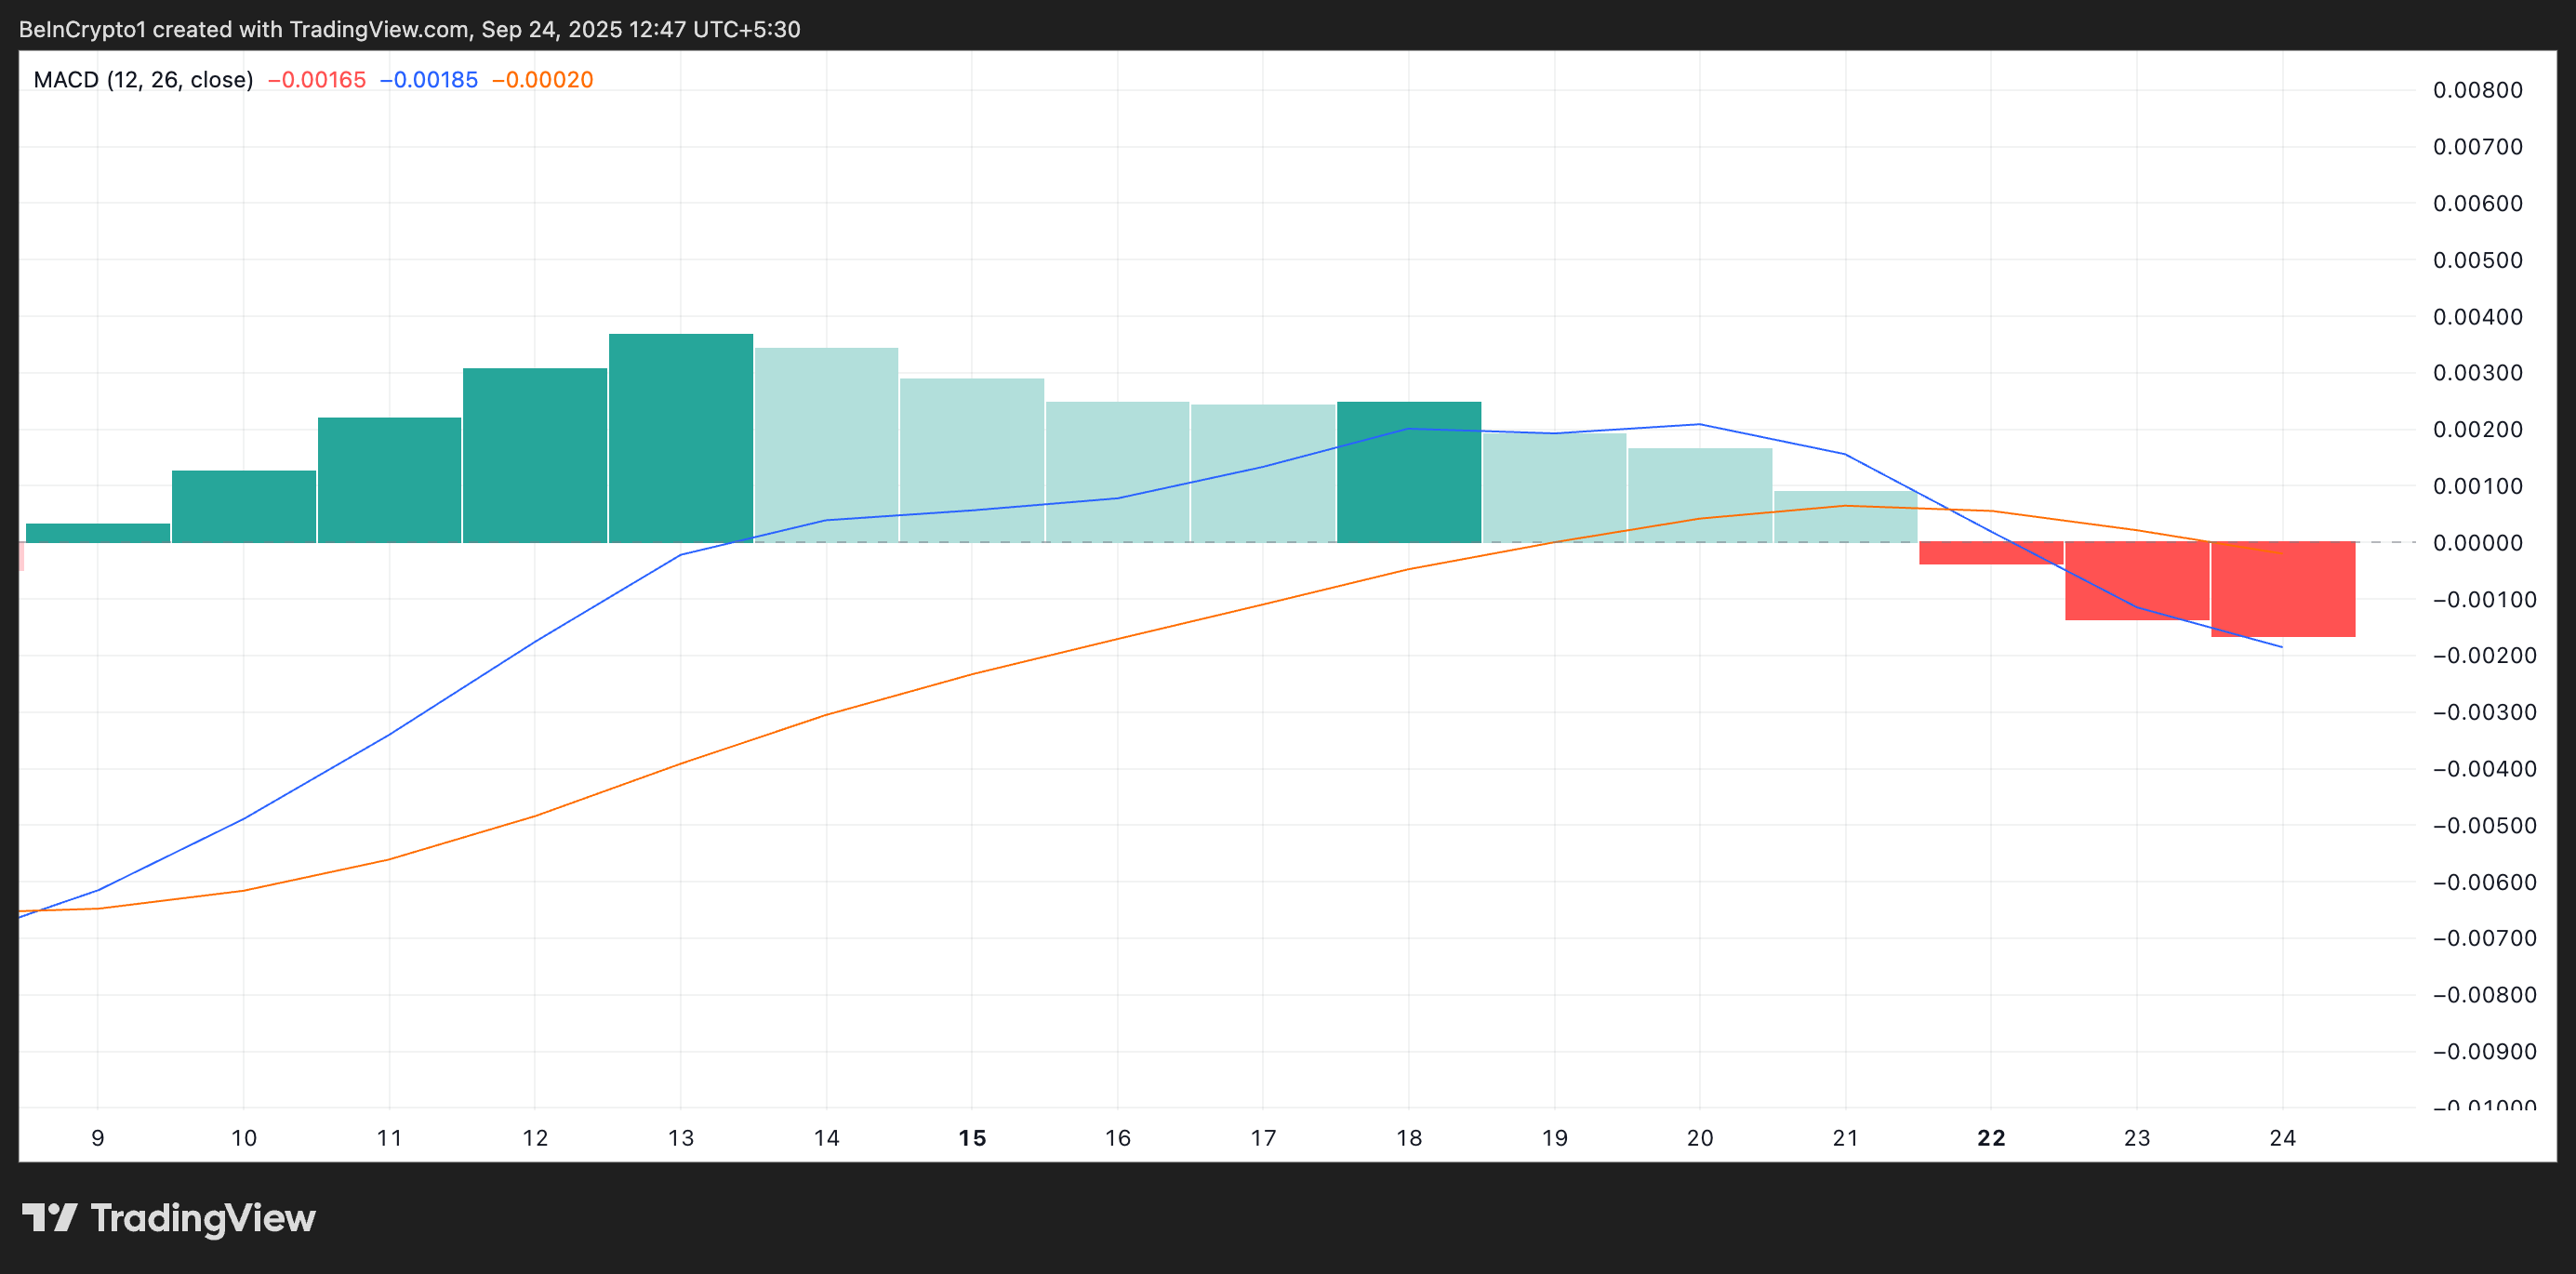
The MACD indicator identifies trends and momentum in its price movement. It helps traders spot potential buy or sell signals through crossovers between the MACD and signal lines.
When the MACD line sits above the signal line, it indicates weakening selling pressure and strengthening buy-side momentum.
Conversely, as with HBAR, when the MACD line drops below the signal line and the histogram displays expanding red bars, it signals intensifying bearish momentum and growing selling pressure in the market.
Further, HBAR’s declining futures open interest confirms the waning market participation. Per Coinglass, this currently sits at $362.49 million, down 20% over the past five days.
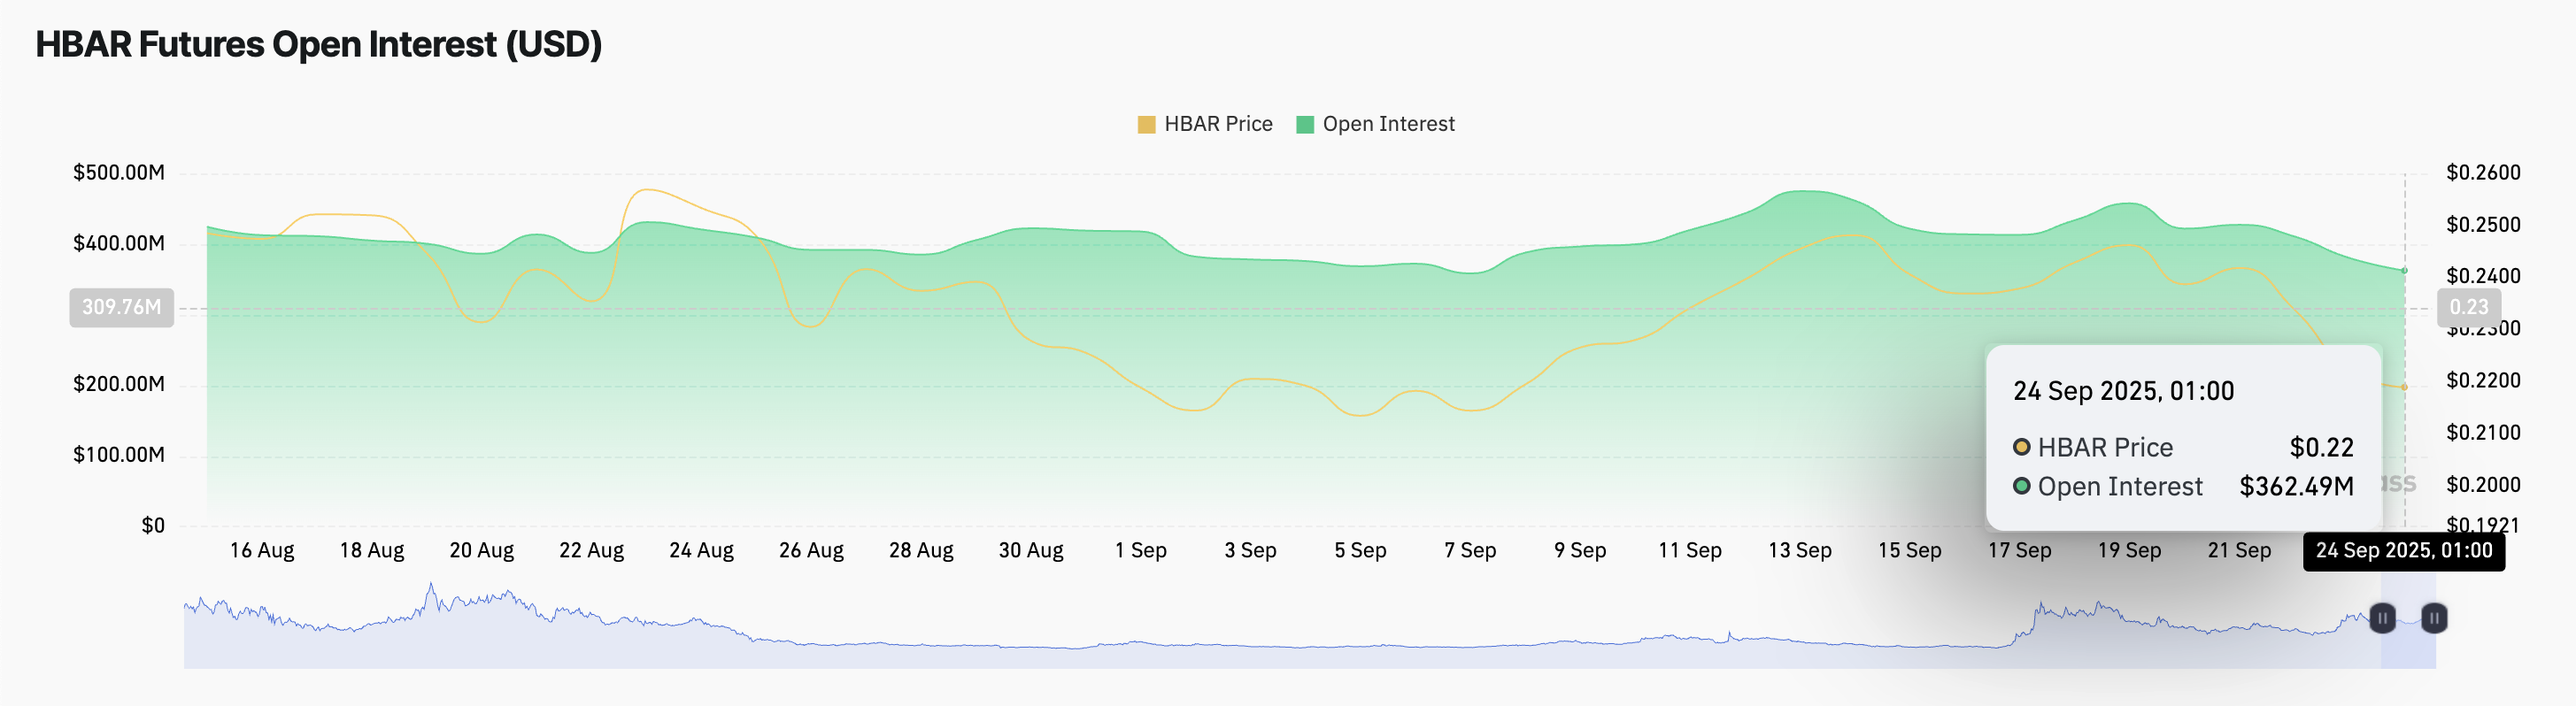
Open interest represents the total value of outstanding derivative contracts, such as futures or options, that have not yet been settled.
When an asset’s open interest dips, it indicates that traders are closing positions or stepping back from the market, reflecting reduced confidence.
For HBAR, this decline suggests that fewer investors are actively trading the token in derivatives markets, potentially leaving it more vulnerable to continued selling pressure.
HBAR May Plunge Further if Support Fails
A sustained sell-side pressure could cause HBAR’s price to test the support floor at $0.2155. If the bulls cannot defend this level, the altcoin could extend its fall and plummet to a two-month low of $0.1944.
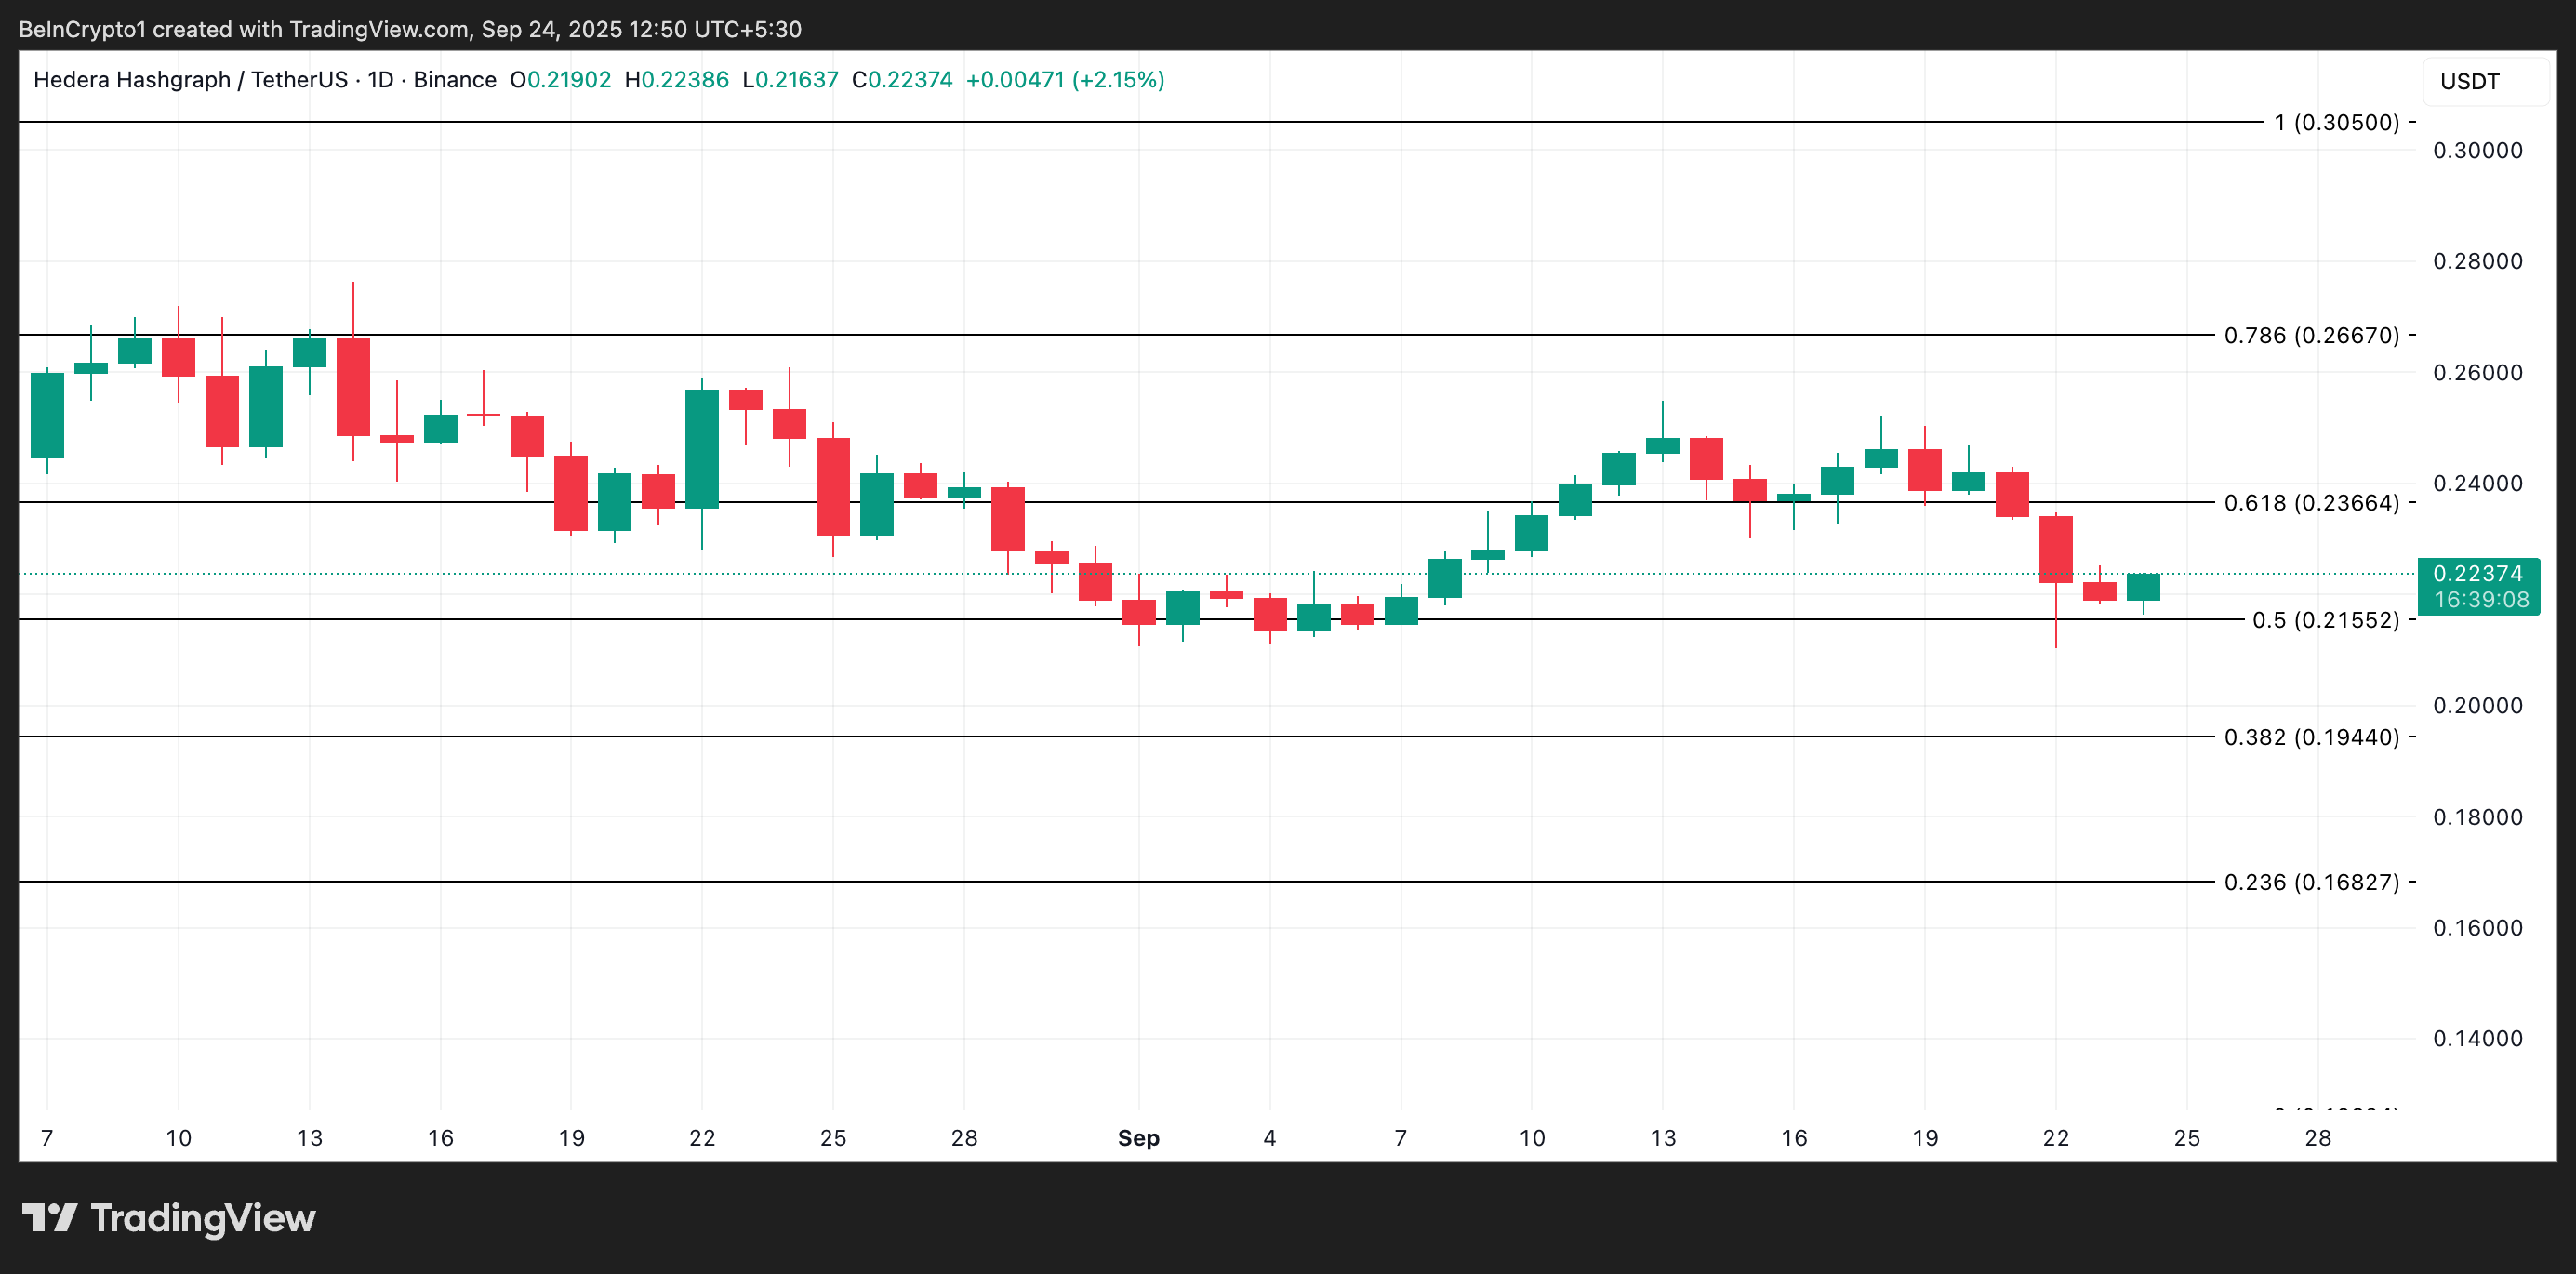
However, if new demand returns to the HBAR market, it could trigger a rally toward $0.2667.
