PI Plummets to Record Low: Recovery Ahead or Permanent $0.18 Floor?

PI token crashes through all support levels—hitting unprecedented lows that shock even seasoned traders.
Technical Breakdown
The descent to $0.18 marks a brutal capitulation phase. Trading volumes spike as panic selling overwhelms buy orders. Chart patterns show zero historical precedent for this level of downward momentum.
Market Psychology
Fear dominates sentiment. Retail holders dump positions while institutional players watch from the sidelines—another classic 'smart money waits for blood in the streets' scenario. Social sentiment indicators flash extreme bearish signals across all platforms.
Recovery Prospects
Any bounce requires massive catalyst alignment: renewed developer activity, exchange listings, or—let's be honest—another coordinated pump attempt. Technical resistance layers stack up like unpaid margin calls above current prices.
Bottom line: PI either engineers a miracle turnaround or becomes another cautionary tale in crypto's graveyard of broken promises. Because nothing says 'financial innovation' like watching your investment decay faster than a trader's moral compass.
Bulls Lose Grip as PI Crashes
The $0.32 floor was first reached on August 1 and held firm through several tests, preventing deeper losses.
However, with the continued Pi token unlocks increasing its circulating supply without a corresponding rise in demand, the support gradually weakened before finally giving way yesterday, pushing the altcoin to a new all-time low.
This breakdown suggests that sellers have firmly regained control of the market. While PI has managed a modest recovery in the past 24 hours, the bounce could be short-lived given the resurgence of bearish bias toward the token.
Sellers Take Control of PI Markets
The bearish crossover of PI’s Moving Average Convergence Divergence (MACD) highlights this shift.
: Want more token insights like this? Sign up for Editor Harsh Notariya’s Daily crypto Newsletter here.
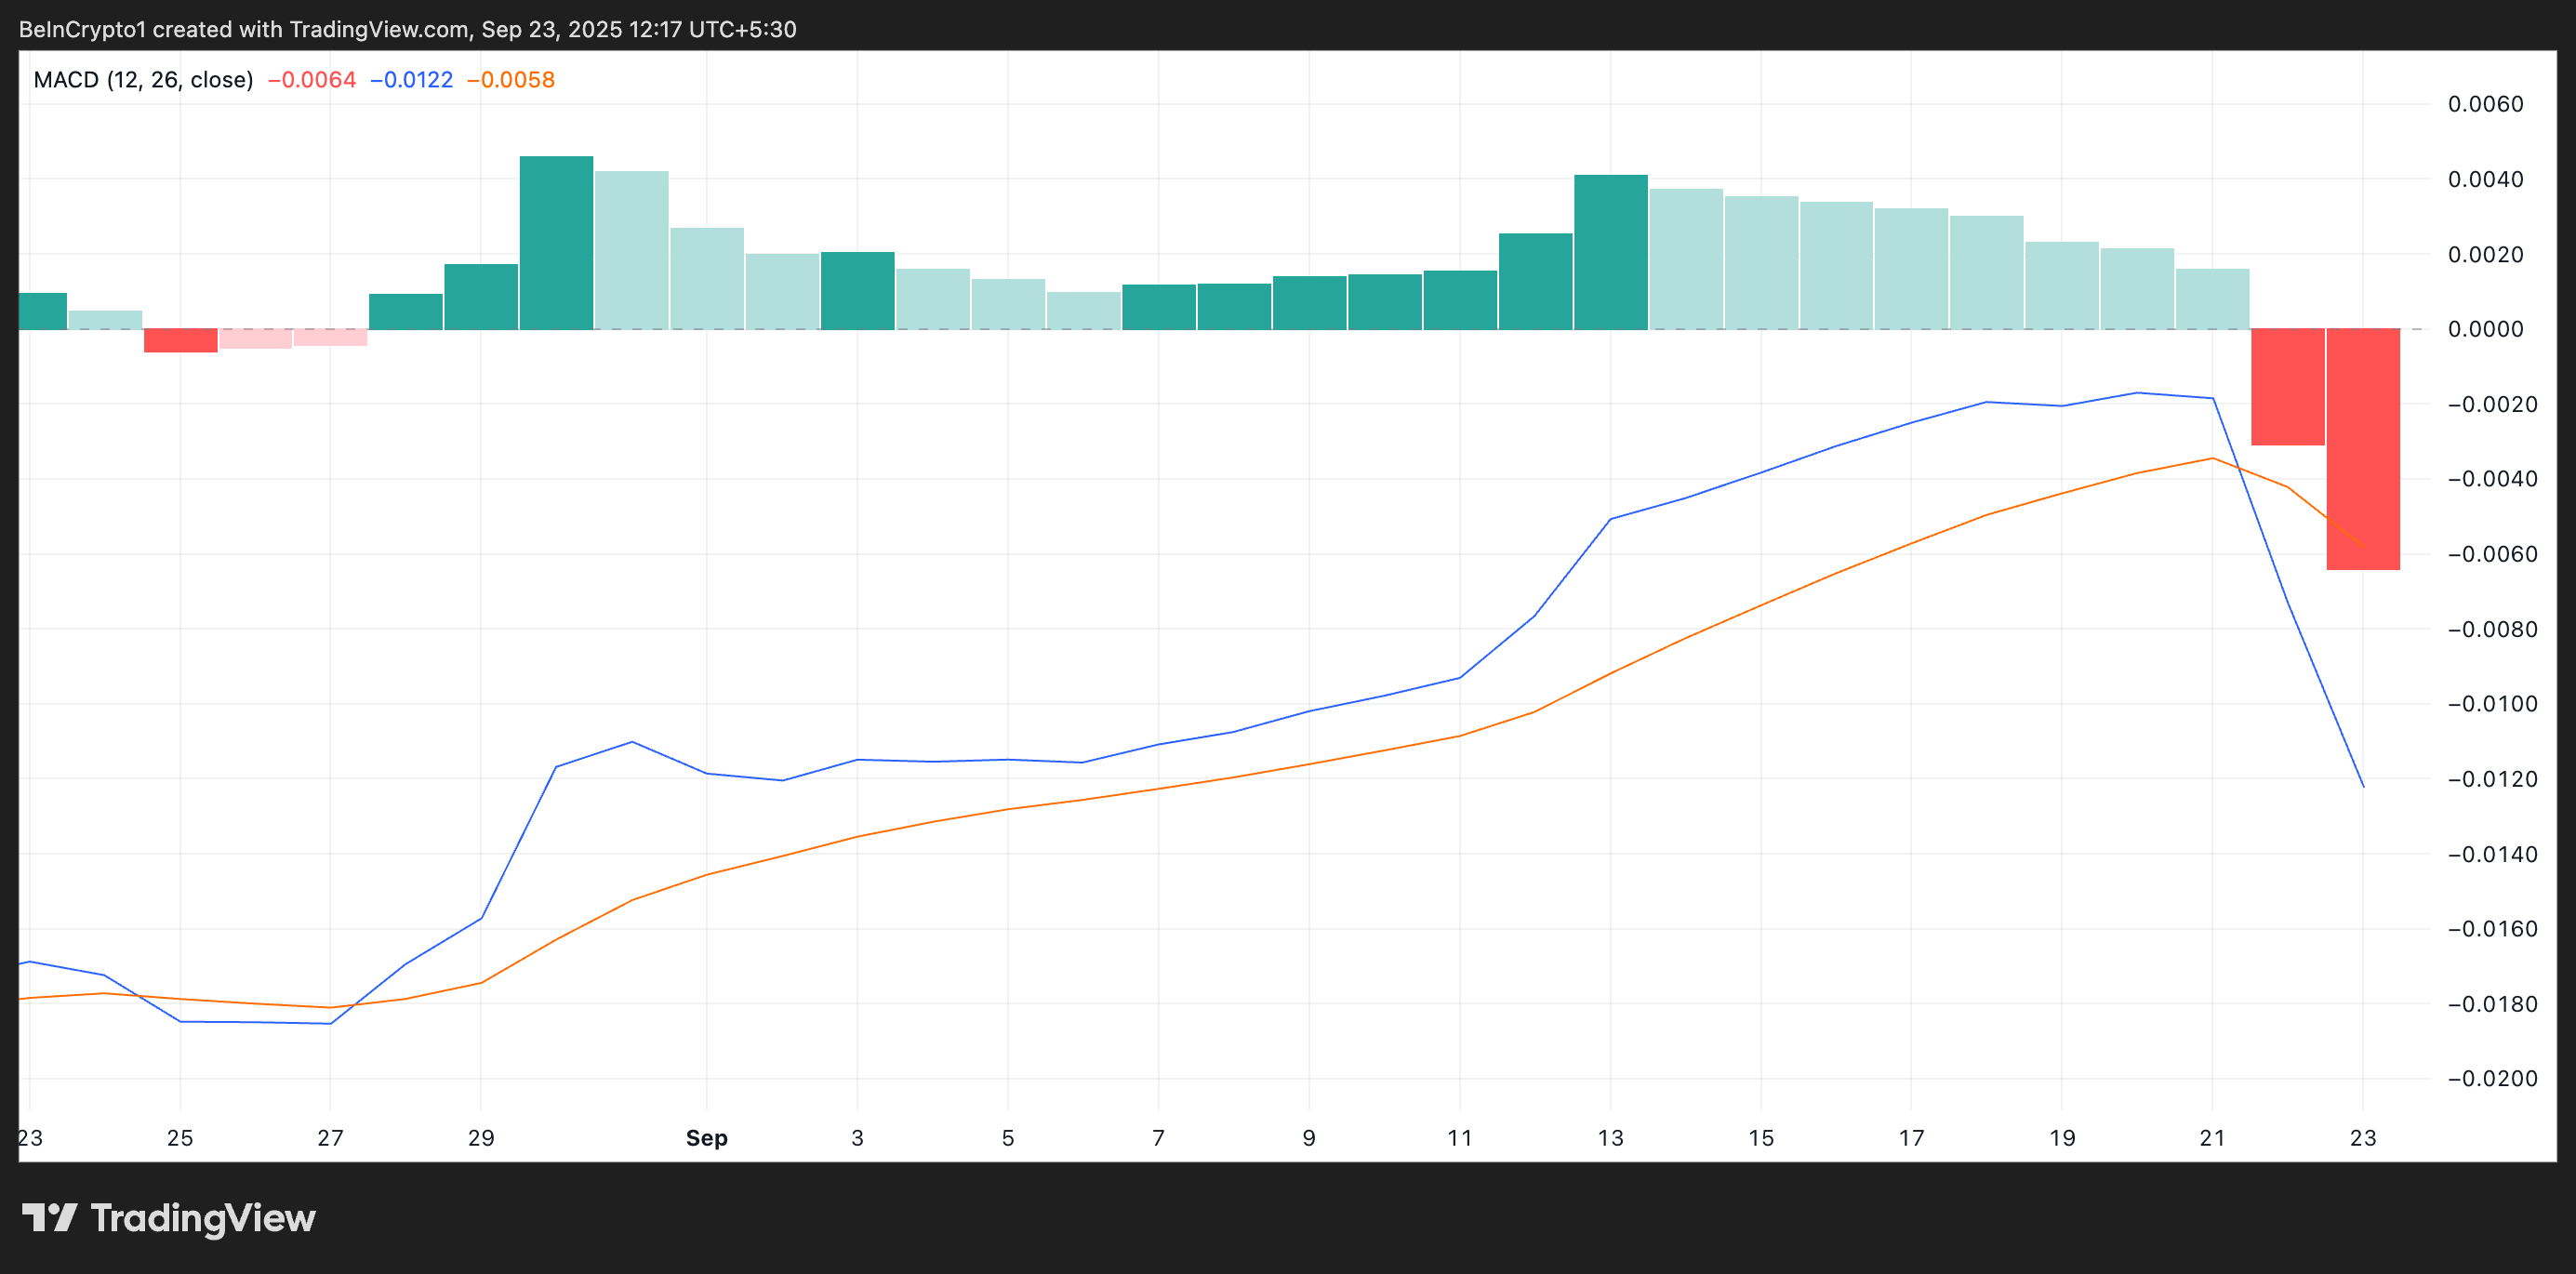
The MACD indicator helps traders gauge momentum by comparing short-term and long-term price movements. A bearish crossover forms when the MACD line (blue) crosses below the signal line (orange), indicating that downward momentum has overtaken bullish strength.
For PI, this means the broader trend favors sellers. Therefore, short-term rallies may face significant resistance.
Further, the token’s negative Balance of Power (BoP) supports this negative outlook. This is at -0.35 at press time, pointing to weak buying pressure.
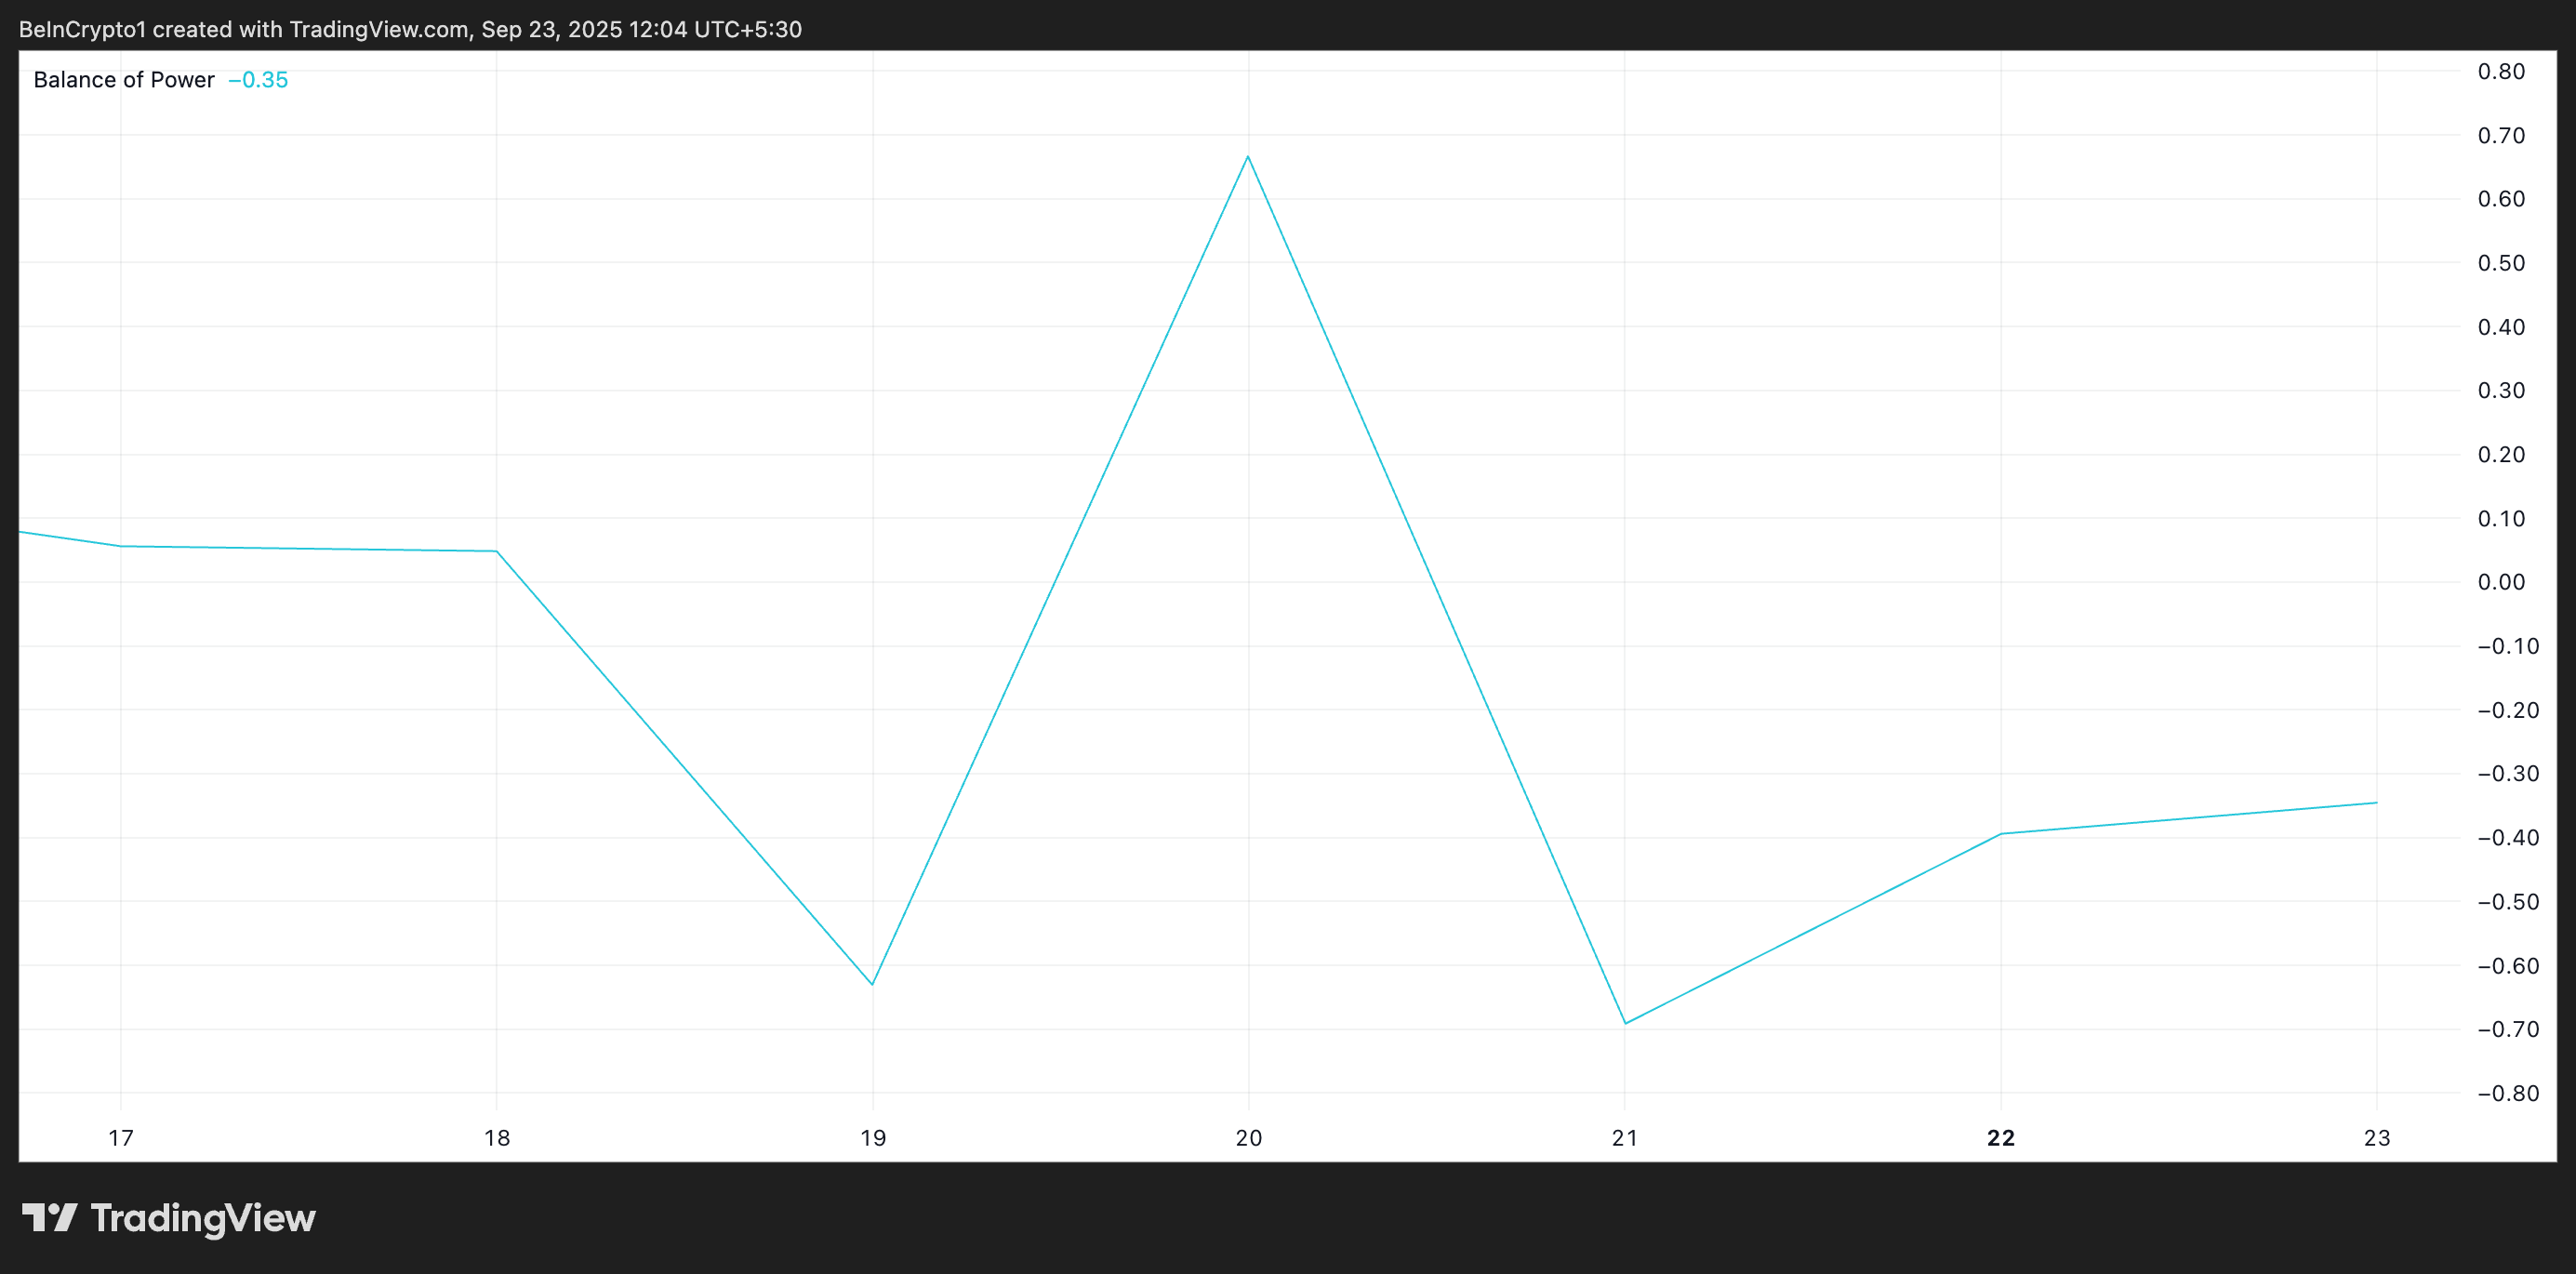
PI BoP. Source: TradingView
The BoP indicator measures the strength of buying versus selling pressure in the market, helping to identify whether bulls or bears dominate price action.
A negative BoP reading, as seen with PI, indicates that sell-side pressure is strengthening, further increasing the likelihood of more declines.
Can PI Defend $0.27 or Will Sellers Force Another Breakdown?
At press time, PI trades at $0.27, hovering above its new all-time low of $0.18. PI could retest this low if seller confidence grows and token distribution continues. Should the bulls fail to defend it, it could open the door to deeper declines.
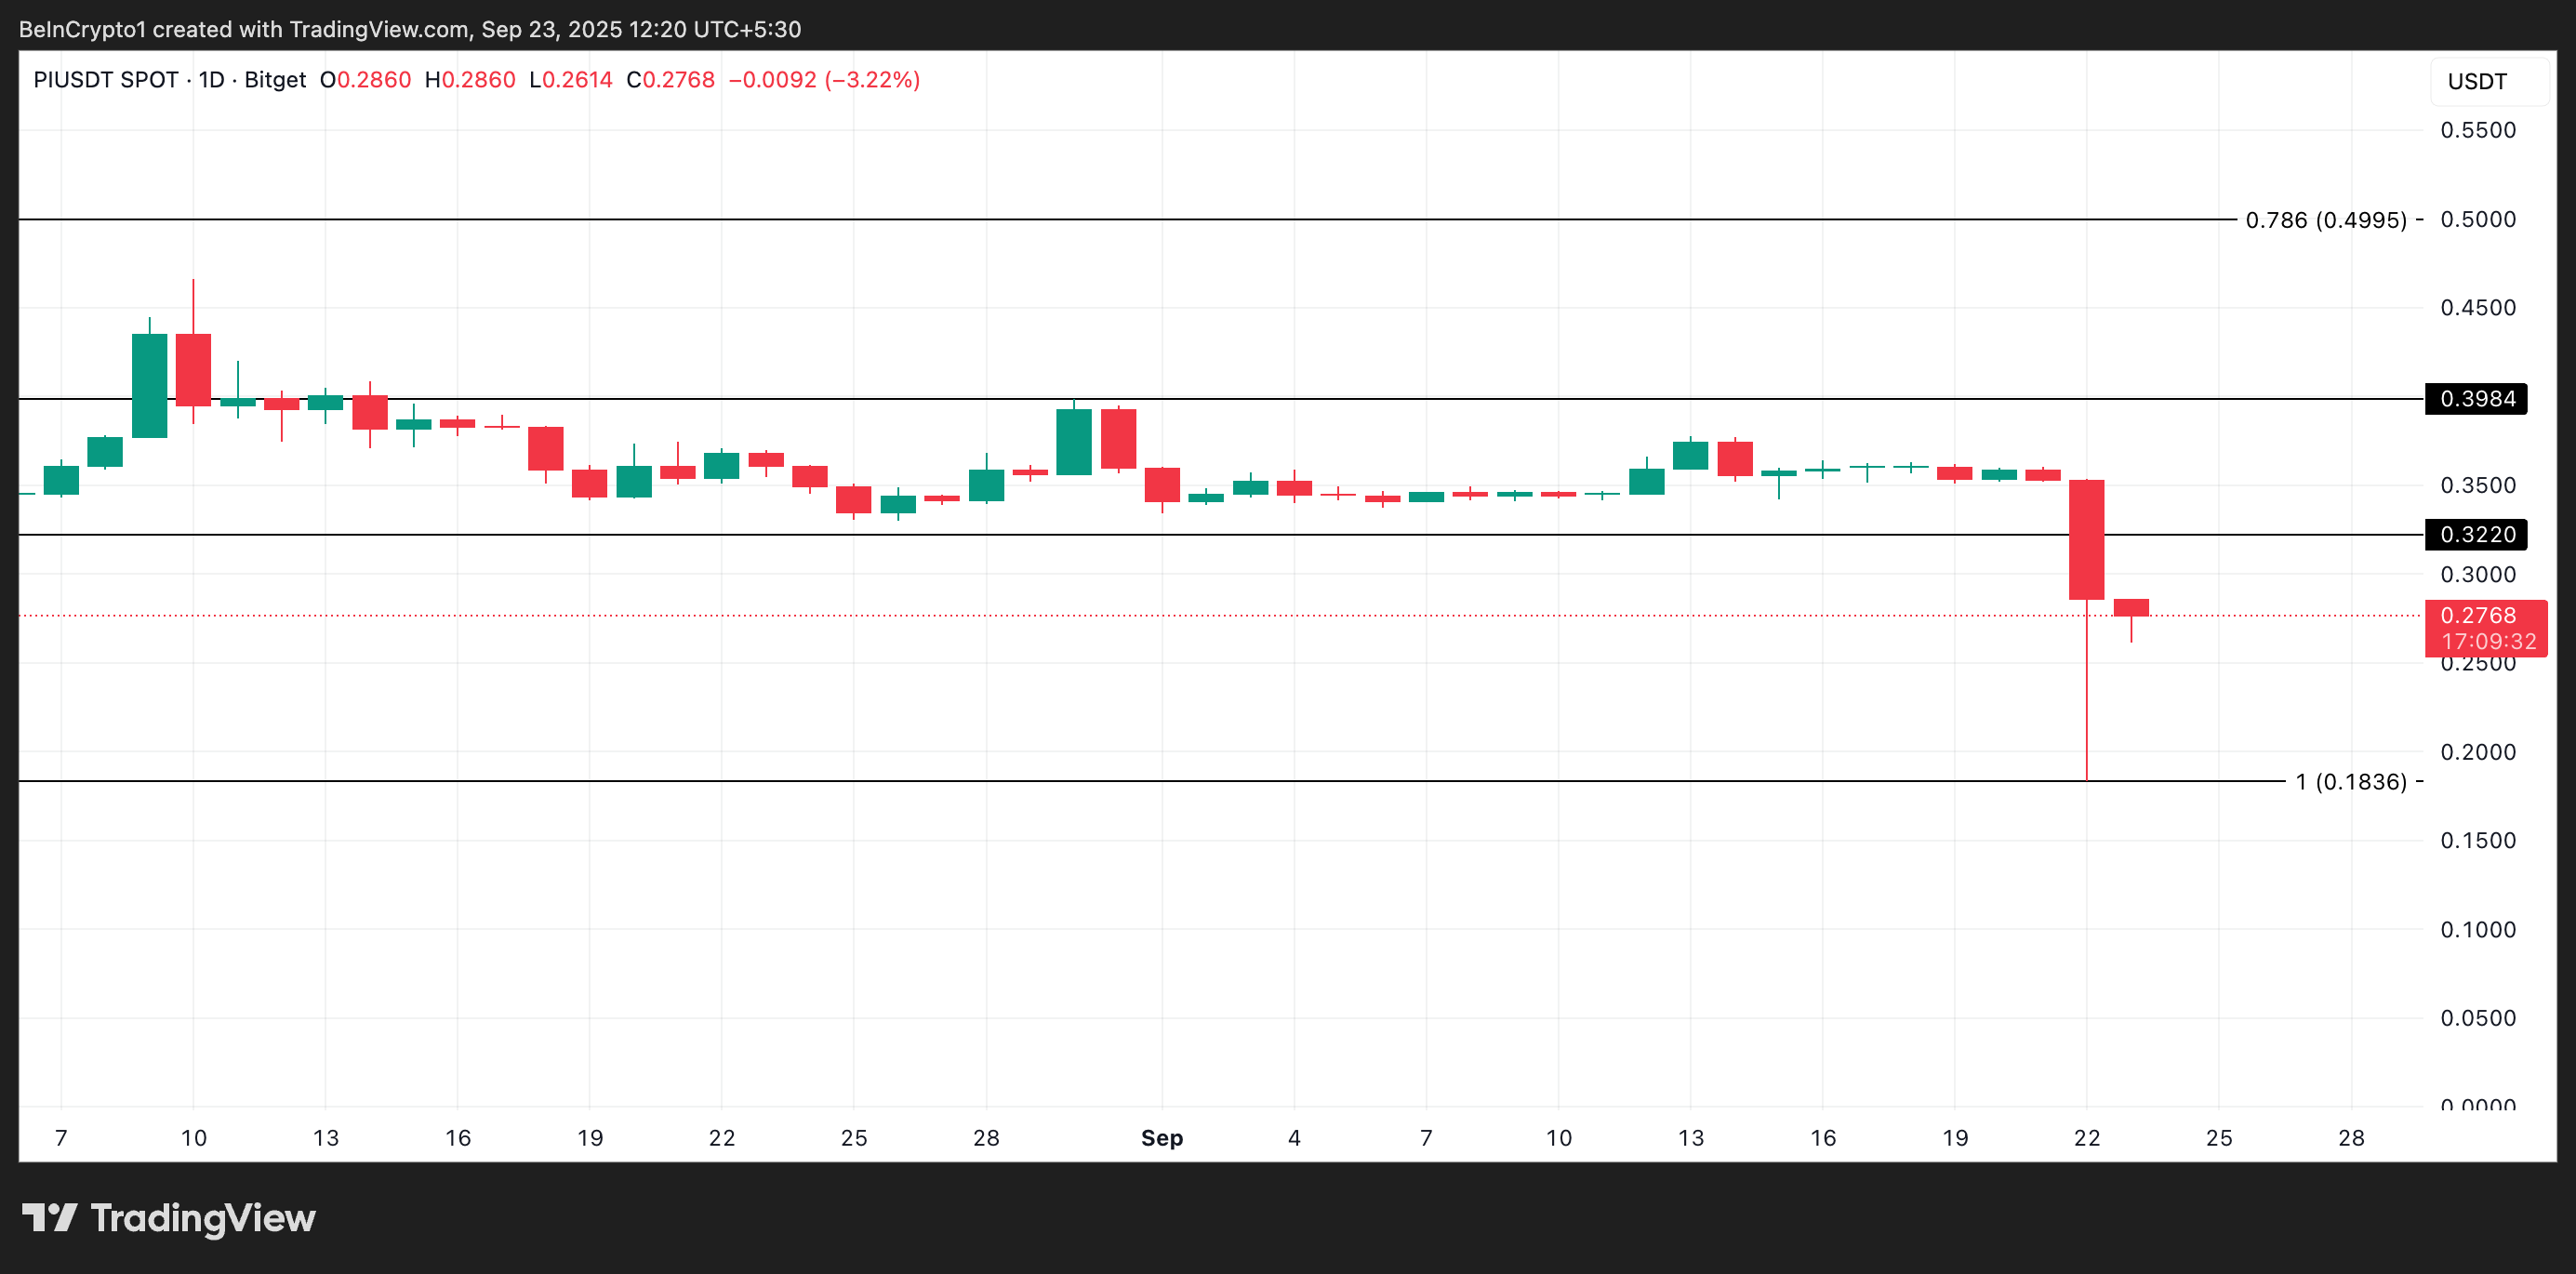
However, if the buyers make a re-entry, they could attempt a break above the previous all-time high of $0.32, which now forms a resistance above PI’s price. If successful, the token could climb toward $0.43.
