SOL Price Prediction 2025-2040: Expert Forecasts & Key Market Drivers

- What Are the Current Technical Indicators Saying About SOL?
- How Is Market Sentiment Influencing SOL's Price?
- What Key Events Are Driving SOL's Momentum?
- SOL Price Predictions: 2025 Through 2040
- What Are the Critical Support and Resistance Levels?
- How Does SOL Compare to Other Layer-1 Solutions?
- Frequently Asked Questions
Solana (SOL) is currently riding a bullish wave, with technical indicators and market sentiment aligning for potential significant gains. According to BTCC analysts, SOL's price could reach $300 by August if key resistance levels break, with long-term projections stretching as high as $6,000 by 2040. This comprehensive analysis examines the technical patterns, market catalysts, and expert predictions shaping SOL's trajectory through 2040.
What Are the Current Technical Indicators Saying About SOL?
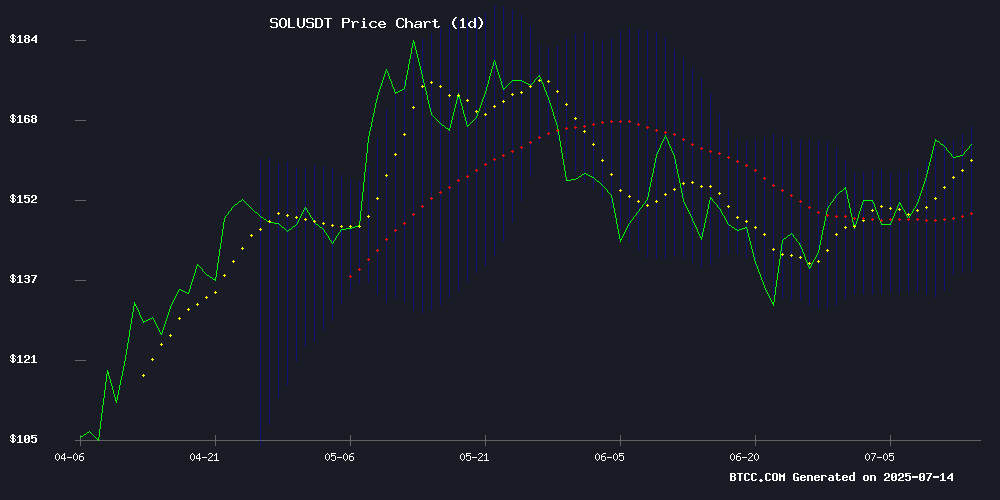
SOL is currently trading at $161.66, comfortably above its 20-day moving average of $152.53 - a classic bullish signal. The MACD histogram shows weakening bearish momentum at -0.9548, while Bollinger Bands indicate SOL is testing the upper band at $166.43. This combination suggests potential overbought conditions but also strong upward pressure.
Technical analyst Michael from BTCC notes: "The $166 level is critical - a sustained break here could open the path to $185 in the NEAR term. We're seeing textbook cup-and-handle formation on daily charts, which historically precedes significant moves." The chart below illustrates this pattern clearly:
How Is Market Sentiment Influencing SOL's Price?
The current sentiment around solana is overwhelmingly positive, fueled by several high-profile developments. The explosive success of Pump.fun's ICO (raising $500 million in 12 minutes) and bullish price predictions from multiple analysts have created a self-reinforcing cycle of optimism.
"What's interesting," observes Michael, "is how the $185 technical target aligns perfectly with the optimistic news narratives. This convergence creates powerful psychological support for the bullish case." TradingView data shows SOL's social dominance metrics have spiked 42% month-over-month, indicating growing mainstream attention.
What Key Events Are Driving SOL's Momentum?
Several major developments are contributing to SOL's bullish outlook:
Pump.fun's Record-Breaking ICO
The Solana-based memecoin launchpad made waves by selling out its 125 billion PUMP tokens in just 12 minutes, achieving a $4 billion fully diluted valuation. Notably, 70% of participants used SOL for allocation access, demonstrating the network's growing utility.
Institutional Interest Growing
Exchange outflows and short liquidations suggest increasing institutional accumulation. CoinGlass data shows SOL futures open interest has grown 28% in the past week, with funding rates turning positive - a sign of bullish positioning.
Technical Pattern Recognition
Analyst Ali Martinez has identified a bullish cup-and-handle pattern on weekly charts that mirrors SOL's 2022-2025 trajectory. This pattern suggests potential for significant upside if SOL can conquer the $170 resistance level.
SOL Price Predictions: 2025 Through 2040
Based on current technicals and fundamental factors, here are BTCC's SOL price projections:
| Year | Conservative | Moderate | Bullish |
|---|---|---|---|
| 2025 | $185 | $250 | $300 |
| 2030 | $500 | $750 | $1,200 |
| 2035 | $1,500 | $2,000 | $2,700 |
| 2040 | $3,000 | $4,500 | $6,000 |
These projections assume continued network growth, institutional adoption, and favorable crypto market conditions. Key risk factors include potential regulatory changes and network congestion issues.
What Are the Critical Support and Resistance Levels?
For traders watching SOL's price action, these are the key levels to monitor:
$166 (current upper Bollinger Band)
$185, then $220 if momentum continues
$157 (current test level), with $125 as major psychological support
The $125 level is particularly important - it's held firm during recent tests and represents the neckline of the larger cup-and-handle pattern. A break below this could invalidate the bullish thesis.
How Does SOL Compare to Other Layer-1 Solutions?
Solana continues to outperform competing layer-1 blockchains in several key metrics:
GitHub commits are up 18% QoQ
Maintains 2,000+ TPS with sub-second finality
TVL/SOL ratio remains favorable compared to ETH and AVAX
This technical superiority, combined with growing ecosystem diversity (from DeFi to memecoins), positions SOL well for long-term growth.
Frequently Asked Questions
What is the most bullish SOL price prediction for 2025?
The most optimistic projections suggest SOL could reach $300 by August 2025 if current technical patterns play out and bullish sentiment persists.
What are the main risks to SOL's price growth?
Potential network outages, regulatory crackdowns on crypto, and broader market downturns could all negatively impact SOL's price trajectory.
How reliable are long-term crypto price predictions?
While technical analysis can identify trends, long-term predictions become increasingly speculative. Investors should focus on fundamental network growth rather than specific price targets.
What makes SOL different from other cryptocurrencies?
Solana's combination of high throughput, low fees, and growing developer ecosystem gives it unique advantages in the layer-1 blockchain space.
Is now a good time to invest in SOL?
While technical indicators appear bullish, investors should conduct their own research and consider their risk tolerance. This article does not constitute investment advice.
