Bitcoin’s Suspended Animation: Demand Drought or Strategic Accumulation Phase?
BTC's price action flatlines—but is this the calm before the storm or warning signs of fading interest?
The Big Question
Market veterans are split: sideways trading either signals institutional accumulation or retail exhaustion. On-chain metrics show exchange outflows increasing—smart money loading up while weak hands exit.
Technical Tightrope
The $64K support level holds…for now. Any decisive break below triggers algorithmic sell walls. Meanwhile, derivatives traders keep leverage in check—no wild speculation like 2021's casino atmosphere.
Macro Headwinds
Traditional markets wobble as the Fed plays 'will-they-won't-they' with rate cuts. Bitcoin's correlation with tech stocks resurfaces—just when crypto maximalists thought we'd decoupled.
The Bottom Line
This isn't stagnation—it's compression. Like a coiled spring, BTC builds energy for its next violent move. And when it comes? Wall Street will pretend they saw it coming all along.

Source: CryptoQuant
Bitcoin’s UTXOs in Loss surged 42.81% to 12.23 million, while UTXOs in Profit slipped 1.2% to 305.15 million.
This indicates that a notable portion of recent buyers entered at higher prices and are now holding underwater positions. So the stress is localized, not market-wide, at least for now.

Source: CryptoQuant
Are buyers still here?
The BTC Taker Buy/Sell Ratio ticked up to 1.028, a 1.04% gain that put buy-side takers slightly ahead.
This level, just above the neutral line, implies that perpetual market participants remain cautiously optimistic. However, the modest strength in buy volume does not signal a full-blown bullish breakout.
This subtle buying interest hints at conviction but without the noise.

Source: CryptoQuant
BTC volatility remains elevated, yet controlled.
The latest reading of 0.011 shows sharp spikes but no follow-through. These bursts have been frequent since mid-April but haven’t flipped the overall trend.
This tells us something simple: traders are alert, not alarmed. Volatility might look wild on the chart, but it’s not tipping the market into chaos.

Source: Santiment
What does the crash in network growth mean for Bitcoin demand?
Bitcoin’s Network Growth nosedived from over 500K to 76.5K, a steep drop that could signal weakening user interest.
This contraction shows a significant decline in new addresses interacting with the network, indicating a slowing of organic demand.
The spike in June likely resulted from temporary excitement that could not be sustained.

Source: Santiment
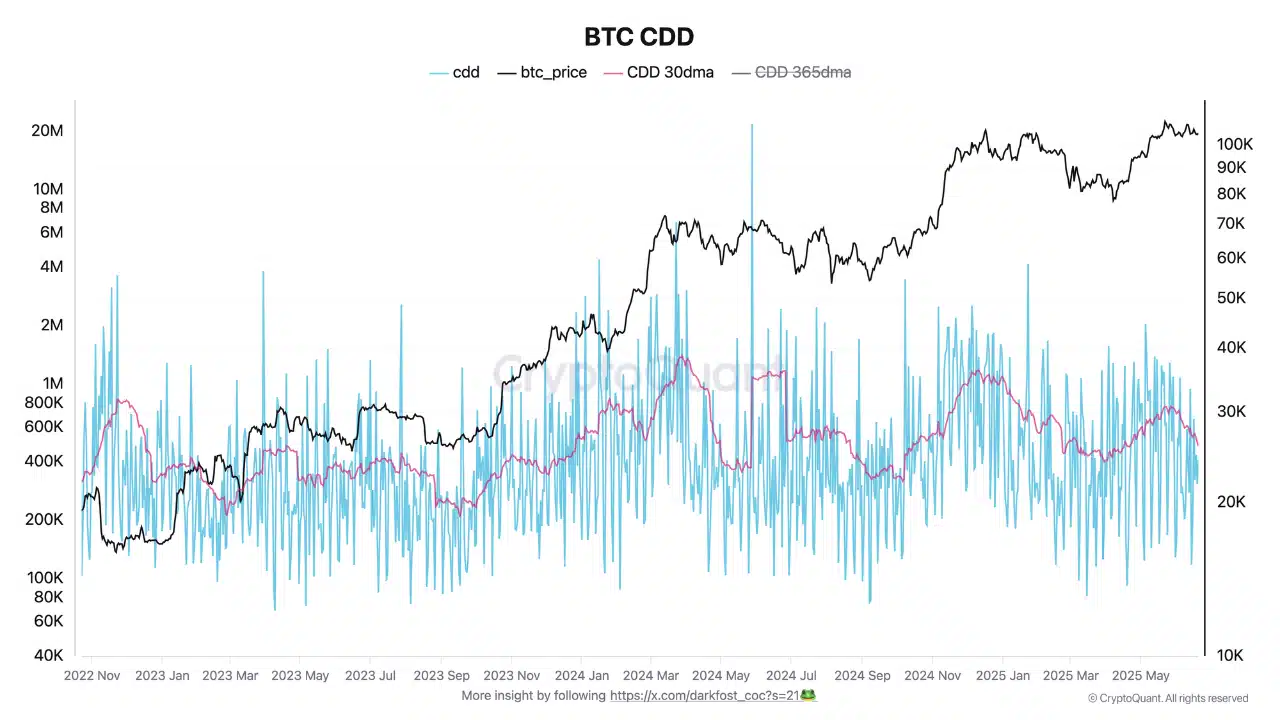
Put it all together, fewer long-term sellers, rising unrealized losses, modest buy pressure, and cooling network growth, and you get a market in limbo.
Bitcoin isn’t signaling a top, but it’s not charging ahead either. Until on-chain indicators like Network Growth or Taker activity strengthen, BTC may stay stuck in consolidation, quietly coiling for its next move.
Subscribe to our must read daily newsletter

