Solana Whiplash: $3.55B Flees as Holders Hit the Panic Button – Can SOL Stage a Comeback?

Solana's network just got rocked by a tsunami of sell orders—$3.55B worth of SOL dumped in a frenzy. Was it overleveraged degens or just traders front-running the next 'macro downturn' narrative? Either way, the order books look like a crime scene.
The silver lining? Solana's survived worse. The chain’s throughput still laughs at Ethereum’s gas fees, and memecoin degenerates haven’t abandoned it yet. But with Bitcoin ETFs sucking up all the institutional oxygen, SOL’s recovery hinges on something crypto hasn’t seen in years: actual utility.
Funny how a 'high-performance blockchain' can still get kneecapped by the oldest force in finance—sheer, unbridled panic.
LTHs are now selling their SOL
Data from Coin Days Destroyed (CDD), which tracks the last time long-term holders moved their assets to determine potential buying or selling behavior, indicated a clear selling trend.
Typically, selling is assumed when long-term holders MOVE their assets after a prolonged period of inactivity.
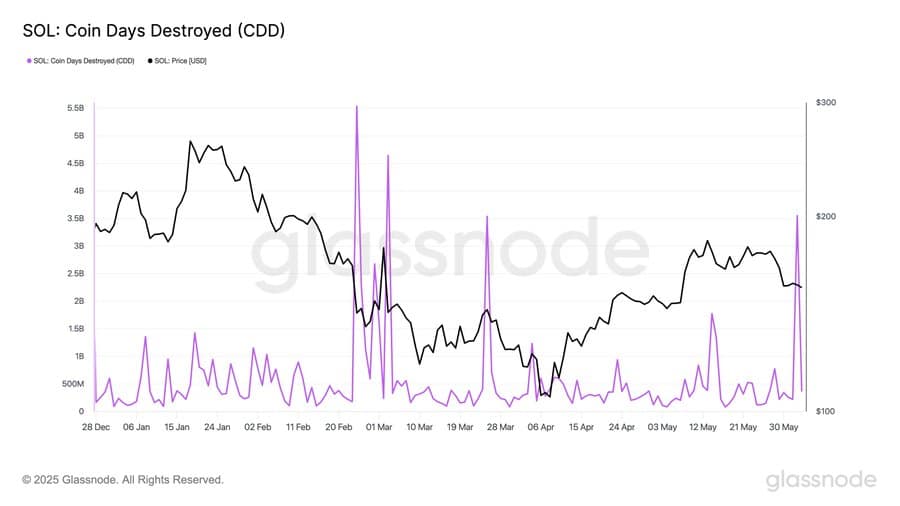
Source: Glassnode
This is the third-largest CDD event for SOL, with $3.55 billion worth of tokens moved.
It is surpassed only by the $5.53 billion moved on the 26th of February and $4.64 billion on the 3rd of March.
Such a significant movement WOULD usually have a major impact on SOL’s price, contributing to further decline. However, this hasn’t been the case. SOL has managed to maintain relative balance in the market.
This limited price impact can be attributed to bullish activity from both spot and derivatives investors, who continue to support the asset.
Accumulation is on the rise
In the spot market, Solana’s exchange netflow—measuring the inflow and outflow of SOL between exchanges and private wallets—indicates growing bullish sentiment.
At present, there has been a major outflow of SOL from exchanges, confirming increased buying activity. Interestingly, the purchased SOL is being moved into private wallets, suggesting long-term holding.

Source: Coinglass
In the past 48 hours alone, investors have purchased and moved over $12 million worth of SOL. So far this week, total purchases have reached $71.70 million.
Derivative traders are reflecting similar sentiment. The OI-Weighted Funding Rate has climbed significantly, entering positive territory.

Source: CoinGlass
At 0.0060% at press time, this rate indicates that open derivative contracts are largely dominated by traders betting on a price rally.
More indicators support a potential rally
On the charts, SOL appears well-positioned for a rally, as indicated by the Bollinger Band Indicator.
The Bollinger Band helps identify support (lower band) and resistance (upper band) levels for an asset. At the time of writing, SOL has touched the lower band.

Source: TradingView
The last time SOL traded at this level, it experienced a 79% rally.
If the current setup mirrors previous patterns, SOL has a strong chance of returning to the $180–$200 range on the charts.
Subscribe to our must read daily newsletter
