Coinbase Drops RENDER—So Why Is This Token Gunning for a 15% Surge?

Delistings usually spell doom—but RENDER’s chart tells a different story. Defying the odds, the decentralized GPU token eyes a double-digit rebound despite Coinbase’s cold shoulder.
Market mechanics or pure hopium? Traders pile in as technicals hint at bullish divergence. Shorts get squeezed while long-term holders double down—classic crypto theater.
Here’s the kicker: exchanges control the gates, but decentralized protocols write their own rules. Just don’t mention the ’fundamentals’ to the Wall Street suits still trying to NFT their business cards.
Expert’s bold prediction for RENDER
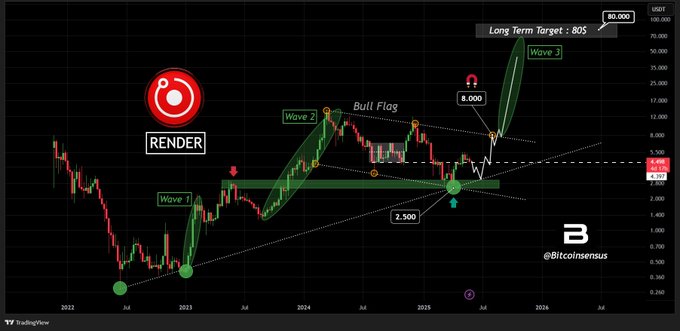
Despite the negative sentiment, an expert is sharing a bullish view, stating that there is nothing to worry about in the bigger picture, RENDER remains intact, and maintains a bullish outlook.
Source: X (Formerly Twitter)
In a post on X, an expert noted that RENDER has been forming a bullish flag pattern on the weekly timeframe, with a technical target of $80.
The expert further added that while short-term volatility is expected, the technical trajectory remains clear.
This bold prediction by a well-followed expert reflects the strong conviction of investors who continue to believe in Render, despite the lack of major gains in recent years.4
Current price momentum
At press time, the token was trading NEAR $4.41, having recorded a 1% price decline over the past 24 hours.
During the same period, due to its recent delisting and ongoing market uncertainty, investor and trader participation plummeted, leading to an 18% drop in trading volume, as revealed by CoinMarketCap.
Considering the current market sentiment and the recent delisting, the expert prediction appears to be unachievable due to RENDER’s past performance.
Therefore, AMBCrypto finds it worthwhile to share the short-term price action based on the asset’s historical performance.
RENDER price action and key levels
According to the TradingView chart, RENDER was in a downtrend at the time of writing, trading below the 200 Exponential Moving Average (EMA) on the daily timeframe.
The 200 EMA is a technical indicator that helps traders and investors determine whether an asset is in an uptrend or downtrend, enabling them to make informed decisions.

Source: Trading View
Despite being in a downtrend, RENDER has been trading above the key support level of $4.20. This level acts as a make-or-break point for the asset.
Since late April 2025, the asset has received multiple supports at this level, and each time it has registered a modest upside move.
If this time RENDER holds above the $4.20 level, there is a strong possibility it could soar by 15%, reaching the $5.20 level or even higher if the sentiment remains positive in the future.
On the other hand, if it fails and closes a daily candle below the $4.10 level, it could drop by 25% and may reach the $3.05 level ahead.
Subscribe to our must read daily newsletter
