Bitcoin Shatters Correlation with Gold – Here’s Why Traders Should Care

Gold bugs and crypto maximalists just lost their common enemy. Bitcoin’s price action is now marching to its own drum—diverging sharply from the safe-haven metal that dominated 20th-century portfolios.
What changed? Institutional adoption. With BlackRock’s ETF inflows hitting record highs and microstrategy still hoarding coins like digital Scrooge McDuck, BTC isn’t just ’digital gold’ anymore—it’s becoming its own asset class.
Wall Street analysts (the same ones who called crypto a scam in 2018) are suddenly scrambling to update their correlation models. Meanwhile, gold ETFs bled $2.6B last quarter—but sure, keep telling us about ’store of value.’
This decoupling matters because: 1) It proves crypto markets are maturing beyond reactive risk-on/off behavior, and 2) Portfolio managers can no longer pretend they’re ’diversified’ by holding both. The era of lazy comparisons is over.

Source: TradingView
This shift has led the asset to lose its correlation with Gold, but there’s more to it, and what it could mean for Bitcoin’s price.
Bitcoin loses correlation, but at what cost?
Reports from Glassnode suggest that Bitcoin has lost its correlation with Gold, based on the 30-day chart.
Per the analysis, the correlation between both assets now stands at negative 0.54, marking its lowest level since February 2025.
A close look at the chart shows that the last time this occurred, there was a significant liquidity outflow from Bitcoin, while Gold saw a notable inflow.
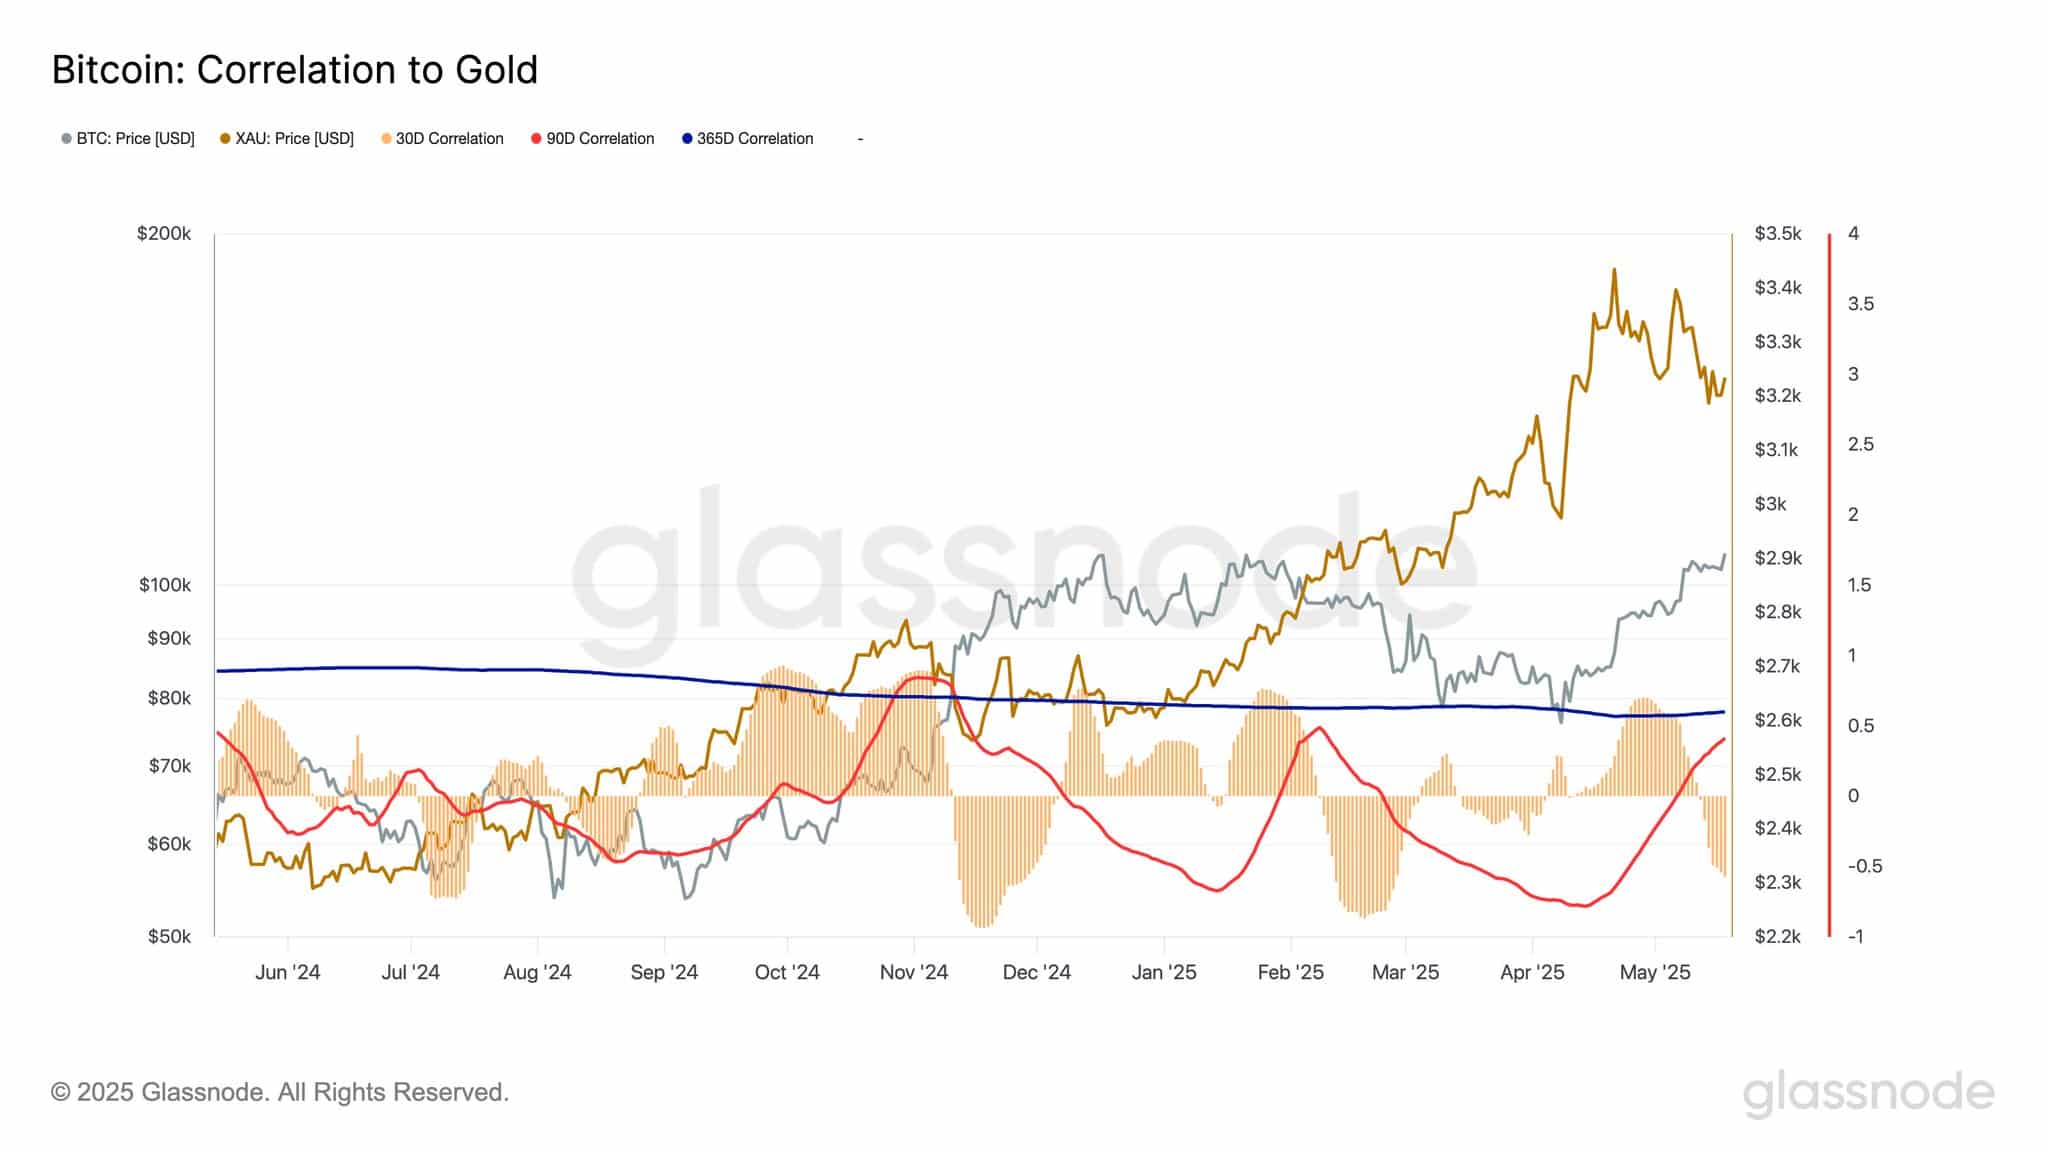
Source: Glassnode
Between November and December, when the 30-day correlation dropped to this level, bitcoin surged while Gold declined.
Given these contrasting market movements, AMBCrypto examined additional factors to assess Bitcoin’s potential trajectory.
Where is liquidity going?
Two key metrics were used to determine the liquidity FLOW in the market: Exchange Reserve and Exchange Netflow.
The Exchange Reserve simply calculates the amount of the asset available on exchanges.
A drop in this metric implies there are fewer Bitcoin on exchanges, increasing the tendency for holding and reducing immediate selling pressure.

Source: CryptoQuant
At the time of writing, the Exchange Reserve has dropped to a new all-time low of approximately 2.43 million Bitcoin.
Not only has the Bitcoin reserve continued to drop, but the amount of Bitcoin being bought has also been on the rise.
This is confirmed by the Exchange Netflow, which measures the difference between buying and selling activity for Bitcoin in the market.
When the netflow is red, it means more Bitcoin has been bought than sold. When it’s green, it implies there is more selling than buying.

Source: CryptoQuant
Observing the chart closely, more red has appeared, confirming strong purchase sentiment.
If this buying trend continues, alongside a drop in reserves and a more negative netflow, it could significantly support further upward movement.
What does cooling whale activity mean?
Whale activity on exchanges has continued to drop, particularly in the past 24 hours, plunging to a new low.
This could suggest several things. However, based on current market activity, it’s likely that whales are preparing for long-term holding.

Source: CryptoQuant
This forecast aligns with the decline in exchange reserves, suggesting that whales who previously accumulated large amounts of Bitcoin have yet to MOVE their holdings.
If this holding trend persists, it could strengthen BTC’s potential for an upward breakout, possibly surpassing its current consolidation phase.
Subscribe to our must read daily newsletter
