Bitcoin’s 4-Year Cycle Hints at $131K Surge This October—Here’s the Data Behind the Rally

Bitcoin’s price history follows eerie patterns—and right now, the charts scream bullish. Every four years, like clockwork, BTC slashes through resistance after its halving. This cycle? It’s pointing straight at $131K by October.
Halvings cut supply. Traders chase scarcity. Then comes the pump—assuming Wall Street doesn’t ‘discover’ another reason to short crypto right before takeoff. Past performance isn’t gospel, but when the math lines up this cleanly? Even skeptics lean in.
Key triggers: ETF inflows, macro instability, and that beautiful, brutal supply shock. Buckle up.
Will Bitcoin’s cost basis hold or fall?
Analysis of Bitcoin’s Short-term Holder (STH) Cost Basis, used to determine potential market trend and asset direction, showed that the asset is at a critical juncture.
In fact, on the hourly chart, Bitcoin crossed its STH cost basis at $93,145. Of course, sustaining above this level remained crucial for maintaining bullish momentum and aiming for new all-time highs.
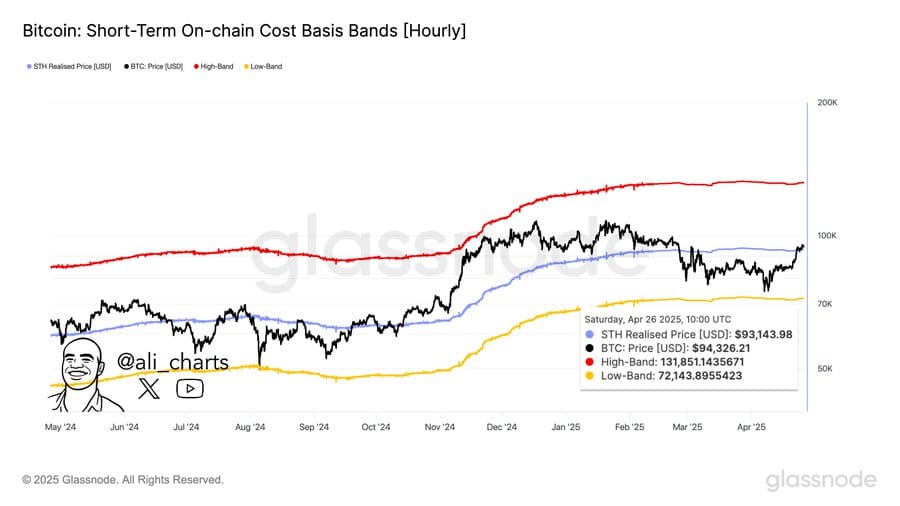
Source: Glassnode
The pattern consists of two key levels: the upper band at $131,800 and the lower band at $71,150.
When the asset is above the mid-range (STH Cost Basis), like it currently is, it signals a bullish indicator of a potential rally, but it requires further momentum to sustain this run to the upper region.
Further analysis showed that Bitcoin is likely to maintain that momentum, trending to the upside.
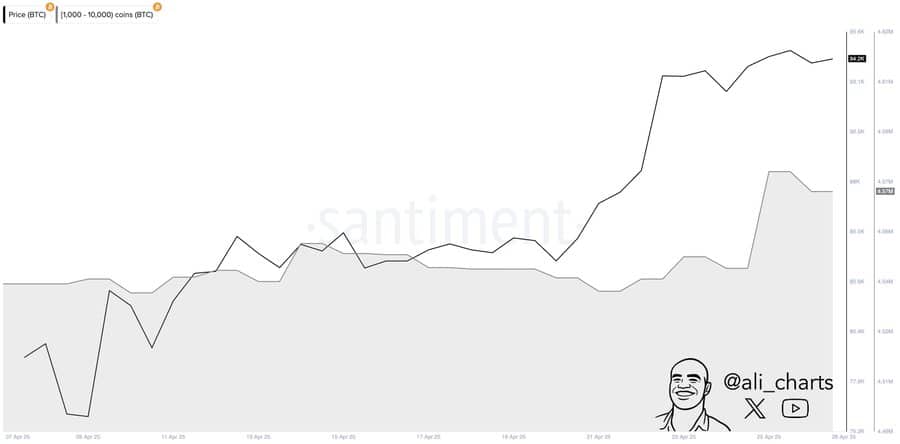
Source: Santiment
Moreover, further analysis revealed strong accumulation trends.
In the past 48 hours alone, Santiment data showed 20,000 BTC, worth $1.86 billion, had been purchased from the market.
A significant purchase like this tends to back Bitcoin’s price move, adding to its momentum and price rally potential.
What does this fractal pattern mean?
Interestingly, analysis by Alphractal showed that Bitcoin indicated a similar phase of a pattern it has repeated since 2015, across all four cycles.
Per the analysis, which has helped mark Bitcoin’s market tops and bottoms precisely at determined dates, Bitcoin is still in the markup phase.

Source: Alphractal
A markup phase is a period in the market where an asset continues to rally following a period of accumulation. This current phase shows that the asset will continue to rally until it hits the cycle top.
The market top is predicted to be reached between the 12th and 16th of October, and followed by a year of decline.
Should this analysis hold like in the previous four-year cycles, it suggests that Bitcoin is likely to trade into the STH cost basis top at the $131,800 region on the chart.
What’s next for Bitcoin
Analysis on the monthly time frame suggests that Bitcoin is bullish. The market has just reacted off a key ascending support line that has led to a market rally since 2018.
This rally would be more bullish once the resistance level at the $102,000 region is breached, establishing new highs.

Source: TradingView
This pattern is important as it has occurred severally times and, when breached to the lower side, was reclaimed.
With this possibility at hand, the asset would continue its rally streak, continuing to increase in value.
Take a Survey: Chance to Win $500 USDT
