Bitcoin’s Market Trajectory Mirrors 2018 Patterns – Is a 2025 Bull Run Imminent?

As Bitcoin’s price action in 2025 exhibits striking similarities to its 2018 behavior, market analysts are closely monitoring whether history will repeat itself with another bullish cycle. The current technical formations, including support/resistance levels and moving average convergences, align closely with pre-bull market conditions observed seven years prior. Traders are evaluating key indicators such as the Mayer Multiple, Puell Multiple, and on-chain accumulation trends to assess the likelihood of sustained upward momentum. With halving-related supply shocks now fully priced in and institutional adoption reaching new ATHs, the stage appears set for a potential macro breakout – though regulatory developments and macroeconomic factors could alter this trajectory.
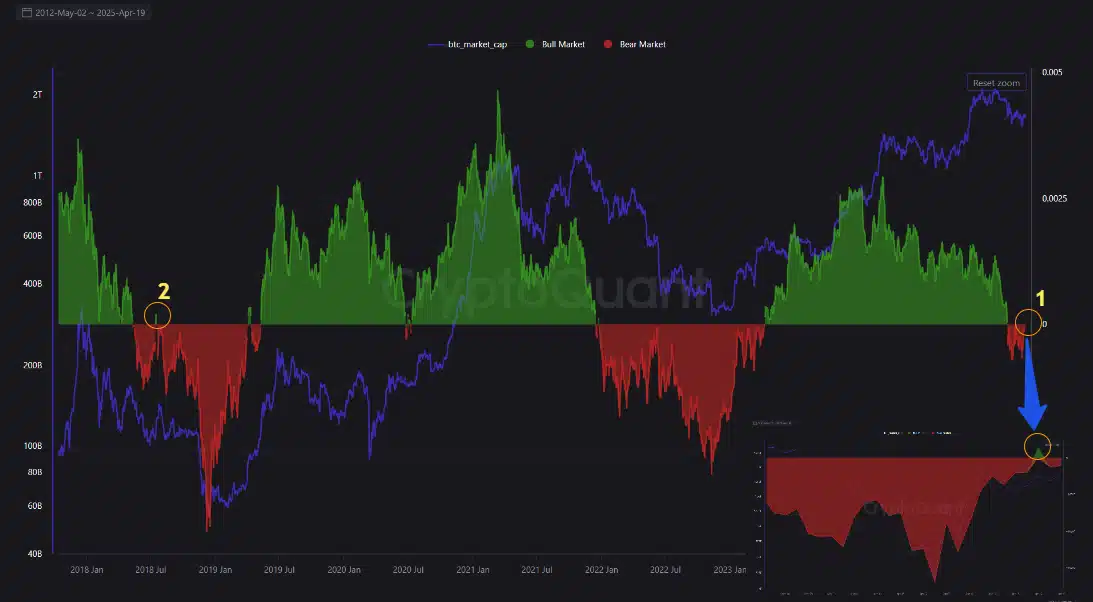
2025’s quiet momentum shift may mirror 2018’s breakout moment
Source: Cryptoquant
The chart highlighted two critical transition points – Late 2018 and early 2025. Both followed extended bear markets, as shown by deep red valleys, where sentiment and price action languished. In 2018, Bitcoin began to climb steadily once it breached this bearish threshold, eventually fueling a new bull cycle. Today, the structure is strikingly similar.
Right now, Bitcoin’s market cap has again crossed out of the red zone, with the lower indicator hinting at resurging bullish momentum. The reappearance of this setup doesn’t always guarantee a rally. However, history suggests these transitions often precede multi-month uptrends.
Why this cycle is different
While the technical echoes of 2018 are undeniable, this cycle unfolds under a vastly different macro lens. Bitcoin is now operating in a post-ETF environment, with growing institutional participation and far more mature infrastructure. And yet, at the core, sentiment-driven phases of fear and greed still shape price discovery.
In fact, the lower on-chain indicator highlighted a formation nearly identical to 2018’s recovery stage. What hasn’t changed is how markets react when these metrics flip. The crowd tends to lag, the chain often leads.
What’s unique is how quietly this transition has been happening. Retail interest has remained muted, perhaps offering smart money a window before broader momentum returns. If the pattern holds, we may be witnessing the first tremors of Bitcoin’s next major rally.
Bitcoin’s price outlook
Bitcoin’s latest close above $87,000 marked a gain of 2.5%, signaling a potential trend shift. The RSI climbed to 57.93, reflecting growing bullish momentum without entering overbought territory – A sign of room for further upside.
Meanwhile, the OBV seemed to be steadily rising, indicating that buying pressure may be backing the price action.

Source: TradingView
With higher lows forming on both price and indicators, Bitcoin might be gaining strength after weeks of consolidation. If the $88k resistance breaks, a move towards $90k could unfold rapidly, echoing early-stage rebounds seen in previous market cycles.
Take a Survey: Chance to Win $500 USDT
