Is Bitcoin’s rebound near as key area rises? Assessing…

- Bitcoin’s Sell-Side Risk Ratio drops to 0.086%, historically a level that precedes major rebounds.
- MVRV momentum may flip bullish if the ratio crosses above its 70-day moving average.
Bitcoin [BTC] could be gearing up for a fresh rally, with two key on-chain indicators flashing historical reversal signals.
The latest drop in the sell-side risk ratio and a potential bullish crossover in MVRV momentum are bringing Optimism back to the market.
Dipping below the historical rebound zone
Bitcoin’s Ssell-Side Risk Ratio has plunged to 0.086%, its lowest level in months.
Historically, this metric falling below 0.1% has marked strong bounce-back zones, reflecting suppressed realized profits relative to market cap.
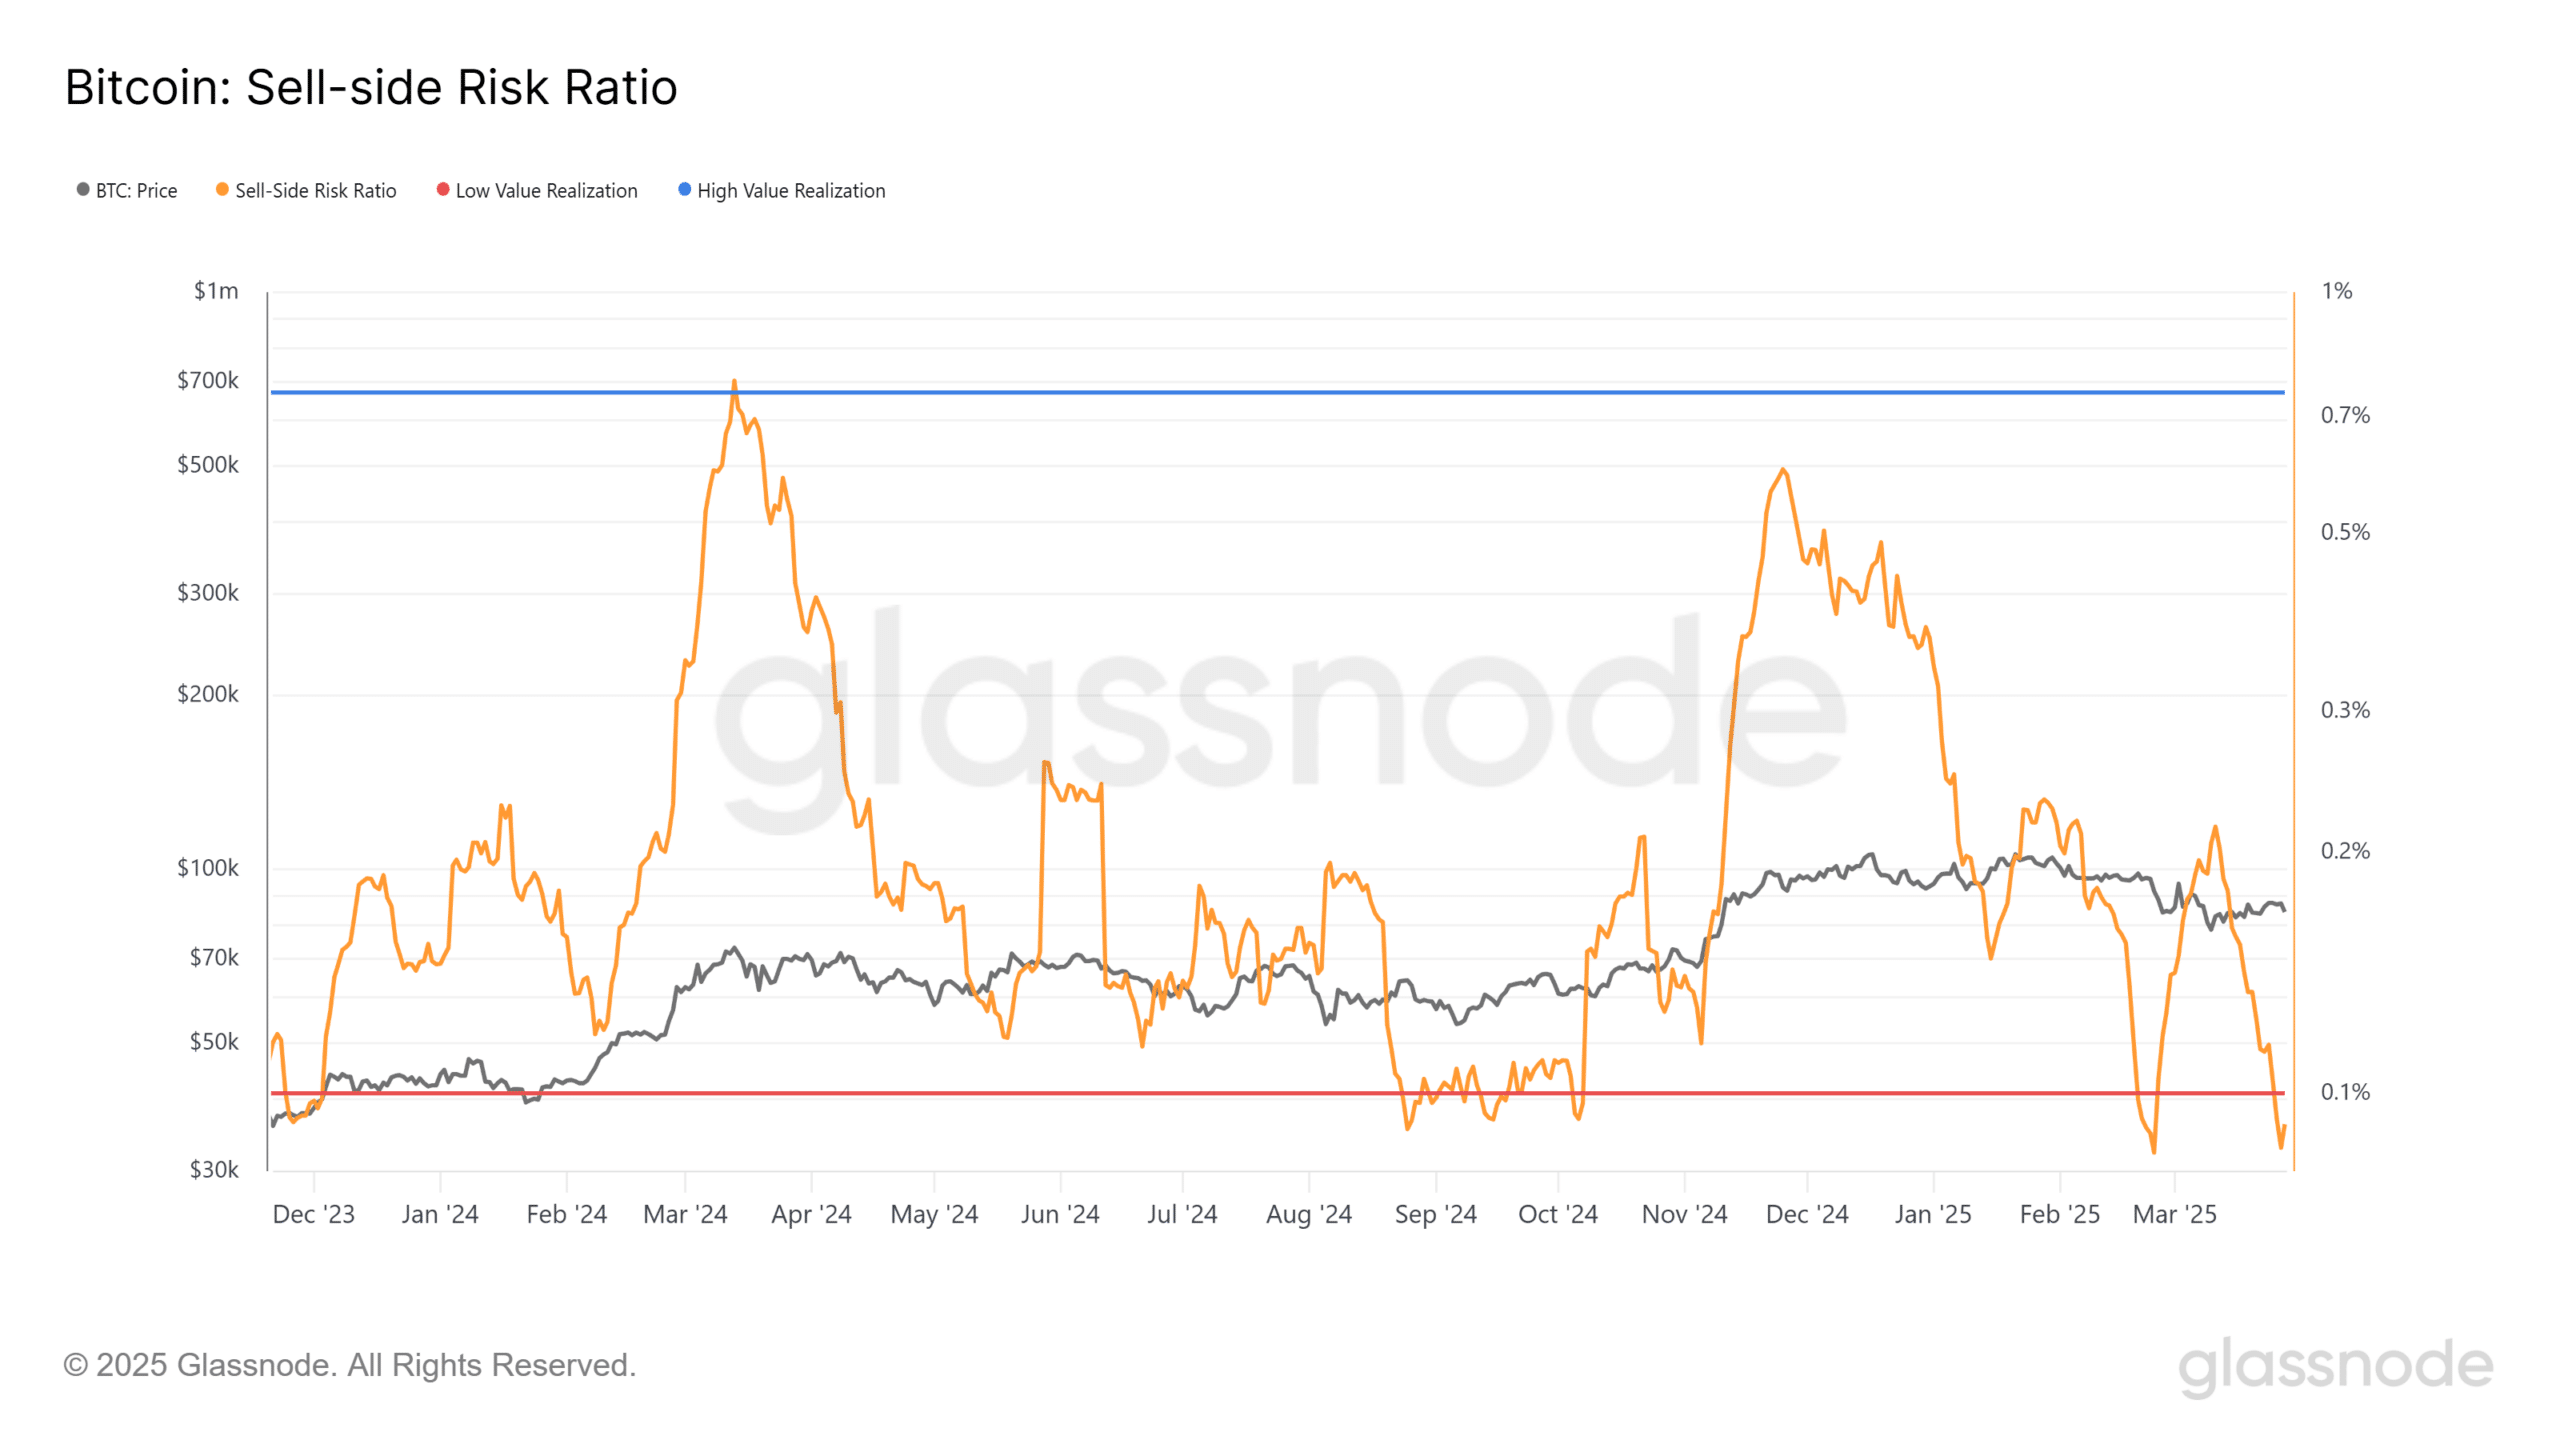
Source: Glassnode
These low-risk periods often coincide with investors’ hesitation to sell, reducing overhead pressure on price.
The last time the ratio dipped below this level was during Bitcoin’s correction in September 2024, just before it staged a recovery to new highs in Q4.
Currently, the ratio is again signaling a limited risk of profit-taking, setting the stage for a possible reversal if buying momentum returns.
Bitcoin MVRV close to bullish crossover
The 70-day MVRV momentum is on the verge of breaking above its moving average, a crossover that has historically confirmed bottom formations.
The MVRV ratio, which compares market value to realized value, is often used to identify undervaluation zones.
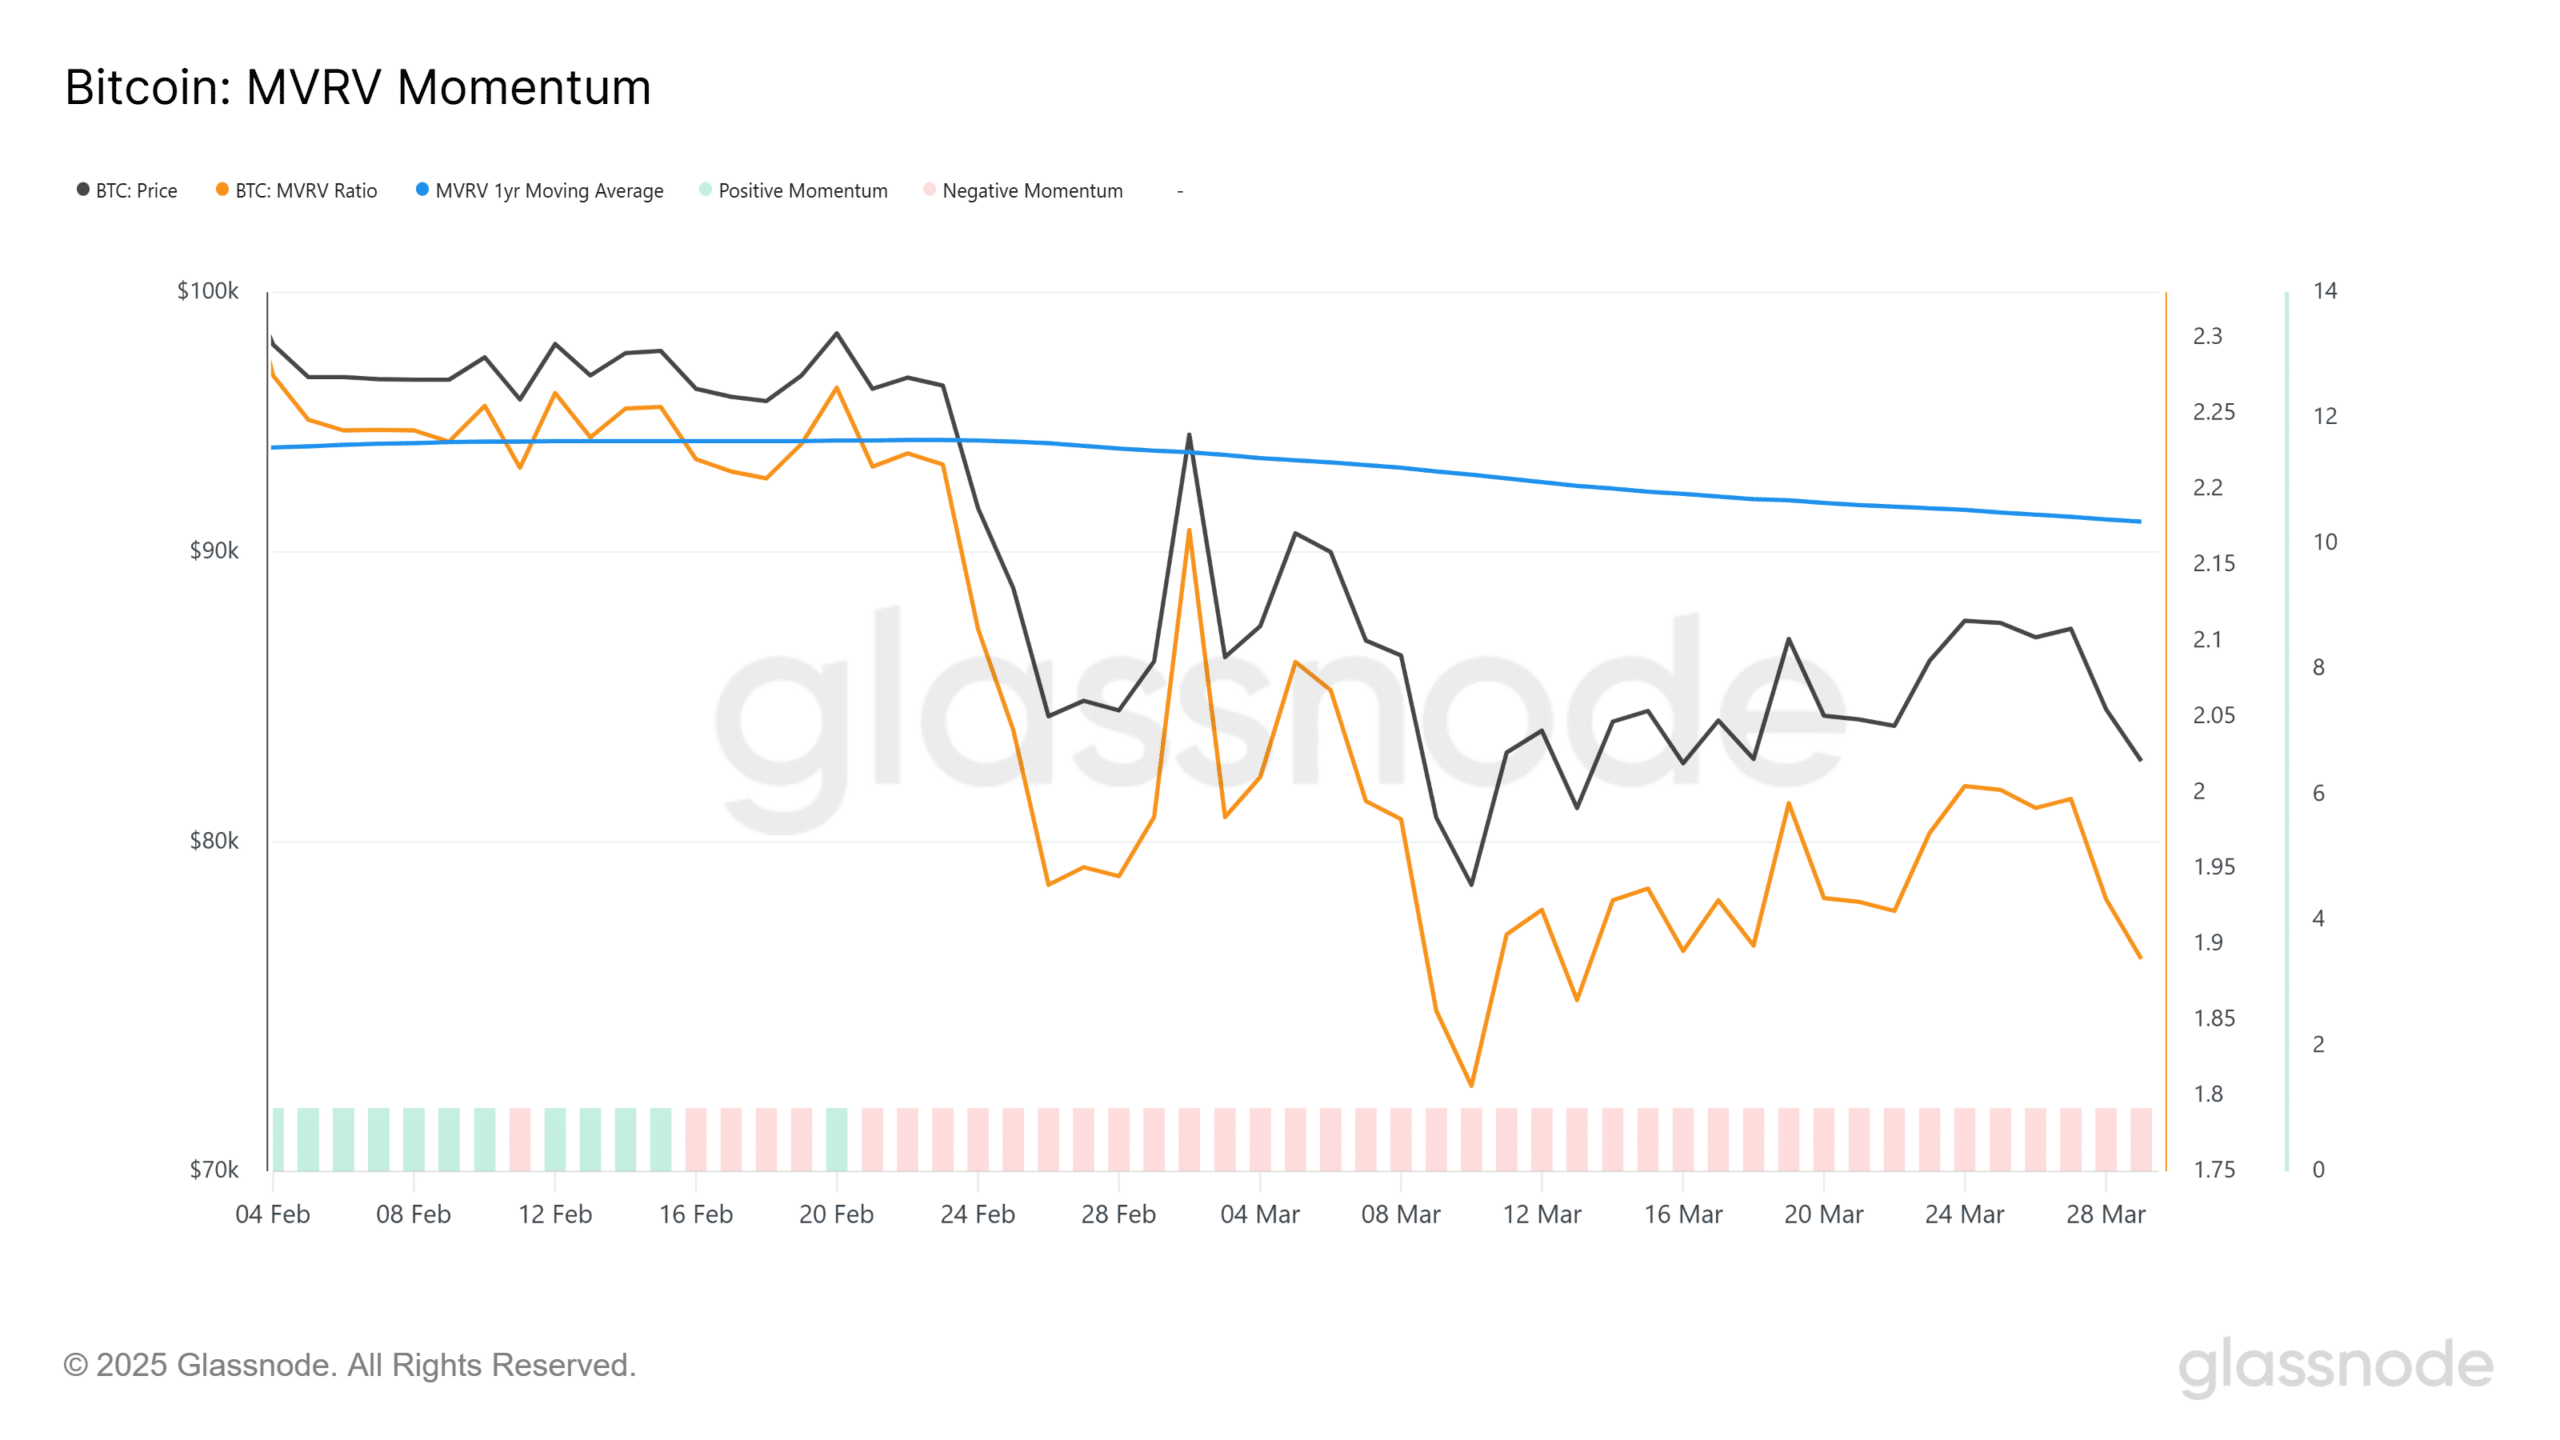
Source: Glassnode
Bitcoin’s MVRV ratio has remained below the 70-day average for weeks, mirroring the pre-bullish setups observed in late October and January.
A confirmed breakout could act as the final confirmation of a bottom, particularly as the broader macro environment stabilizes.
Bitcoin price struggles below key moving averages
Bitcoin traded around $81,100 at press time, with the 50-day and 200-day moving averages at $84,934 and $93,916, respectively.
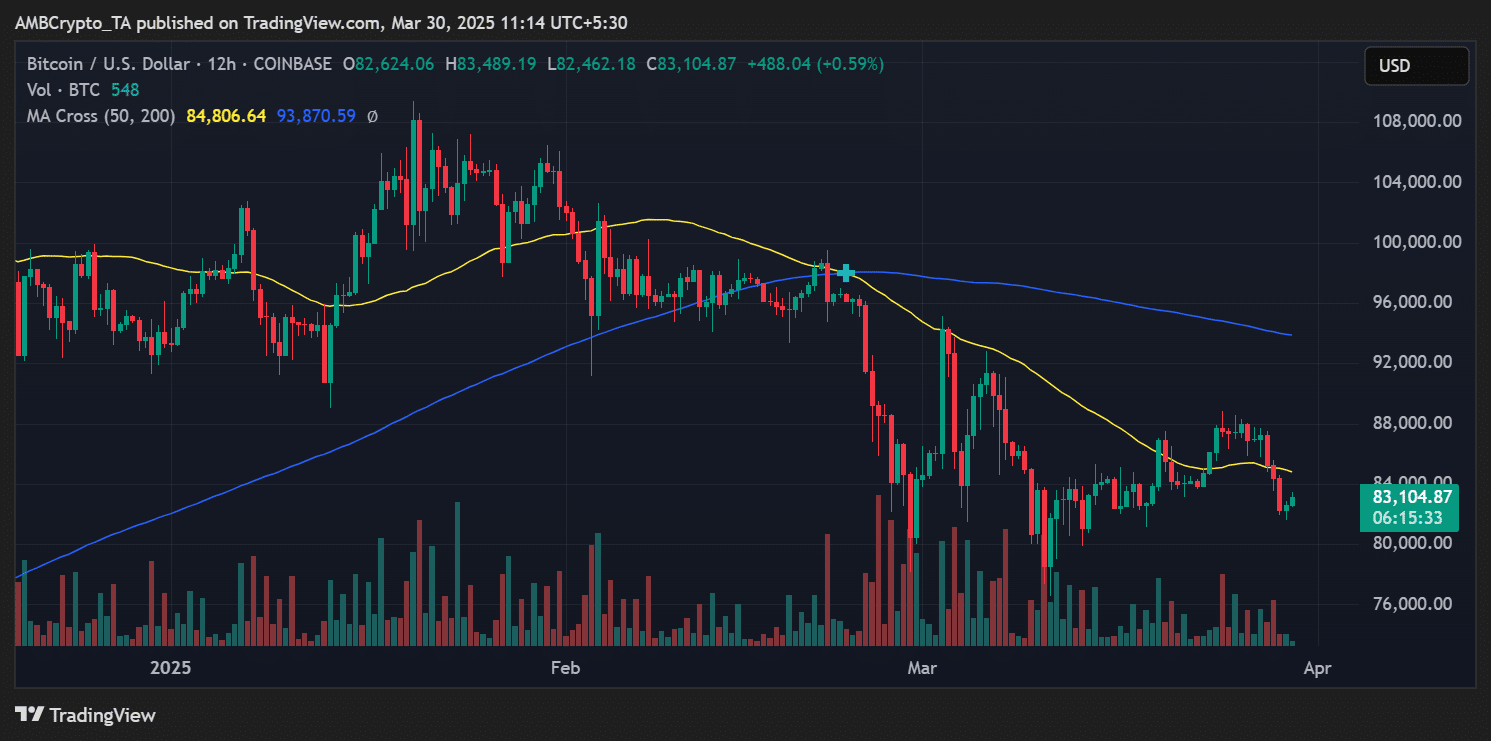
Source: TradingView
The inability to reclaim the 50-day MA remains a short-term concern. However, the technical setup and on-chain metrics suggest sellers are exhausted, and accumulation is gradually returning.
If BTC reclaims $85K, it could unlock bullish momentum toward the $90K psychological barrier. Until then, the market may range, with the current setup favoring accumulation strategies.
Take a Survey: Chance to Win $500 USDT

Log in to Reply
Log in to comment your thoughtsComments
Related Articles
|Square
Get the BTCC app to start your crypto journey
Get started today Scan to join our 100M+ users