BTC’s Fear and Greed Index signals caution, but should you buy at $82K?

- The Bitcoin Rainbow Chart showed that the recent dip was a buying opportunity, even as fear prevailed.
- The liquidation heatmaps pointed to a price bounce to $86.3k in the coming days.
Bitcoin [BTC] saw a 6.89% price bounce from the 10th of March’s 1-day trading session price, closing at $78.6k. It has already encountered notable resistance at the $84k region.
Analysis of the price chart and the liquidation levels showed that short-term consolidation was likely.
Source: Alternative.me
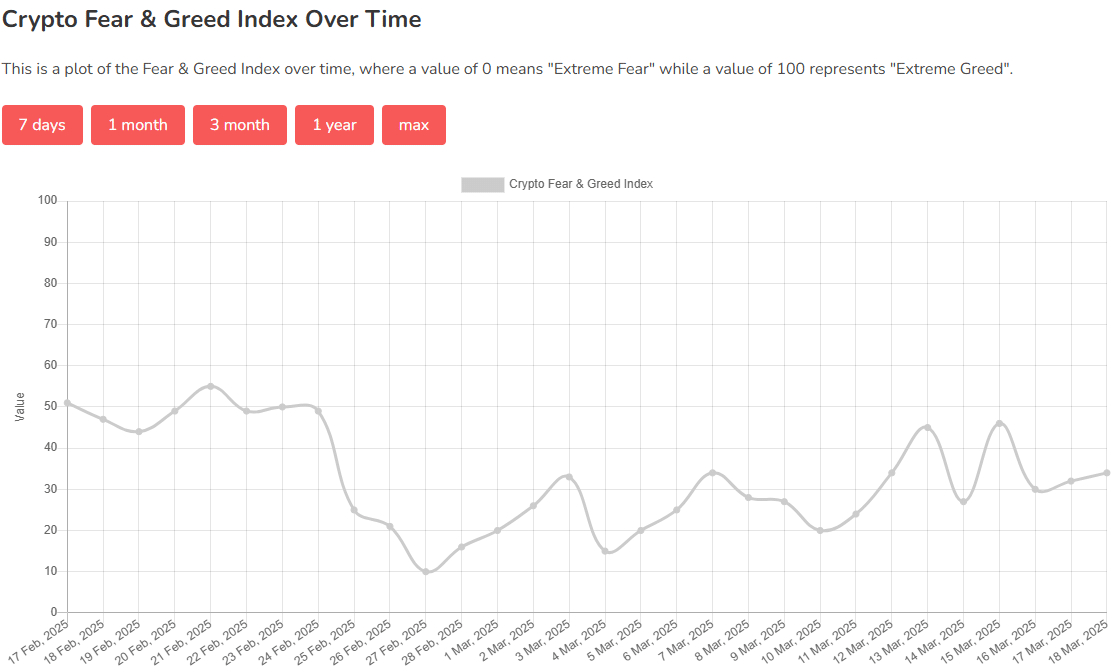
The Bitcoin Fear and Greed Index was at 34, showing fear. Over the past week, it has hovered around 30-40, dipping to extreme fear and a value of 24 on the 11th of March.
Bitcoin spot ETFs saw outflows of $900 million in the past five weeks, underlining the bearish market sentiment.
Buy Bitcoin while fear grips the wider market
Source: Blockchain Center
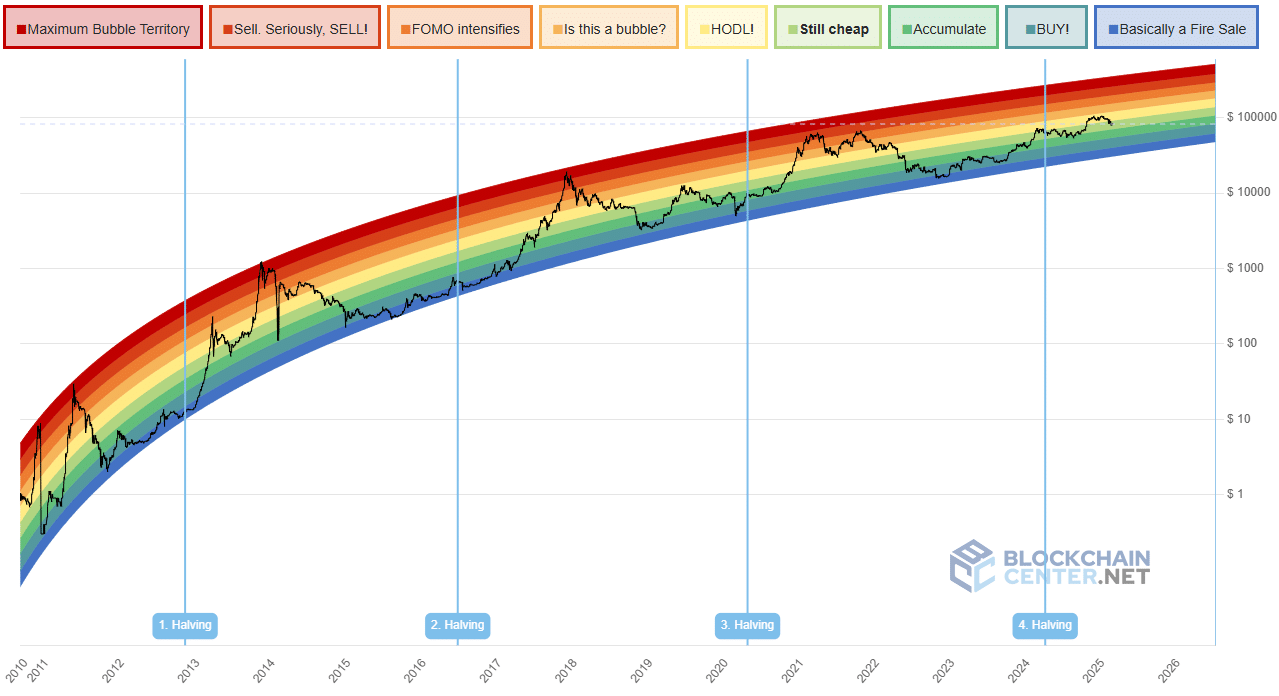
At least, this was the message from the Bitcoin Rainbow Chart. The long-term valuation tool for Bitcoin with fun colors can be useful for investors. It is based on the idea that Bitcoin’s price growth follows a logarithmic pattern over time.
The chart has done a good job identifying cycle tops and bottoms, but it must be noted that this was done mostly in hindsight. Right now, the Bitcoin Rainbow Chart shows that the biggest crypto was “still cheap”.
At $82k, it was quite a grand claim, especially in the background of declining stock markets across the globe. Then again, that might be the appeal for investors – the risk to reward was still enticing.
Source: BTC/USDT on TradingView
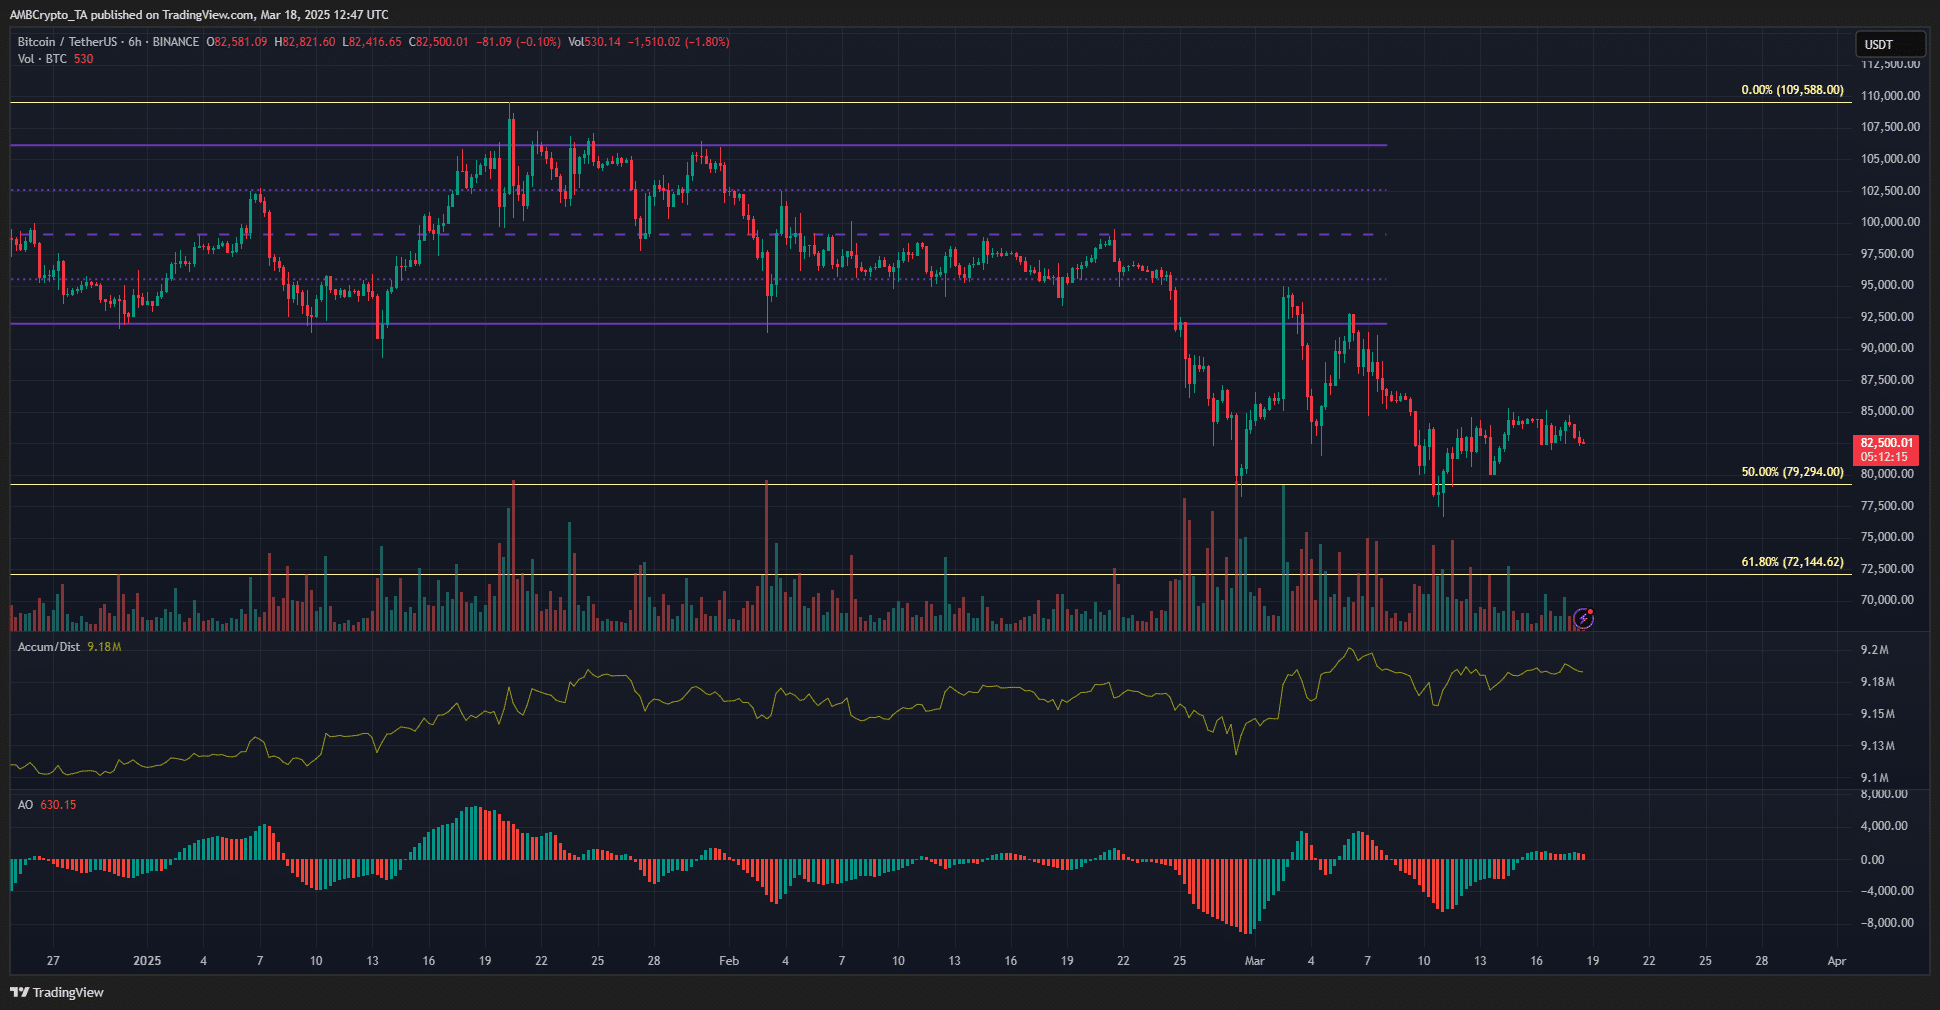
Examination of the 6-hour chart showed that the short-term structure was bearish. The $85k level has served as resistance over the past week. The A/D indicator showed an uptrend in March, while the price has trended toward $80k.
This was an encouraging finding. It showed increased accumulation and buying activity was on the rise, according to the indicator.
The Awesome Oscillator showed momentum was slightly bullish, but not high enough to drive trends.
Source: Coinglass
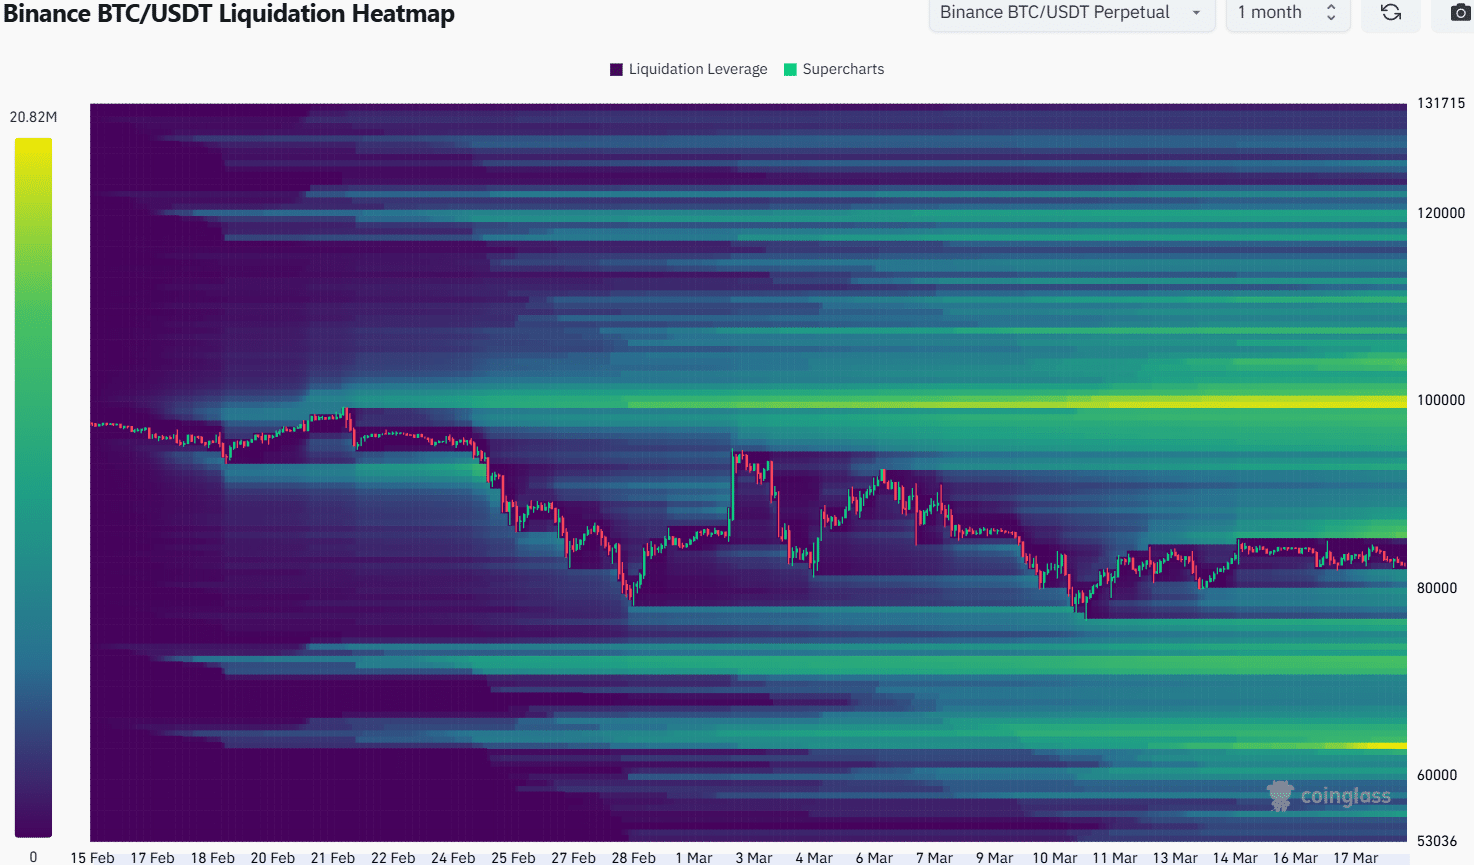
The 1-month liquidation heatmap outlined the $100k and $71.7k-$72.3k as significant liquidity clusters. Closer to the price, the $86.3k and $76.3k were also levels that could attract prices to them.
Given the bearish structure of BTC, a move southward appeared likely. However, the A/D indicator showed a bounce was possible.
Moreover, such a bounce beyond the local resistance at $85k could turn market participants bullish, before the bearish reversal is initiated at the $86.3k magnetic zone.
Hence, traders should maintain a bearish outlook until the local resistance regions are breached.
Disclaimer: The information presented does not constitute financial, investment, trading, or other types of advice and is solely the writer’s opinion
Take a Survey: Chance to Win $500 USDT

Log in to Reply
Log in to comment your thoughtsComments
Related Articles
|Square
Get the BTCC app to start your crypto journey
Get started today Scan to join our 100M+ users