Bitcoin liquidation heatmap unveils key price zones – Could a major swing be next?

- The Bitcoin weekly session closed well below $92k, which meant the bias was bearish.
- The liquidation heatmap highlighted a key bearish target, which could mark the downtrend’s bottom.
Bitcoin [BTC] was in freefall on the price charts. The $92k level, which had been the low of the range BTC had traded within from late November to late February, has been retested as resistance.
The bulls were rebuffed last weekend, and the trend was in bearish favor.
Source: Axel on X
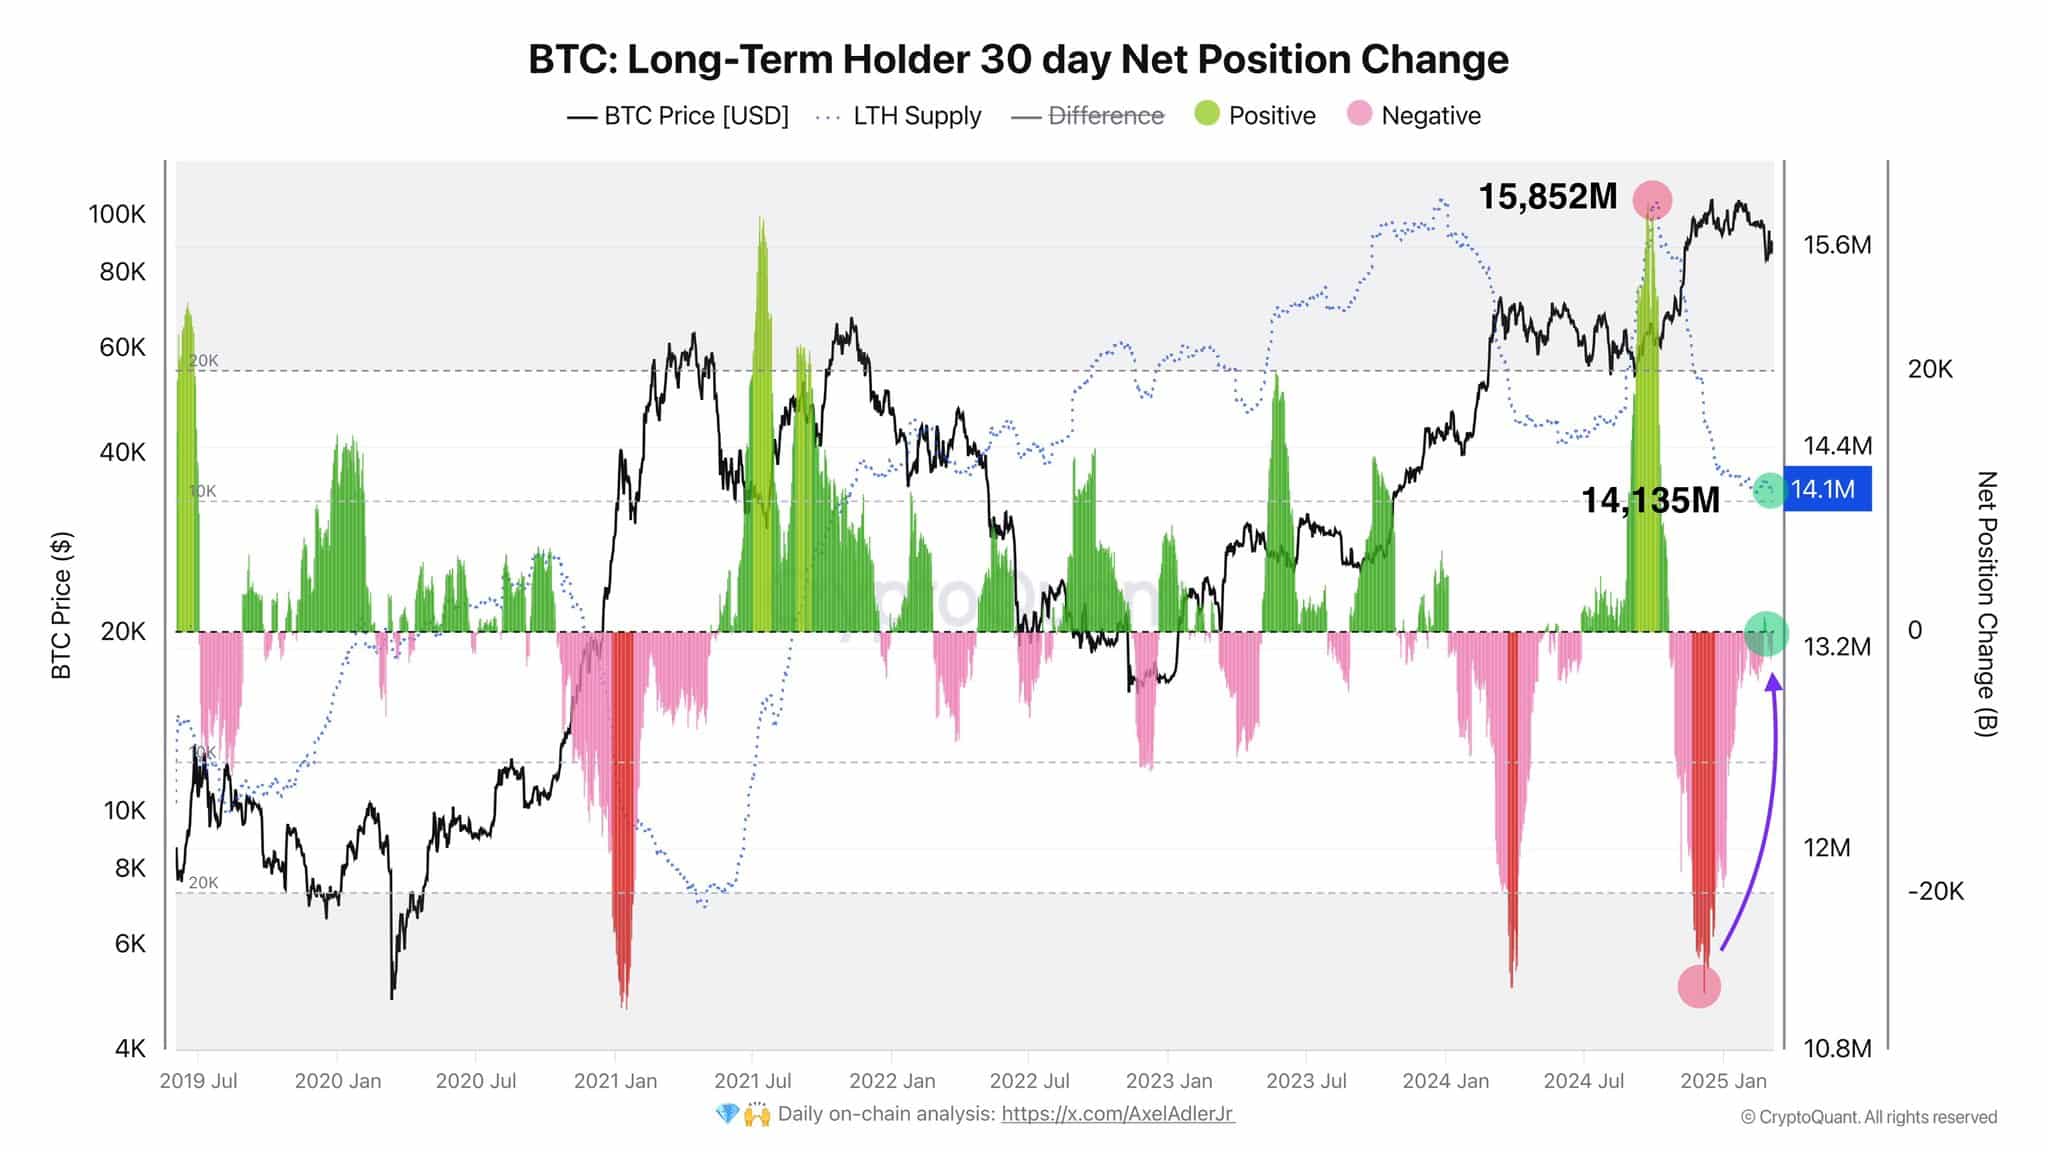
There was on-chain evidence for distribution among long-term holders since the $60k level was breached. This distribution’s intensity has dropped, noted analyst Axel Adler.
Is that enough to prevent Bitcoin from falling to $70k?
Momentum and volume indicate further downside
Source: BTC/USDT on TradingView
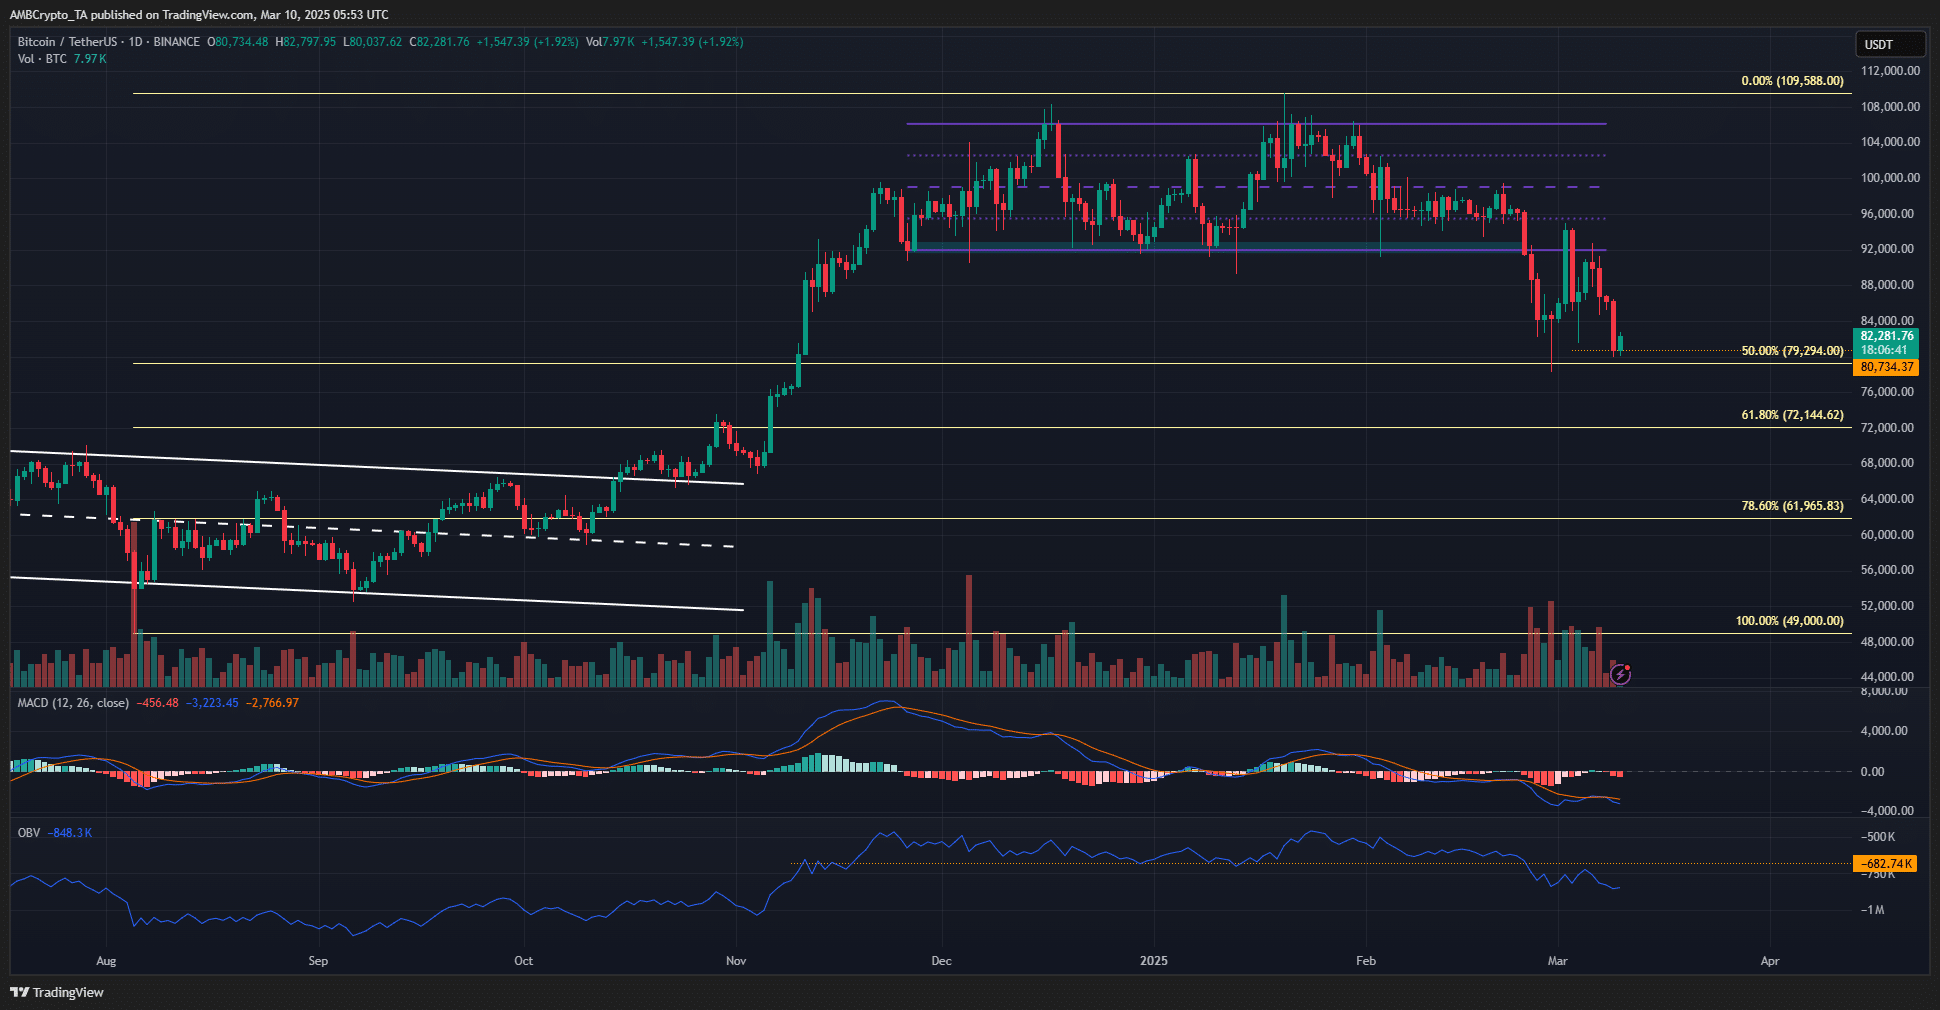
The weekly session closed at $80.7k, just above the 50% retracement level at $79.3k. The large losses after the repeated tests of the $92k support from December to February highlighted bullish exhaustion.
To the south, the $72k region was the next target, as both the MACD and OBV highlighted firm bearish pressure.
There is a chance that BTC would bounce higher to collect the liquidity around $87k. Any further gains appeared unlikely. If such a bounce occurred, it would likely be followed by a price drop toward the $70k area.
The Fibonacci levels plotted based on the move from $49k to $109.6k (August to January) showed that the price was just above the 50% retracement level. This was another sign that a short-term price bounce was possible.
Source: Coinglass
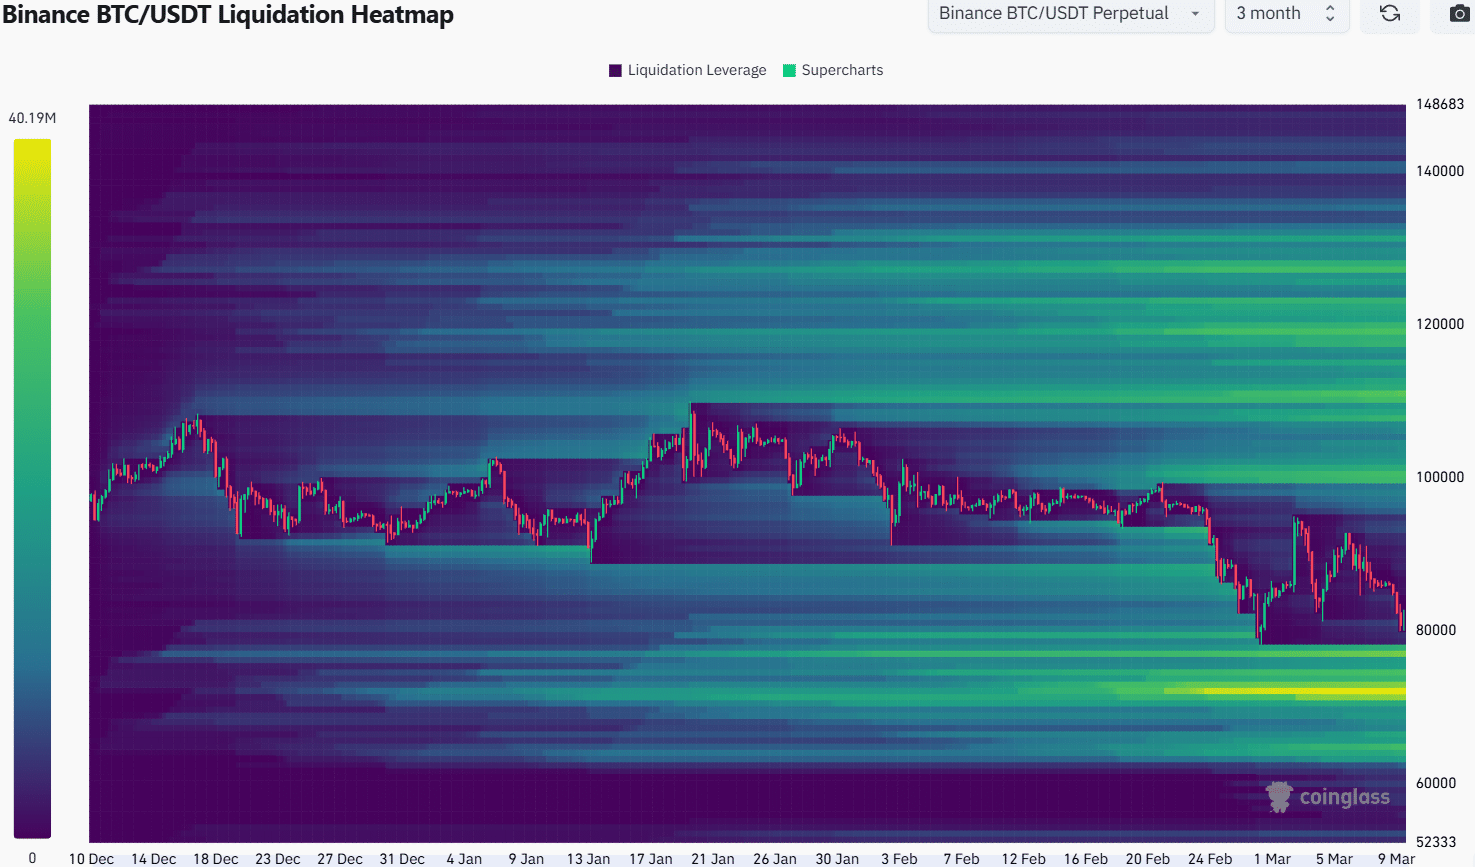
The 3-month liquidation heatmap showed that the closest magnetic zones were at $100k and $72k. The southward liquidity cluster began at $76.8k, hence the $72k-$76k region was a candidate for a bullish reversal.
Until then, swing traders need to maintain a bearish outlook. The market-wide sentiment was strongly bearish. Investors can wait for the BTC reaction at $72k to understand if their bias should shift bullishly.
Disclaimer: The information presented does not constitute financial, investment, trading, or other types of advice and is solely the writer’s opinion
Take a Survey: Chance to Win $500 USDT

Log in to Reply
Log in to comment your thoughtsComments
Related Articles