Will TradFi Tame BTC’s Wild Swings? Forex’s Maturation Blueprint for Bitcoin

Bitcoin's notorious volatility faces its ultimate test as traditional finance giants pile in. Could institutional adoption finally bring calm to crypto's stormy seas?
Forex's Playbook for Stability
Major currency pairs traded within razor-thin ranges for decades—until black swan events reminded everyone why they need hedging instruments. Bitcoin's following similar patterns just on compressed timelines.
The Institutional Effect
Hedge funds deploying volatility-targeting strategies. Pension funds allocating 1-2% to digital assets. Market makers providing relentless liquidity. Each institutional participant chips away at Bitcoin's wild price swings.
Volatility's Last Stand
Retail traders still chase 10% daily moves while quant firms scalp basis trades with surgical precision. The clash between crypto natives and TradFi invaders creates fascinating market dynamics.
Regulatory Reality Check
SEC approval of Bitcoin ETFs brought legitimacy—and surveillance. Every large trade now scrutinized, every wash trade pattern flagged. Compliance departments becoming crypto's unexpected volatility dampeners.
Forex's painful lessons took decades to learn. Bitcoin's compressing that timeline into years—because nothing makes traders adopt risk management faster than losing money to someone with better technology.
Institutional players are no longer just exploring digital assets; they're actively using options for risk management and capital efficiency.… pic.twitter.com/9gN9zkM5QP
— CME Group (@CMEGroup) September 11, 2025
TradFi probably won’t erase BTC USD volatility. It may smooth out fewer wild gaps, more mean-reverting drift, with the occasional shock that still bites.
What to watch next: whether ETF flows stay positive into quarter-end, how options price the path of Fed cuts, and whether regulation or geopolitics jolts implied vol off the floor.
DISCOVER: 20+ Next Crypto to Explode in 2025
Bitcoin Price Prediction: Bitcoin Cycle Trap: Is 2025 Repeating the 2017 and 2021 Pattern?
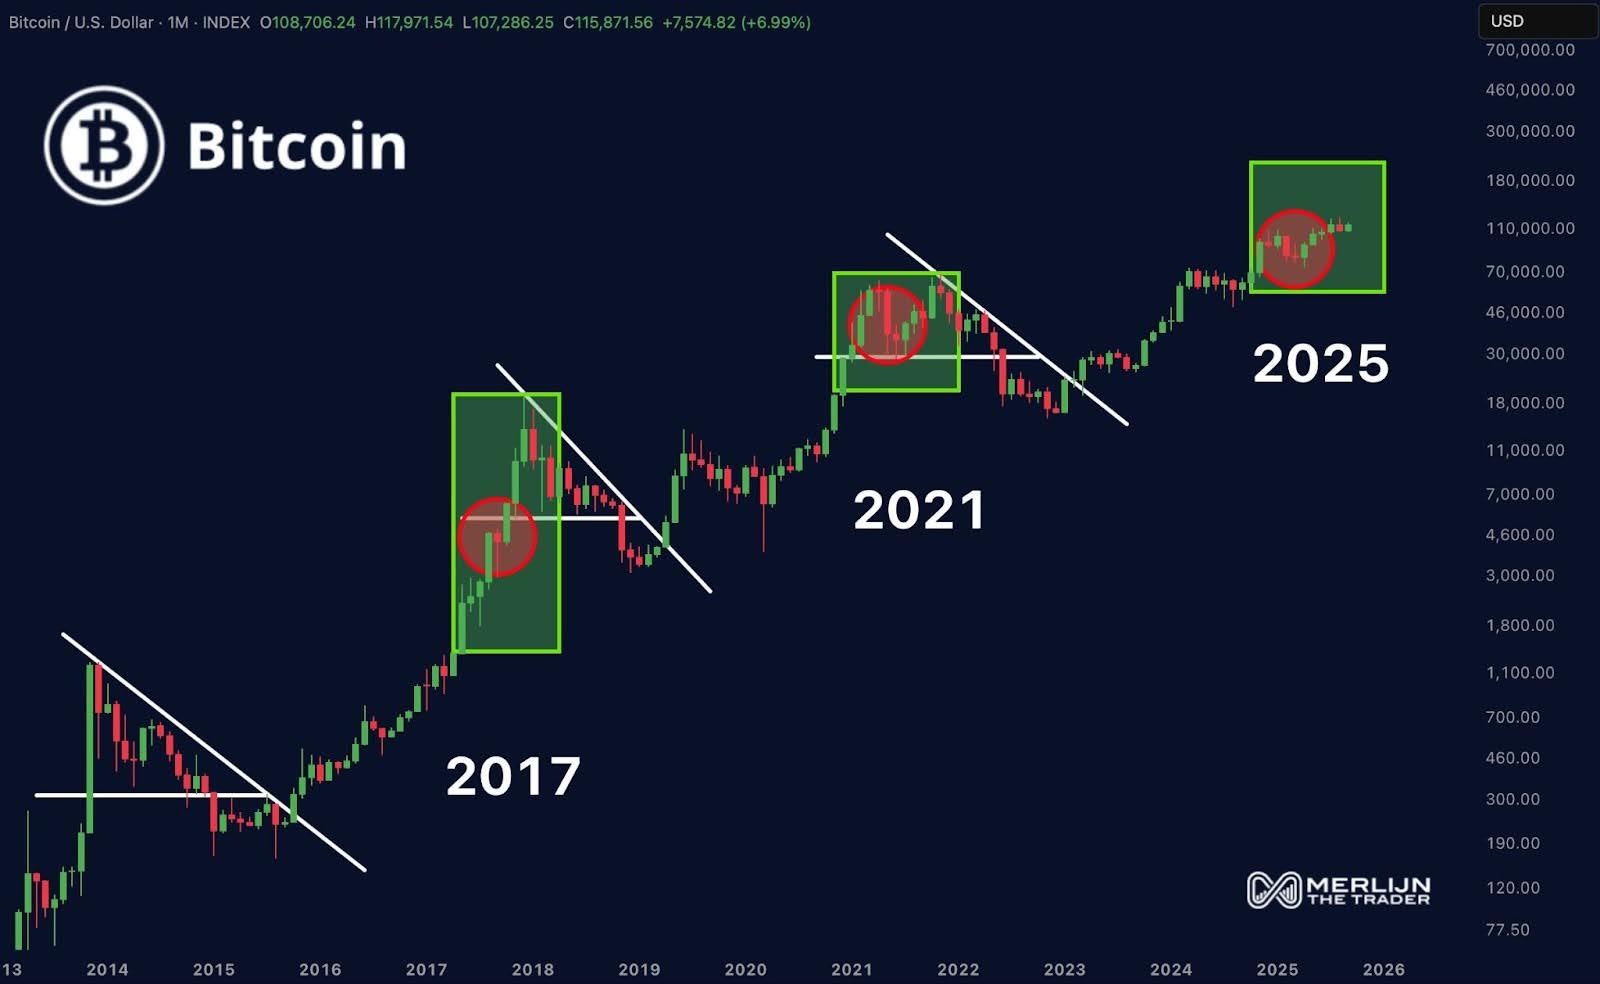
According to an analysis shared by trader Merlijn, Bitcoin’s long-term chart once again echoes its historical cycle patterns.
BITCOIN IS DOING IT AGAIN.
Every cycle has the same cycle trap.
Flush. Confuse. Then detonate higher.
2017: Check
2021: Check
2025: Loading
Ignore the playbook, and you’ll miss the parabola. pic.twitter.com/xnYMx5ZSvB
— Merlijn The Trader (@MerlijnTrader) September 21, 2025
The chart shows that every major bull run since 2017 has included a mid-cycle “trap” a sharp correction that forces weaker hands out before the market resumes its rise.
In 2017, Bitcoin ROSE rapidly, and then it experienced a sharp decline that shook confidence, only to climb to historic levels a few months later.
The same pattern repeated in 2021, with prices freezing around $60,000 and then surging up.
(Source: X)
The present chart of Merlijn also indicates 2025 to be another instance of this pattern.
BTC USD rose to $100,000, and then retreated, creating yet another level of a flush and confusion phase. The price has been above $115,000 and has surged after returning to six figures.
The analysis shows the presence of downward resistance lines, which historically yielded following these cycle traps, thus resulting in parabolic progressions.
Green zones on the chart show prior acceleration phases, each ending in fresh all-time highs.
Bitcoin may be on the verge of another explosive rally if the pattern plays out again. Merlijn summed up the sequence simply: “Flush. Confuse. Then detonate higher.”
DISCOVER: Best Meme Coin ICOs to Invest in Today
Is BTC USD Weekly Chart Pointing Toward a Massive Q4 Rally?
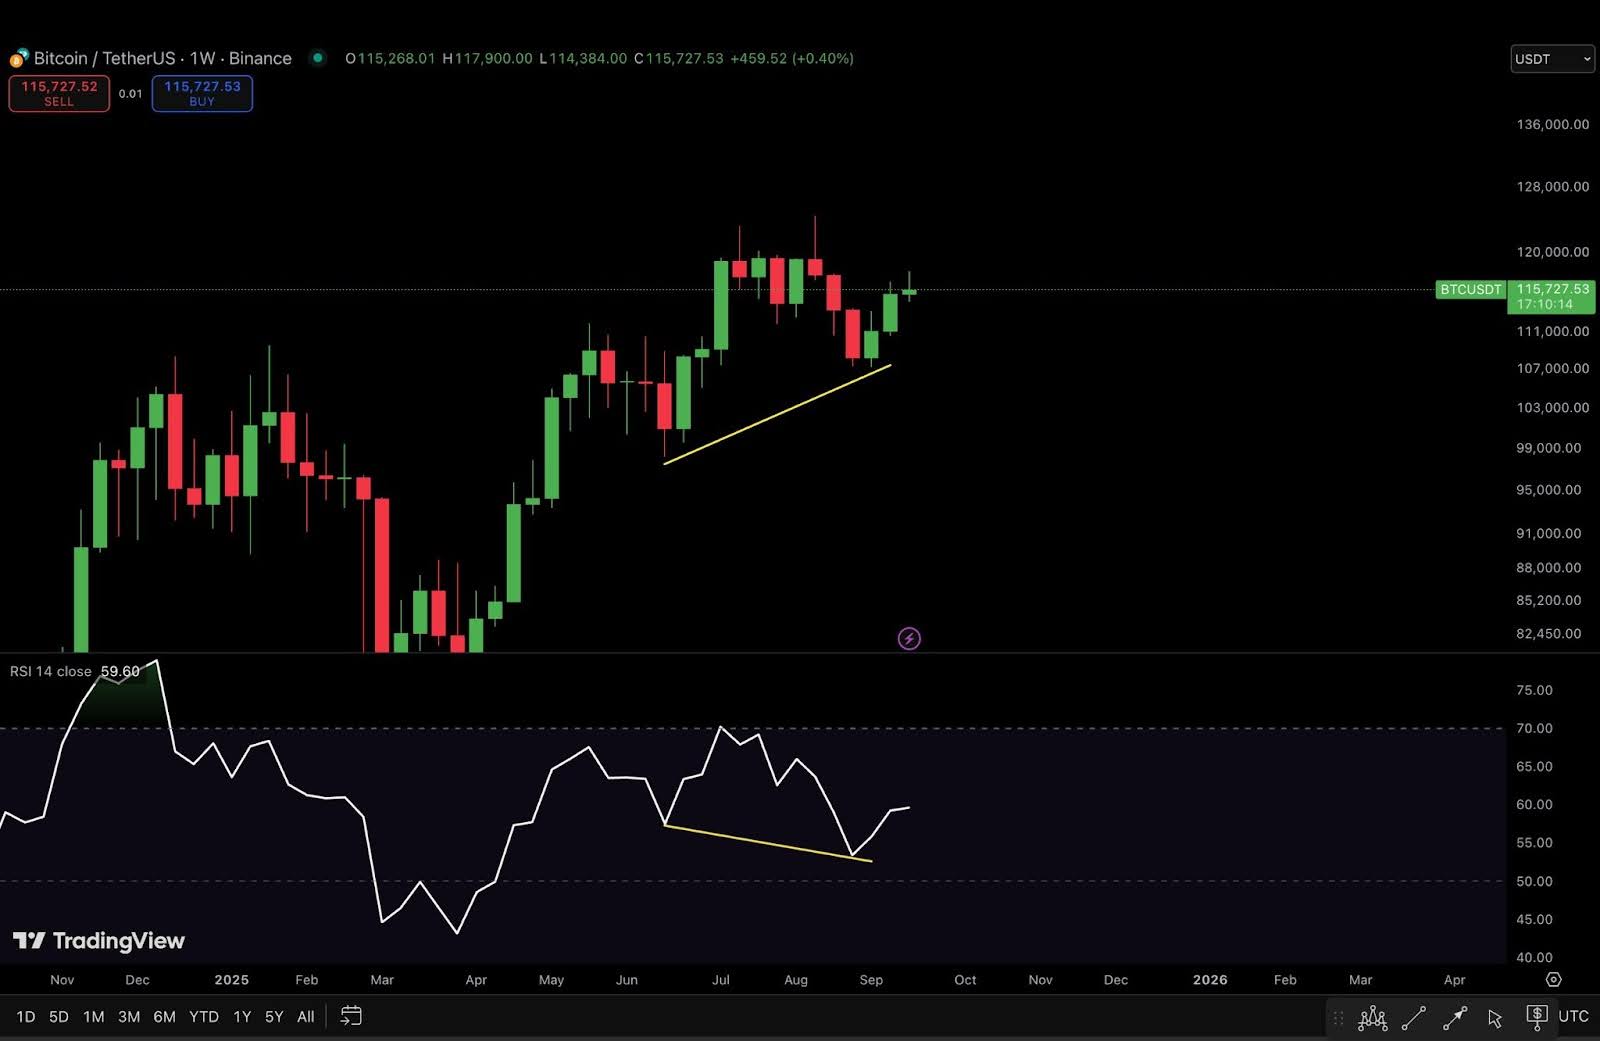
“BTC”Price“BTC”24h7d30d1yAll timeAsh Crypto posted Bitcoin’s weekly chart, which is flashing a classic hidden bullish divergence.
BITCOIN WEEKLY HIDDEN BULLISH DIVERGENCE IS YET TO PLAY OUT
MASSIVE BITCOIN PUMP IS COMING IN Q4 pic.twitter.com/ZihXku43ag
— Ash Crypto (@Ashcryptoreal) September 21, 2025
Price has carved higher lows above $115,000 while the weekly RSI recently made lower lows and is now increasing. That mismatch often signals trend continuation, not reversal.
Buyers held the rising base around $114,000-$115,000, showing sellers couldn’t push a deeper correction.
RSI has bounced from a downward trendline near the mid-50s, adding momentum back into the move.
(Source: X)
The near-term test is $120,000, and the ceiling of the recent weekly closes. A decisive close above it WOULD put $128,000-$130,000 in play, where the prior supply sits.
Bulls argue the setup could fuel a fresh Q4 advance if strength builds through that band.
For now, the structure remains constructive: steady accumulation at higher levels, improving momentum, and a clear line in the sand. Holding the $114,000-$115,000 shelf keeps the signal intact. Losing it would weaken the case and delay any breakout.
