DYDX Price Outlook Soars as dYdX Foundation Unveils Stellar Protocol Performance and Ambitious 2026 Roadmap

DYDX rockets on foundation's bullish revelations—protocol metrics smash expectations while 2026 roadmap paints decentralized dominance.
Performance Unleashed
Transaction volumes hit unprecedented levels—liquidity depth expands while user adoption metrics defy typical DeFi summer slumps. The foundation's report shows institutional flows accelerating, not just retail speculation driving growth.
Roadmap to 2026
Full decentralization targets set—governance shifts to community control, tokenomics overhaul planned, and cross-chain expansion confirmed. No more halfway measures; dYdX commits to cutting centralized dependencies entirely.
Market Impact
Traders pile in—open interest spikes, funding rates turn positive, and shorts get squeezed into oblivion. Suddenly every crypto fund manager remembers they 'always believed in decentralized derivatives'—convenient amnesia strikes again.
Future's Bright, Future's DYDX
While traditional finance still debates whether blockchain is real, dYdX just built the future—and it's not asking for permission.
DYDX Price Analysis: Can DYDX Push Past the $0.70–$0.72 Resistance Zone?
DYDX traded NEAR $0.69 in the past 24 hours, marking a +5% gain, with price movement ranging between $0.65 and $0.69.
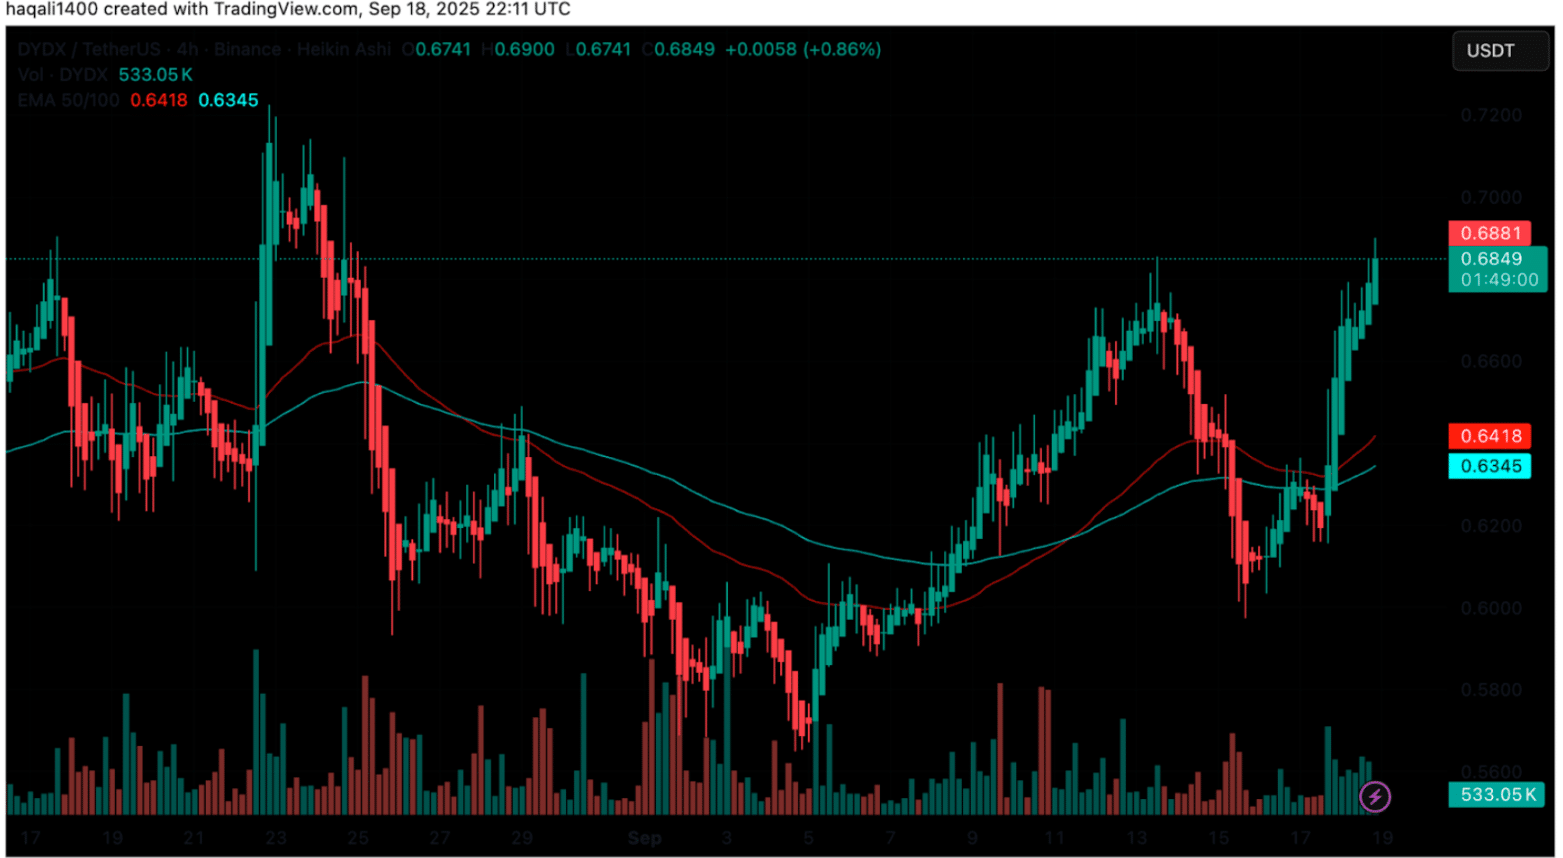
(Source – DYDX USDT, TradingView)
The DYDX/USDT 4-hour chart points to a steady recovery after recent consolidation.
From a mid-September low around $0.60, the token has pushed back above the $0.68 resistance zone, supported by rising trading volumes that signal stronger buyer activity.
On the technical front, DYDX has regained both the 50-period EMA at $0.6418 and the 100-period EMA at $0.6345.
These levels now act as short-term support. A bullish crossover of candles above the moving averages reinforces the case for renewed upside momentum, with volume patterns showing clear accumulation at lower prices.
The structure resembles a bullish continuation setup, with higher lows forming beneath resistance. Immediate pressure is at $0.6880, the zone DYDX is currently testing.
A breakout could pave the way toward the $0.70-$0.72 range, where earlier highs and a psychological barrier align. On the downside, the $0.64-$0.63 area remains key support. A break below this range could drag the price back to $0.60.
Overall, DYDX is flashing early signs of a trend shift after weeks of sideways to bearish action. Sustained strength above $0.68 with firm volume may confirm a breakout rally, while failure to hold that level risks trapping late buyers and triggering a pullback.
Traders are watching closely to see if the token can build a new base higher up the chart.
On the dYdX Chain, derivatives activity stayed steady over the past day. Data from DefiLlama shows 24-hour perpetuals volume between $430M and $440M, with weekly volume near $1.76Bn.
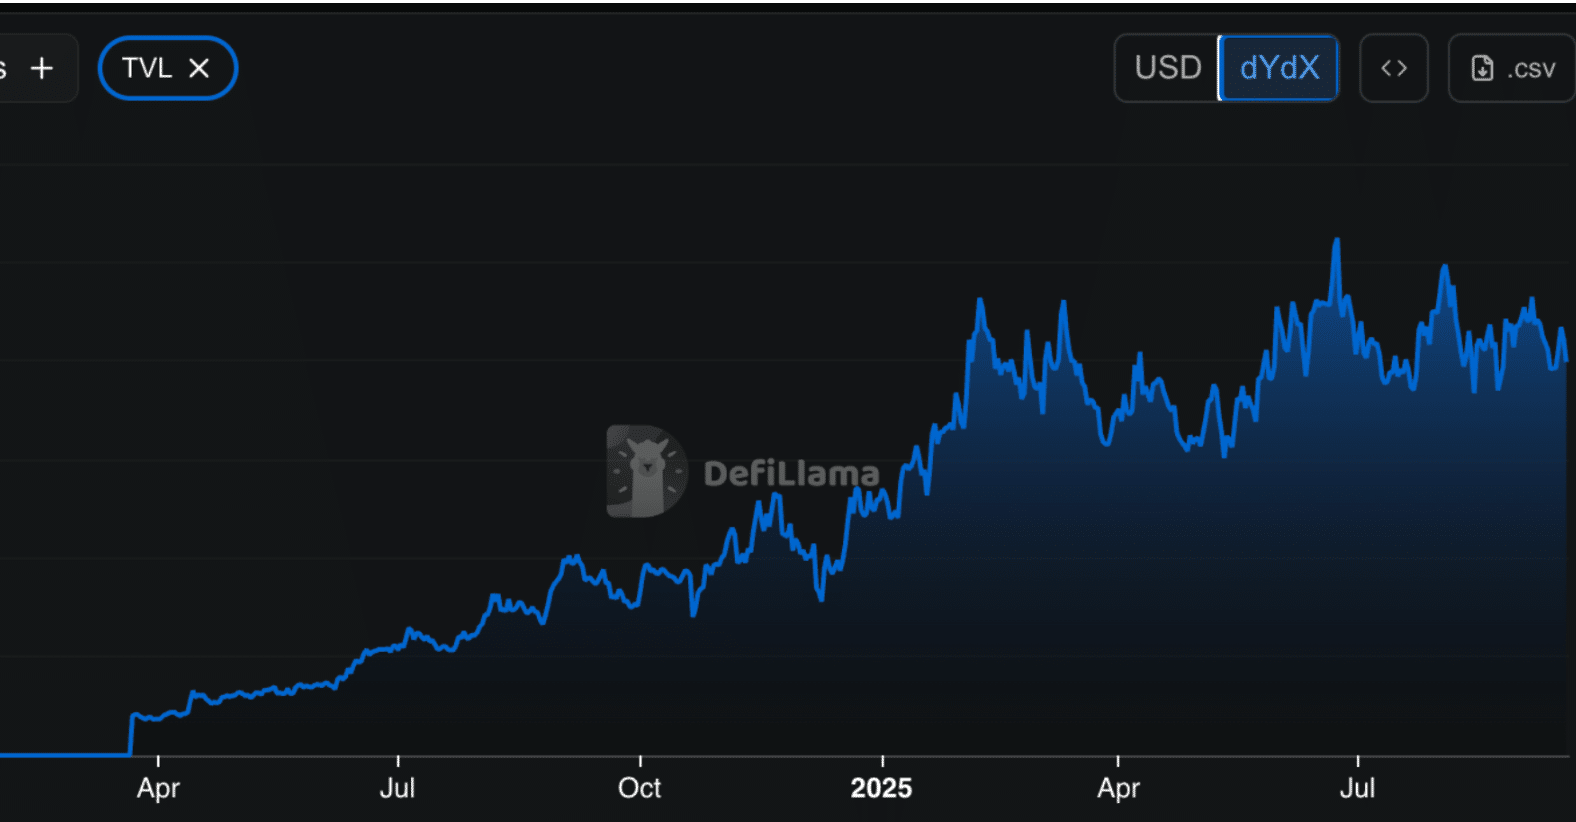
(Source – DefiLlama)
These numbers line up with the broader rise in DeFi derivatives trading, signaling that dYdX is moving in step with the wider market trend.
