Bitcoin Price Collapse: How Low Could It Really Go?

BITCOIN FACES POTENTIAL PLUNGE: WHERE'S THE BOTTOM?
THE FLOOR QUESTION
When crypto winter bites, it bites hard. Bitcoin's notorious volatility means drops of 50-80% aren't just possible—they're practically tradition. Without concrete support levels, analysts watch institutional sentiment, mining cost bases, and whale accumulation patterns instead of pretty charts.
THE REALITY CHECK
Traditional finance types love shouting 'told you so' during crypto crashes—never mind that their own hedge funds blow up quarterly. Meanwhile, seasoned crypto investors see blood in the streets as opportunity, not catastrophe. The market's survived worse, and each cycle separates diamond hands from weak ones.
BULLS EAT THE FEAR
Sharp corrections shake out leverage, reset expectations, and build stronger foundations for the next run. Whether it drops another 20% or 60%, history shows one thing consistently: nobody ever regrets buying Bitcoin at prices everyone called 'insane' at the time.
Bitcoin Price Analysis: Is BTC’s Descending Channel Setting Up a Breakout or a Breakdown?

On the technical side, Bitcoin’s hourly chart shows a mixed setup. Price action has been consolidating after the recent volatility.
Candlestick movement shows a descending channel formed in late August. This was marked by consistently lower highs and lower lows.
The pattern forced Bitcoin down to the $109,500-$110,000 support zone. Buyers stepped in at this level to absorb selling pressure.
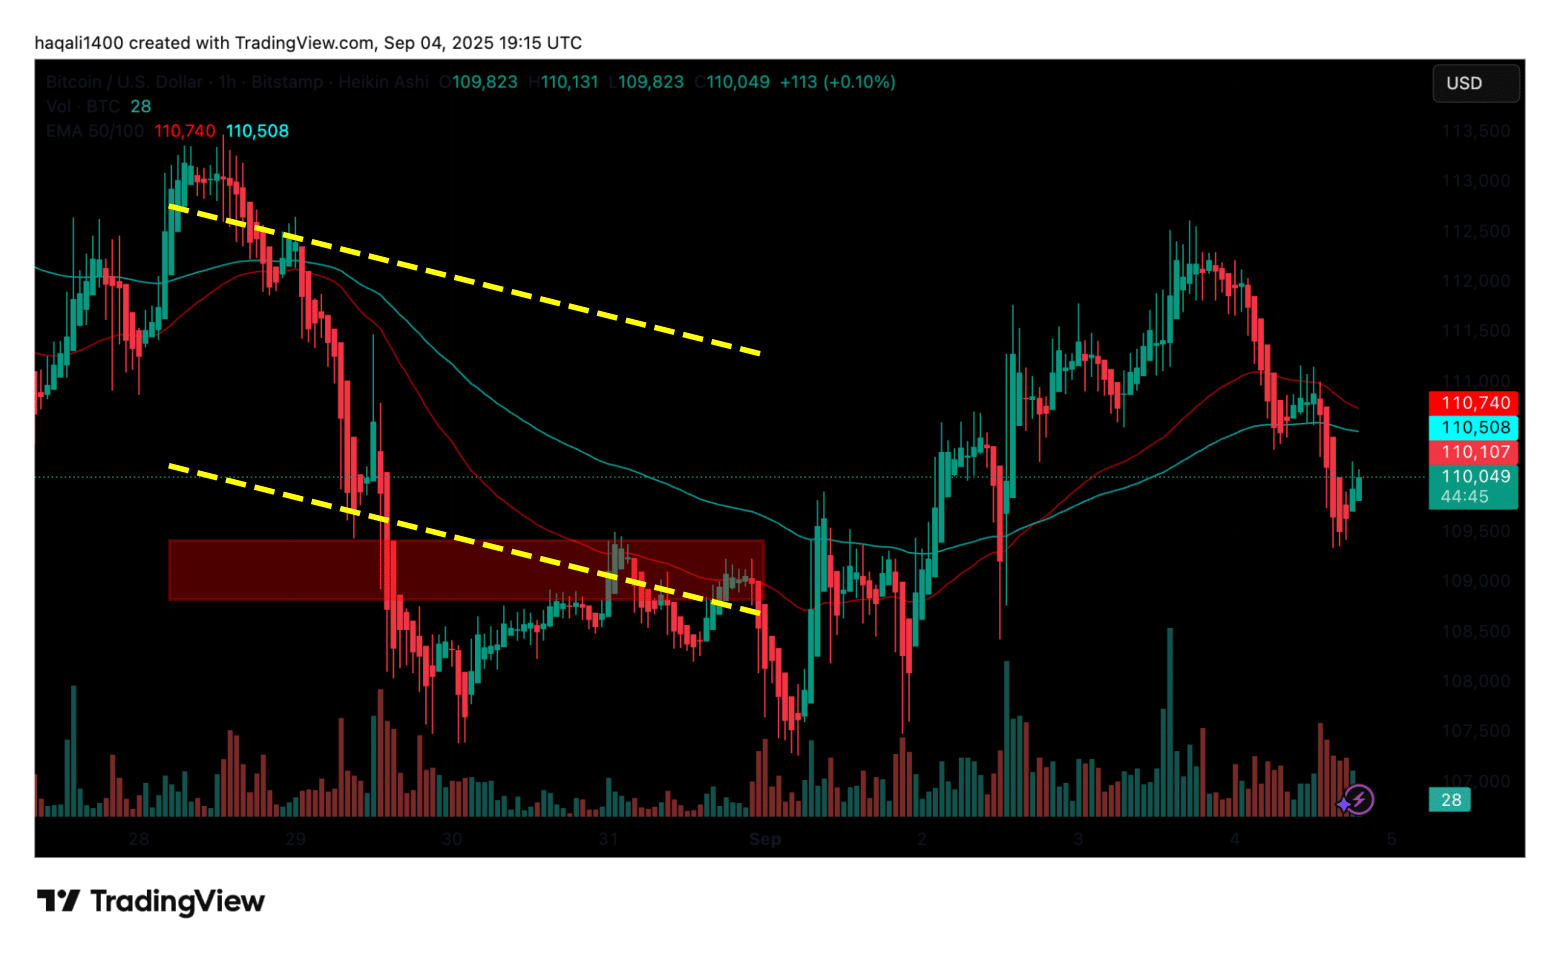
(Source – BTC USDT, TradingView)
Currently, Bitcoin price trades around $110,049, marking a decline of -2.5% just above that support area.
The 50-day and 100-day exponential moving averages are moving close together. This reflects uncertainty in the short term and the possibility of a sharp breakout.
If the $109,500 support breaks, selling could accelerate and drag the price toward $108,000. On the other hand, if the level holds, Bitcoin could retest resistance around $111,000-$112,000.
According to the CryptoQuant data, the Binance Bitcoin-to-stablecoin ratio is now close to 1, which has often lined up with market bottoms. The measure compares Bitcoin reserves with stablecoin reserves on Binance.
The last time it touched parity was in March, when Bitcoin dipped to $78,000 before staging a rally toward its $123,000 all-time high.
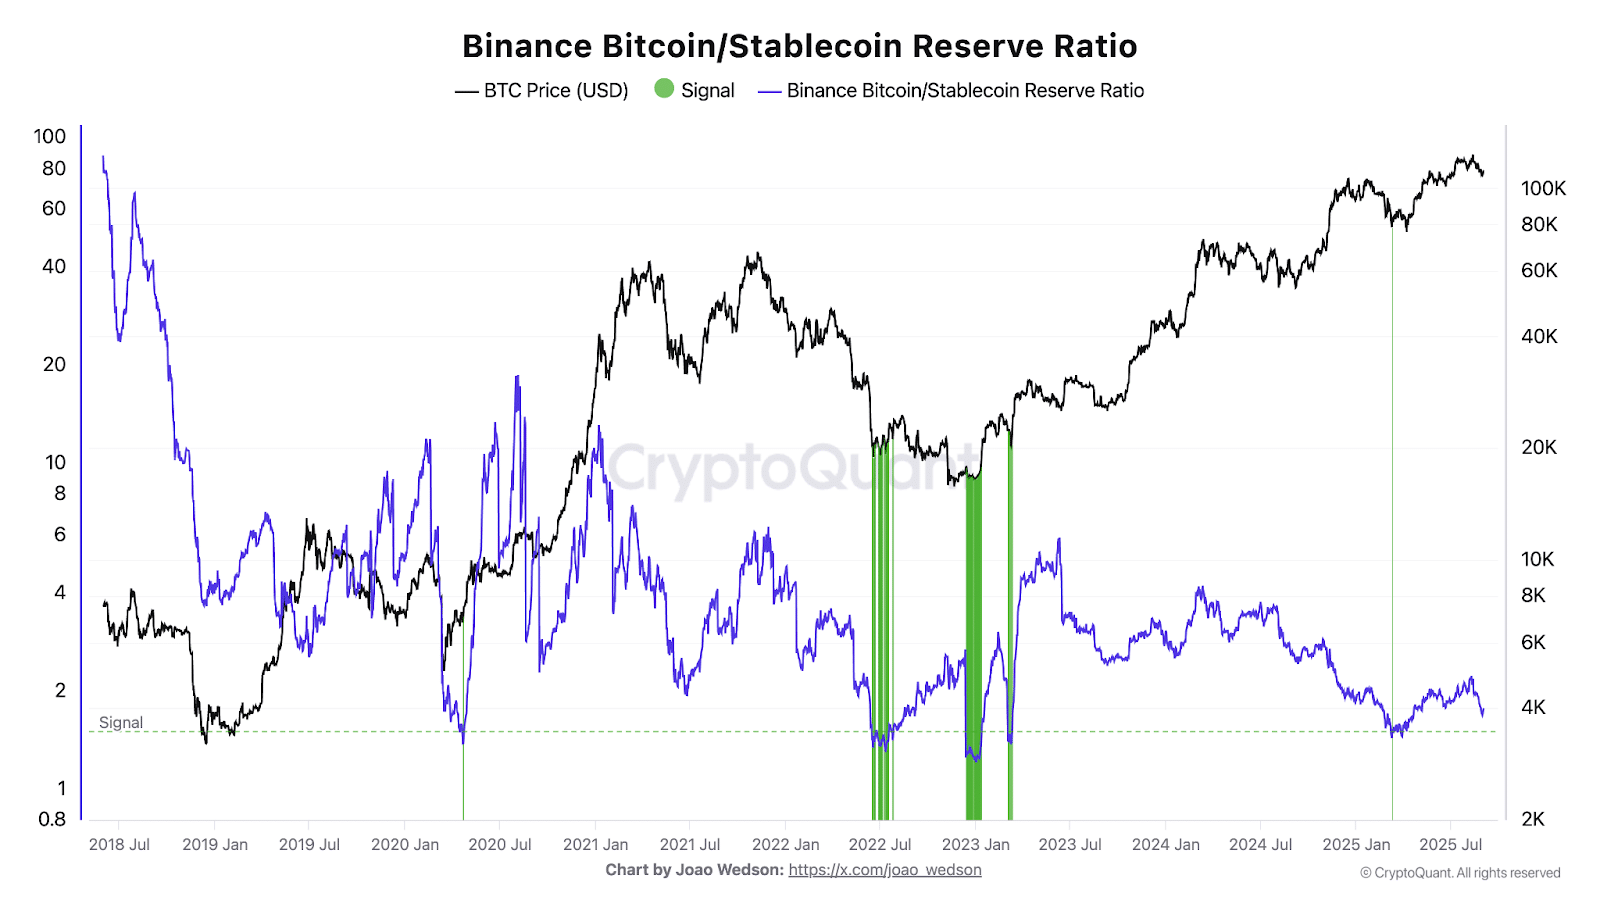
(Source: Bitcoin/Stablecoin Reserve Ratio – CryptoQuant)
This ratio has increased to such heights twice since the previous bear market.
The ratio has never been seen before during the previous cycles, except at the end of bear markets, and it flashed again in March 2023. Its renewal now might not indicate a bottom, but just indicate the beginning of a greater correction.
Could a Drop Below $108K Trigger Forced Selling for Bitcoin?
Both directions also have hot spots on the Bitcoin liquidation heatmap provided by Coinglass.
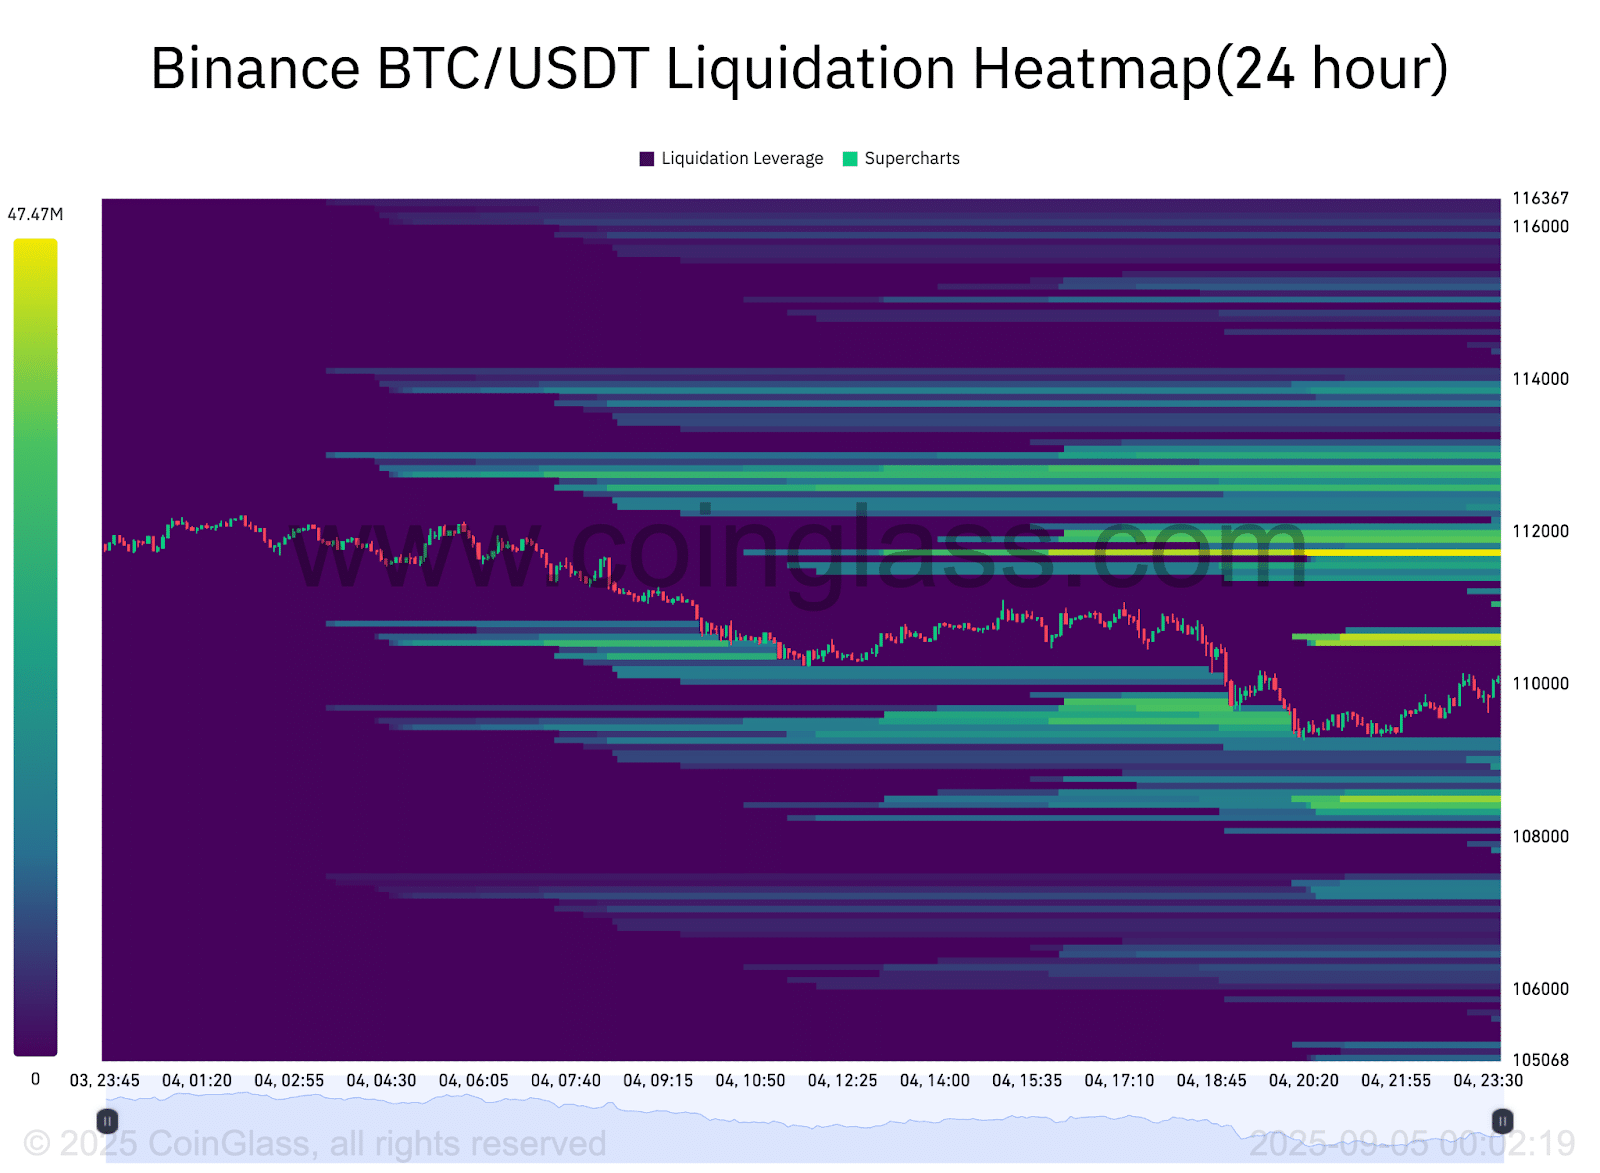
(Source: Bitcoin Liquidation Heatmap – Coinglass)
On the positive side, the liquidation leverage is between $112,000 and $114,000. Any further breakout would trigger a series of short liquidations, which would cause a squeeze in case momentum increases.
Liquidation levels are negative, between $108,000 and $106,000. Close to 20M-40M positions are resting in this range.
According to analysts, below this zone, forced selling may cause a more severe drop in Bitcoin price.
The overall liquidation structure indicates that the traders are distributed on either side. Shorts would be at risk below $108000, and longs would be at risk above $112000.
The heatmap highlights a current battle between bulls and bears and indicates that a big MOVE may be acute after liquidity levels on either side are tested.
The latest Crypto Fear and Greed Index from CoinGlass reads at 56, which is neutral but leans toward greed.
This indicates that sentiment is slightly bullish even though traders are cautious. Historically, when the index moves into greed while Bitcoin trades NEAR highs, markets often see short-term corrections as profit-taking starts.
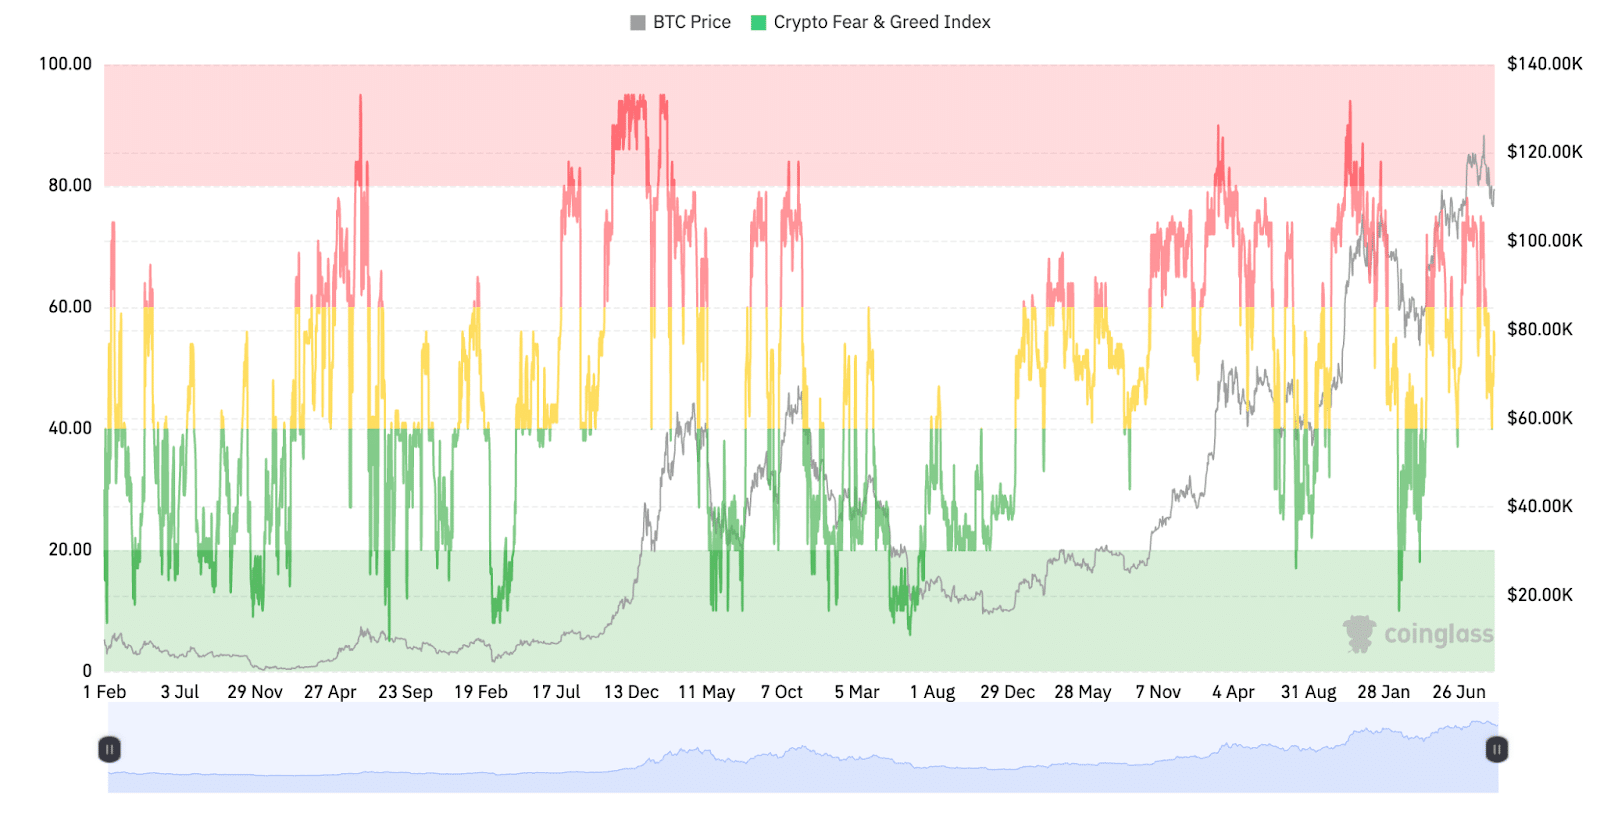
(Source: BTC Fear and Greed Index – Coinglass)
A sign of mild greed shows that buyers are still active. But if momentum slows, the chance of a pullback grows.
For Bitcoin, that could mean more volatility around current levels. Traders are watching closely to see if the move toward greed brings a cooling phase before any push higher.
Charts shared by Wedson on X show that BTC/USD is moving in line with past cycle patterns.
Still, this cycle carries key differences. One of the biggest is the strong role of institutional investors and Bitcoin’s growing status as a macro asset.

Log in to Reply
Log in to comment your thoughtsComments
Related Articles
|Square
Get the BTCC app to start your crypto journey
Get started today Scan to join our 100M+ users