SEI Price Alert: Cup and Handle Breakout Signals Major Rally—Here’s Your Entry Point

SEI’s chart just flashed a textbook bullish signal—and traders are scrambling for position.
The cup-and-handle formation broke resistance like a hot knife through butter. Now, the question isn’t *if* SEI runs, but *how high*.
Timing the trade: Wait for the retest of the breakout level—that’s your buy zone. No retest? Chase with tight stops. (Yes, we know—‘buy high, sell higher’ is Wall Street’s version of alchemy.)
Targets: Measure the cup’s depth, project it upward. Basic TA, yet somehow still more reliable than most VC pitch decks.
Active traders are already front-running this move. Retail FOMO? Probably incoming. Just remember: In crypto, ‘technical analysis’ is sometimes just astrology for finance bros.
SEI Price Forms Classic Bullish Pattern But Faces Key Resistance
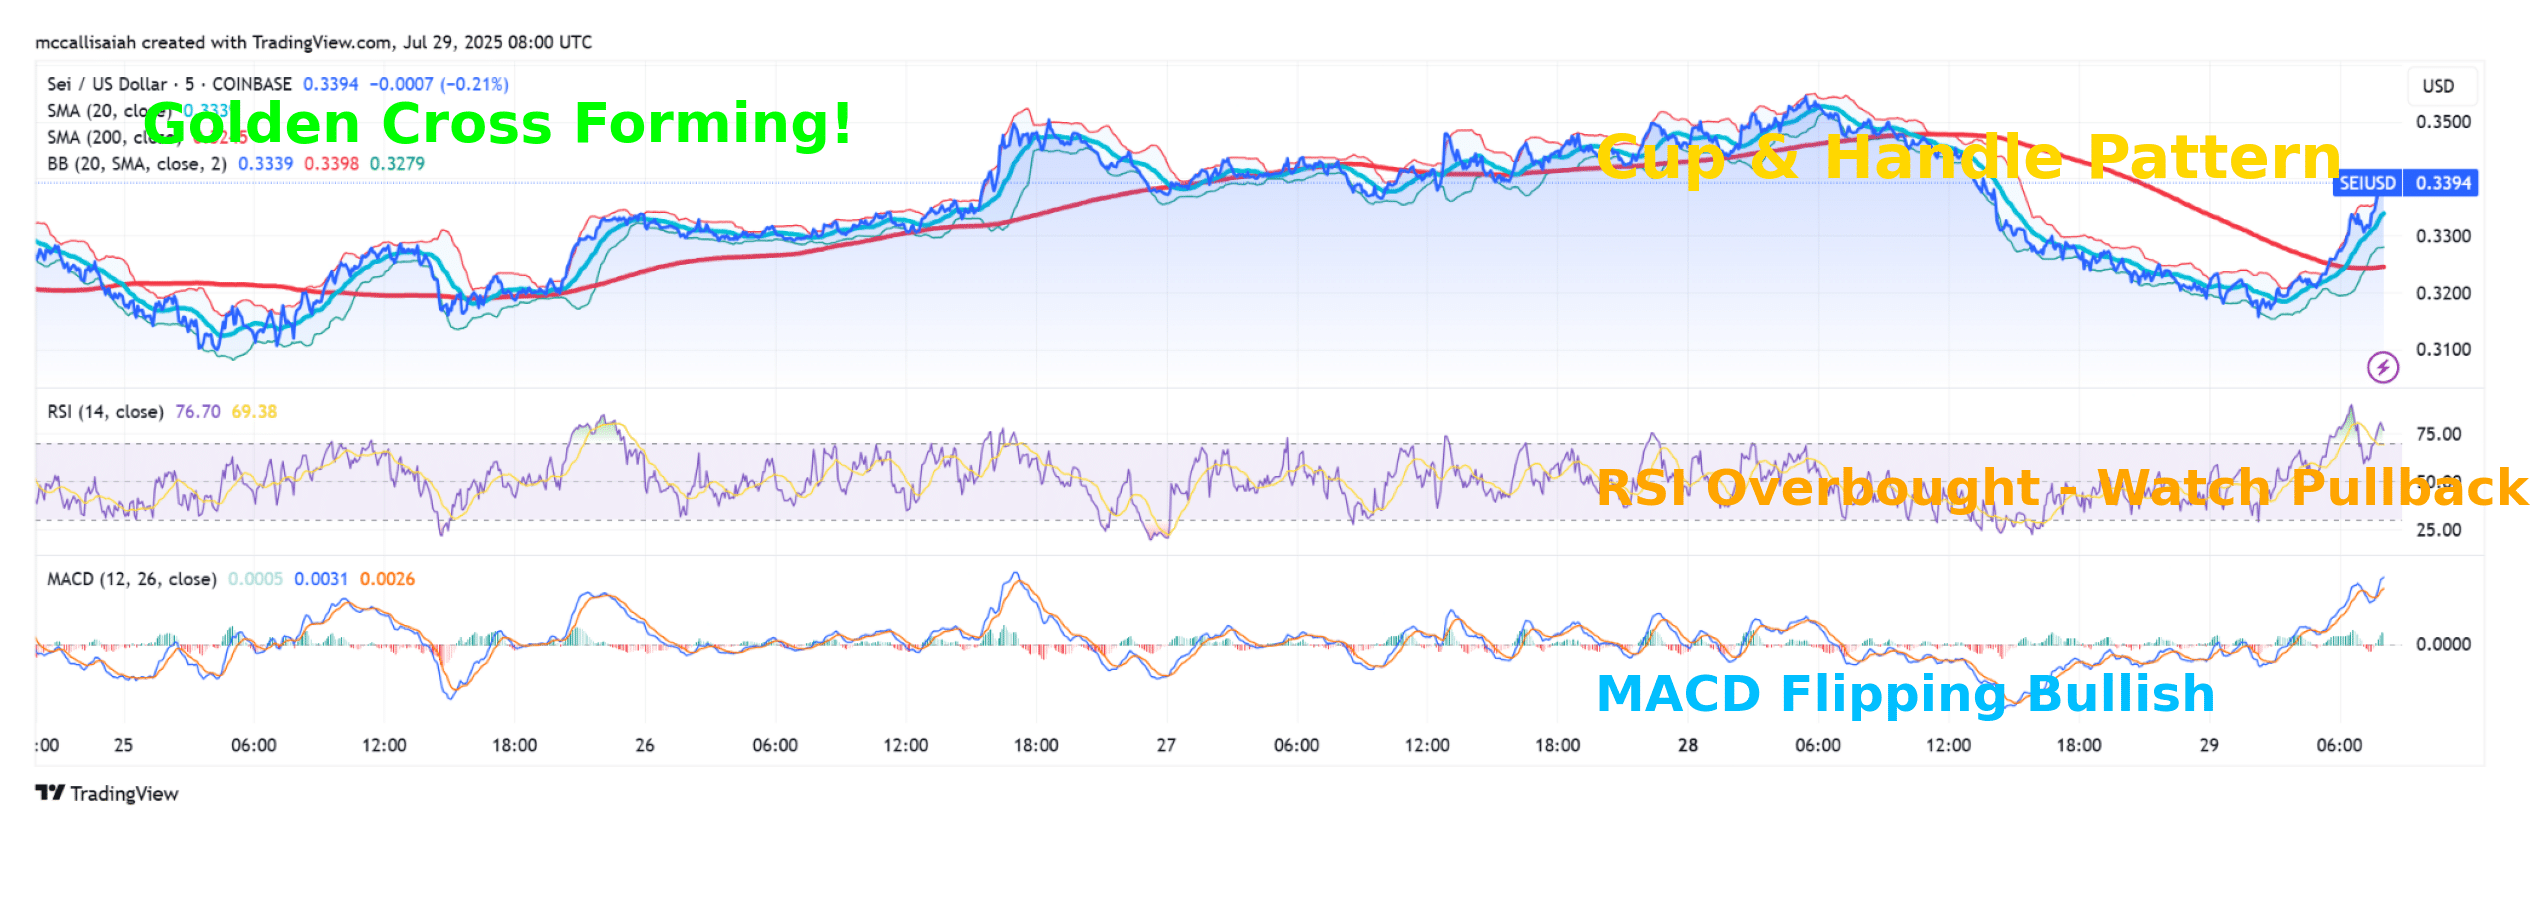
Over the past 24 hours, SEI dropped 5.5%, once again testing the lower bounds of its three-week range between $0.317 and $0.37. Despite this dip, the broader structure remains constructive.
A textbook Cup and Handle formation appears to be forming on the 1D chart and the price is attempting to break out of the “handle” portion, and multiple indicators are starting to confirm the momentum shift.
“That’s a Golden Cross, and it typically signals trend continuation to the upside.” – 99Bitcoins Analyts
$SEI interesting L1 with a lot going on. Chart on weekly doing higher lows and higher heights since it found support at the $0.14 range. It has basically done a full reset from the top in 2024.
PoC at $0.26 must hold for a continued bullish structure.
Targets:
Conservative $1.44… pic.twitter.com/Vaj3yMERq6
— Dorkchicken (@DorkChicken) July 29, 2025
Meanwhile, overbought signals are flashing, with the RSI pushing past 75. It’s a classic setup for a pause or pullback, though still structurally bullish.
Why SEI Is Still Trading Sideways Despite Bullish Indicators
While the daily indicators flash bullish, the catch is that Sei continues to face rejection below $0.35 and remains stuck in range.
So far, price action suggests that SEI is still very much locked in consolidation, and the breakout narrative hasn’t been confirmed just yet.
Is SEI a Buy Right Now?
SEI’s longer-term case is intact, but near-term trade setups are clearer on the 4H. If BTC stays stable, this could mark a high-reward entry.
A breakout over $0.35 unlocks room to run. Lose $0.324, and the bottom of the range is back in play.
Key Takeaways
- SEI’s bullish setup is starting to take shape, and we might be looking at the best entry point in weeks, but there’s a catch.
- While the daily indicators flash bullish, the catch is that SEI continues to face rejection below $0.35 and remains stuck in range.
