SUI Price Surge: The Ethereum Killer Trade You Can’t Afford to Miss in 2025

Move over, Ethereum—SUI's gunning for the throne. This isn't just another 'ETH killer' hype cycle; it's a full-scale blockchain coup in motion.
Why SUI could dominate the next bull run
While legacy chains groan under gas fees, SUI's parallel execution engine slices through transactions like a hot knife through butter. Developers are fleeing congested networks faster than hedge funds exit bad positions (which, let's be honest, is most positions).
The institutional FOMO factor
VCs aren't just dipping toes—they're cannonballing into SUI's liquidity pool. Smart money sees what retail hasn't clocked yet: this isn't about dethroning Ethereum, it's about rewriting the entire smart contract playbook.
One cynical truth: The 'next big thing' always looks obvious—in hindsight. But right now? SUI's chart is printing the kind of gains that make TradFi bros reconsider their life choices.
Let that sink in:
A network launched 2 years ago is about to outpace the OG smart contract layer
Usage > narrative
Speed > history
In May:
•… pic.twitter.com/tA2piLLRbN
— eye zen hour (@eyezenhour) June 25, 2025
Usage is definitely an important metric, as well as stablecoin movements. Interestingly the 14 million sui monthly stablecoin transactions is nearing Ethereum’s 16 million. More usage probably does mean more demand for the native coin SUI. At least what can be for sure is that fees are being paid.
Is SUI Price Getting Ready For a Massive Run?
(SUIUSD)
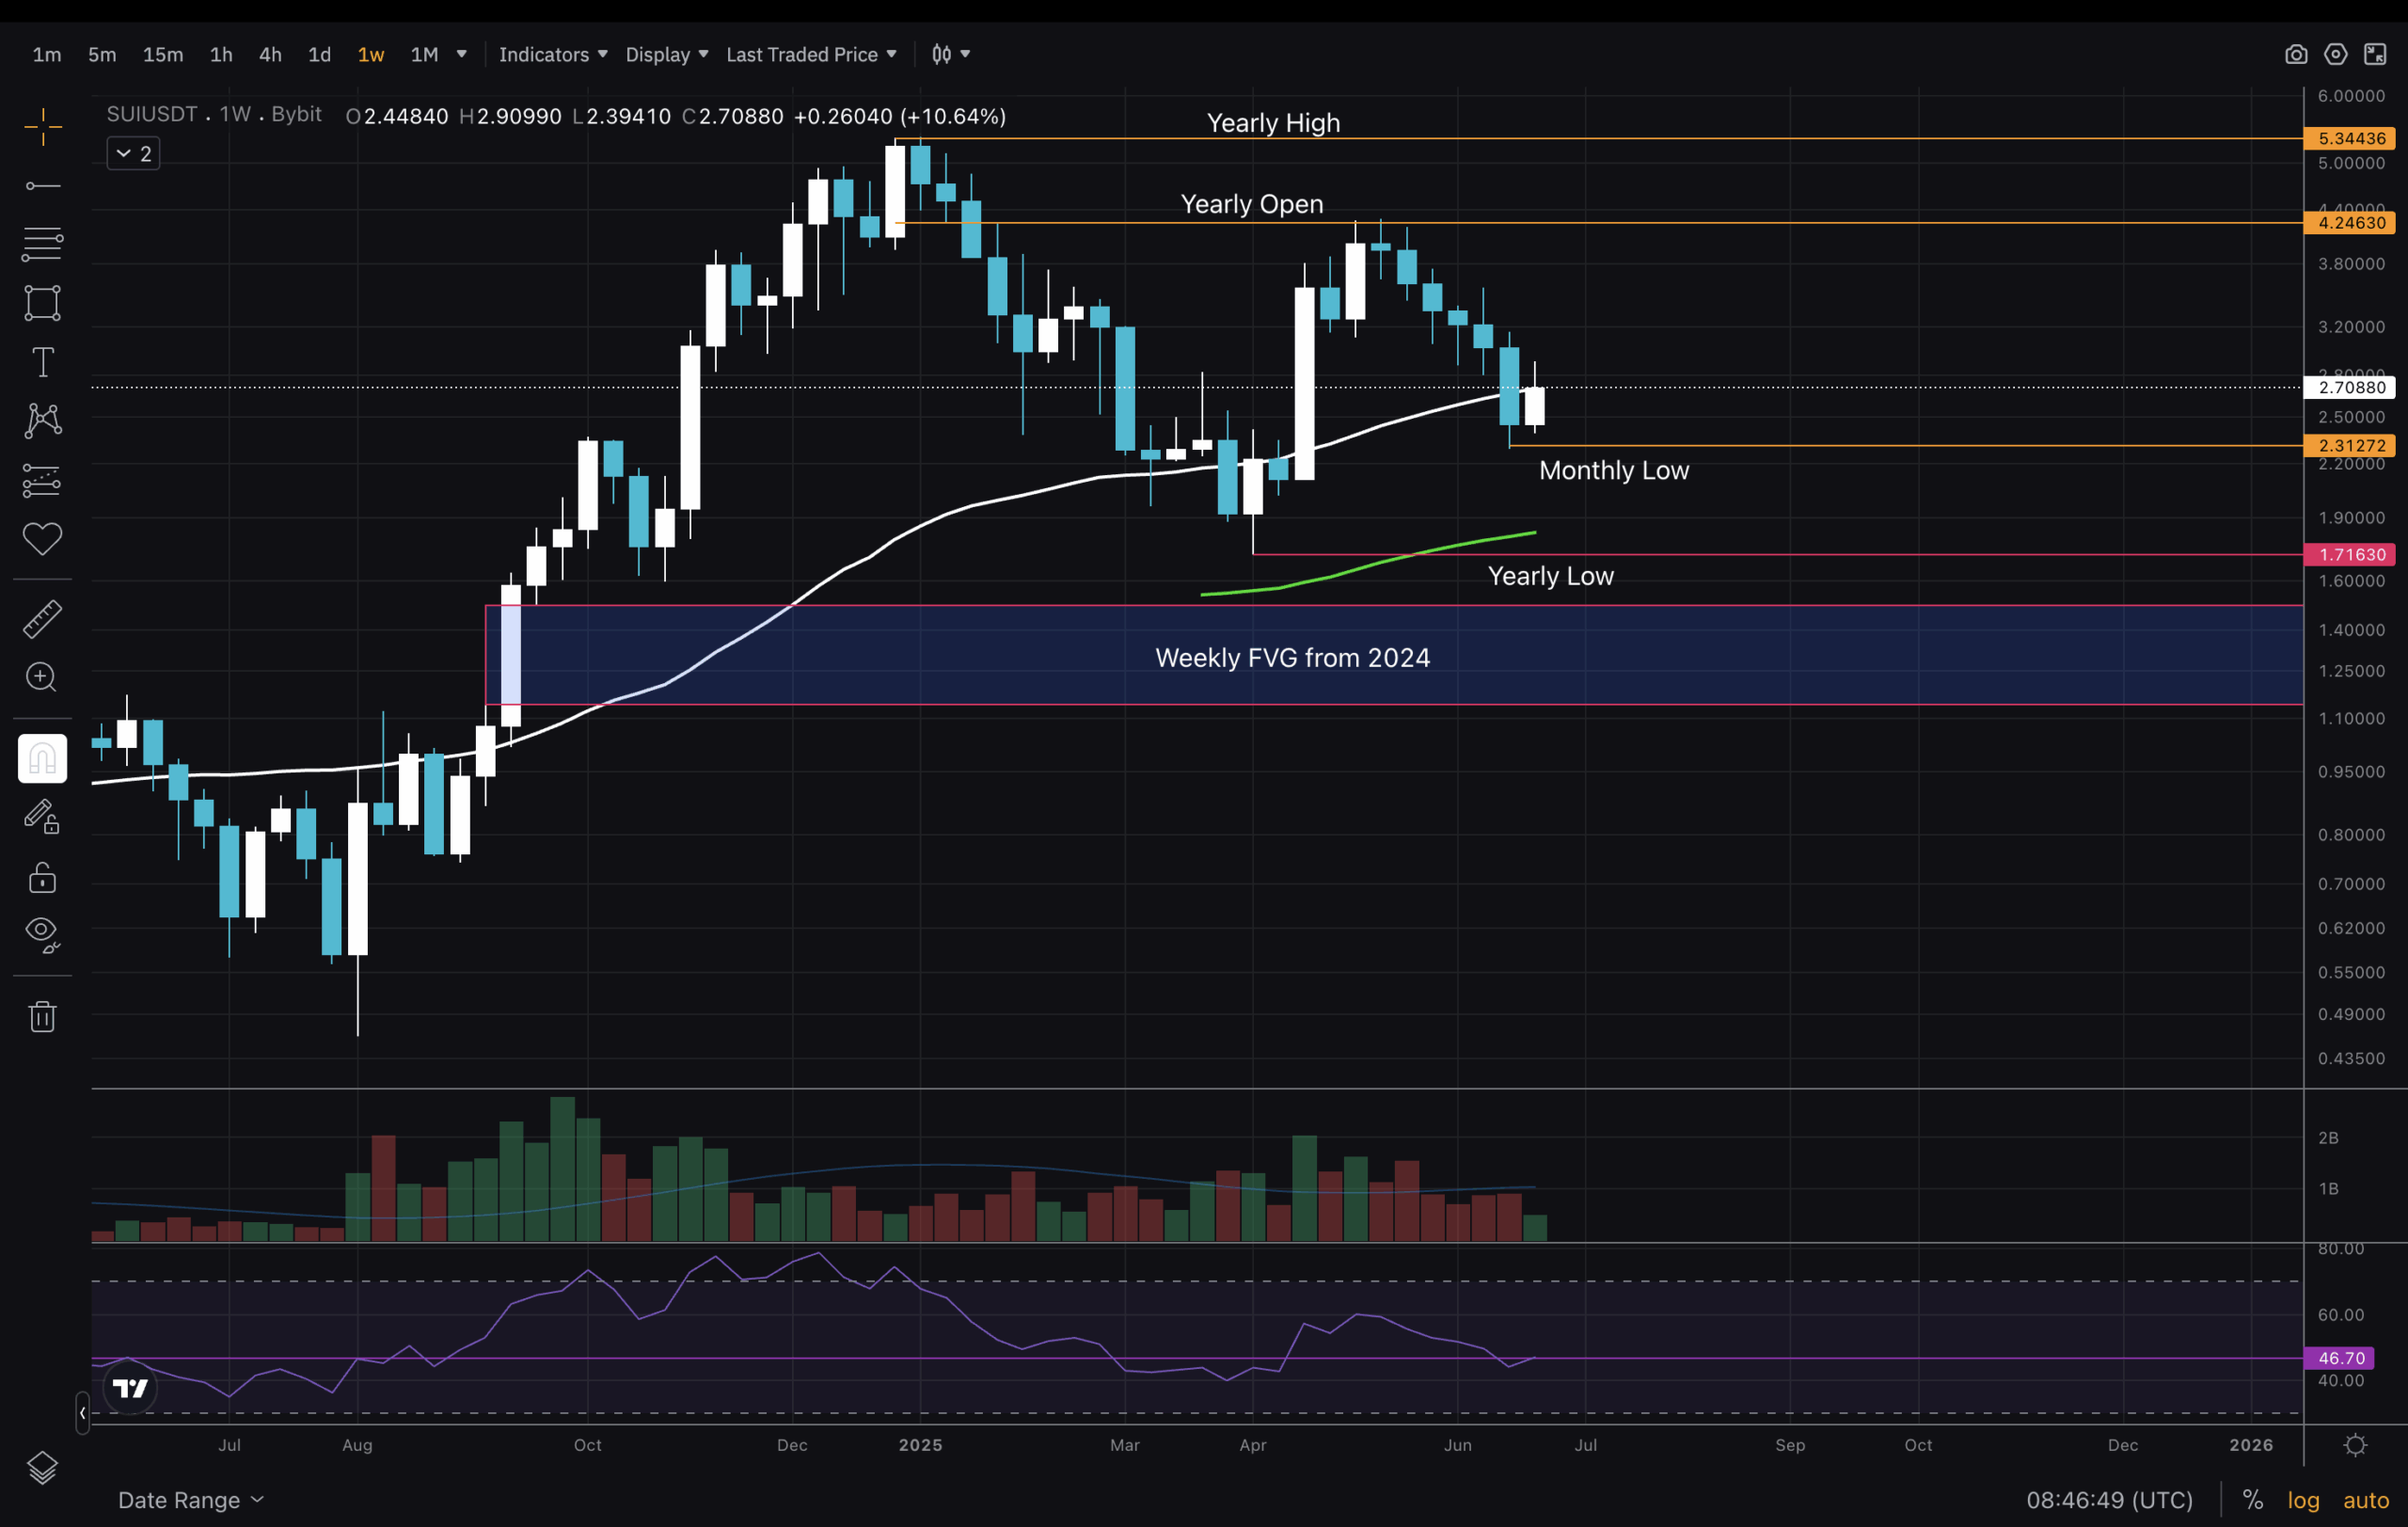
We will first look at the Weekly timeframe at the beginning of our analysis. What jumps out first is that the trend is bullish – higher highs and higher lows. It looks like the rejection at Yearly Open can be a lower high, though a lower one that keeps the structure could be within the FVG or a bit lower, then the price WOULD be considered ranging or choppy. MA100 here could be a support level. Or another scenario, if we don’t go up after 5 consecutive red(blue on my chart) candles, is a test or sweep of the Yearly Low.
(SUIUSD)
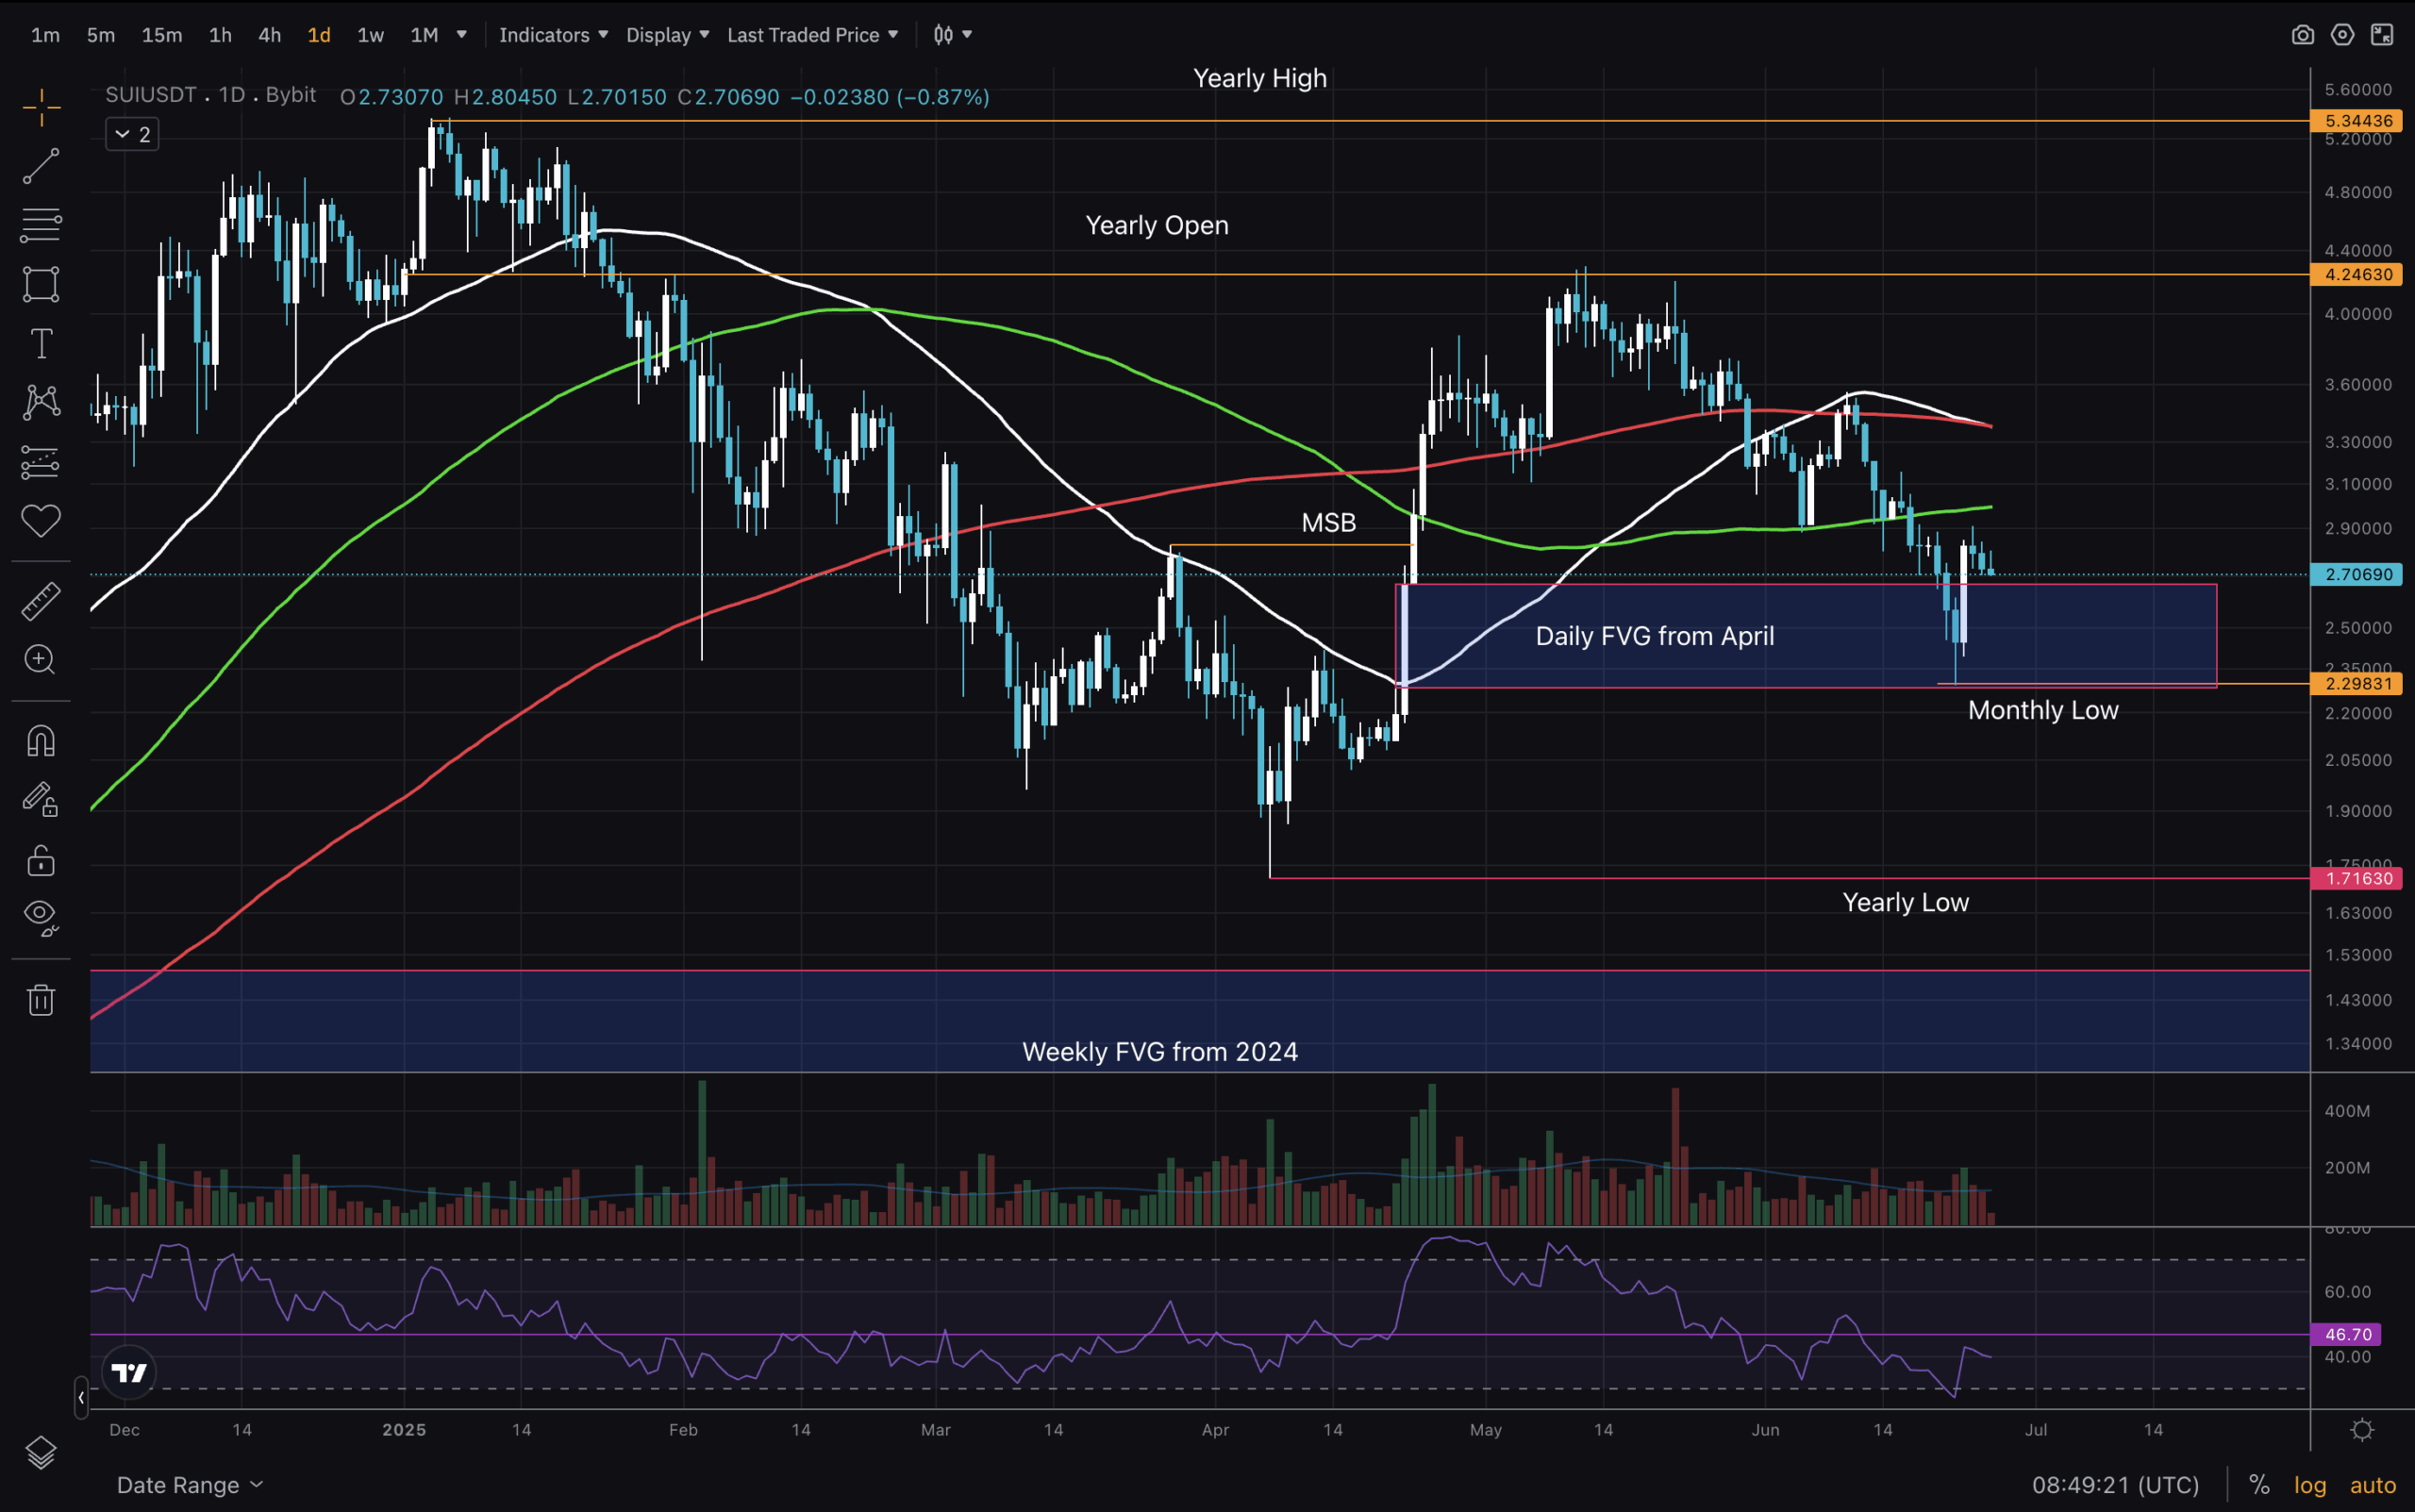
Next, we take a look at the Daily timeframe. So far, there is a Daily FVG that got filled a few days ago with a bullish engulfing candle, taking the price above the zone. A potential sign of strength.
As we see from April, prices can increase significantly in just a few days. There was a break in the structure during that pump. The drop below the moving averages is not pretty, and we’d like these to be reclaimed ASAP!
Hourly Chart Exercise: Looking For Trade Setups
(SUIUSD)
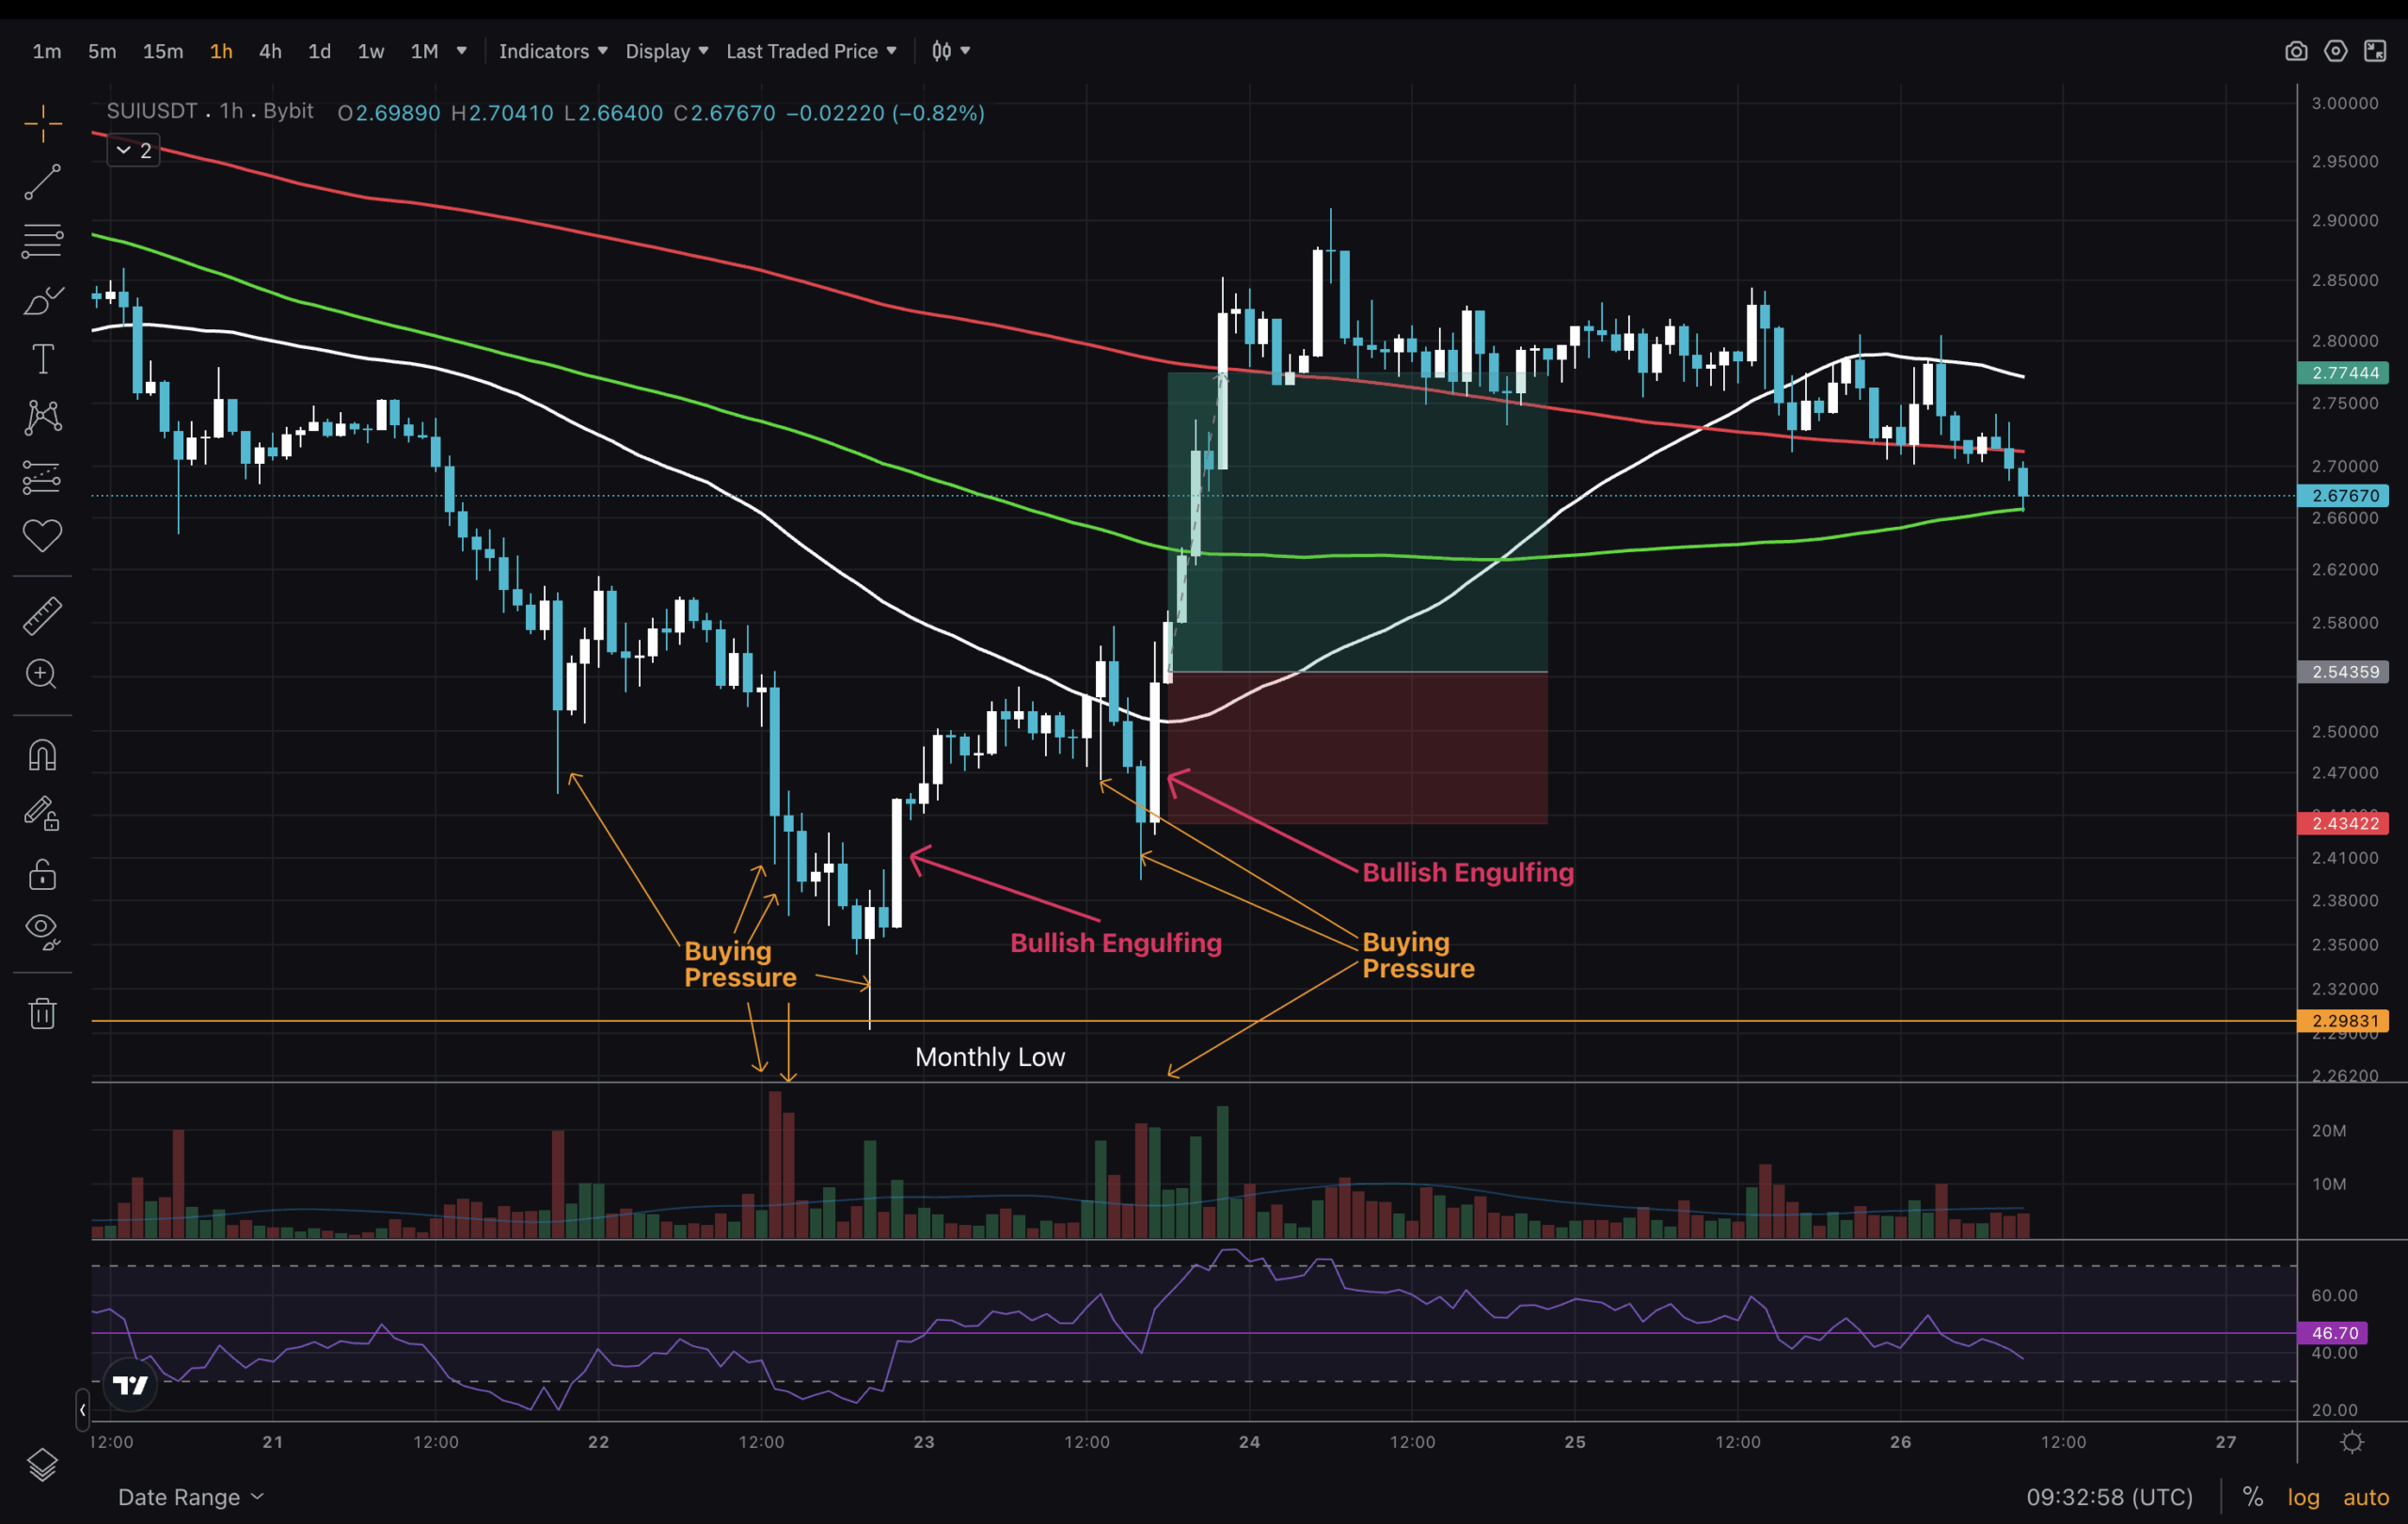
Last, we will study the 1H (hourly) chart for entry setups, using price action and volume. Here, the price has dropped by tens of %, and we’re seeing some early buyer pressure. RSI is in an oversold area on the 21st of June, but the price makes another low.
On that low (Monthly low), the RSI is a bit higher; there’s a small body and large wick underneath, followed by a Bullish Engulfing candle. Price moves slightly, followed by another 3 sell candles and clear buyer pressure again. Long entry triggered after the 2nd Bullish Engulfing candle, providing a 2R profit. See how buyer pressure sustains over the next few days/weeks.
Join The 99Bitcoins News Discord Here For The Latest Market Updates
SUI Price Movements: Is It A Good Trade For 2025?
- Daily FVG from April filled, followed by Bullish Engulfing candle
- 2024 Weekly FVG might not be tested, though we keep it as plausible
- Price needs to move above 1D Moving Averages
- Demand visible on 1H timeframe
