Bitcoin’s Historic Surge – The 21st Century’s Ultimate Wealth Rush? Traders Fight for Final BTC-USD Entry Points

Bitcoin's parabolic rally leaves Wall Street scrambling as institutional FOMO reaches fever pitch. The digital gold rush of our generation accelerates—but how long before the suits try to regulate it into oblivion?
Market frenzy erupts as BTC flirts with all-time highs
Trading desks report unprecedented demand for last-minute exposure. Retail traders pile in while hedge funds quietly accumulate through OTC desks—the ultimate 'do as I say, not as I do' financial spectacle.
The great crypto land grab accelerates
With traditional markets stagnating, capital floods into digital assets at rates not seen since the 2021 bull run. Bitcoin's network strain indicators flash red as transaction fees spike—proof this isn't just paper trading fantasy.
Will this be the cycle that finally breaks the dollar's dominance? Or just another pump before the inevitable 'risk-off' tantrum from the Fed? Either way—the casino's open, and the house always wins.
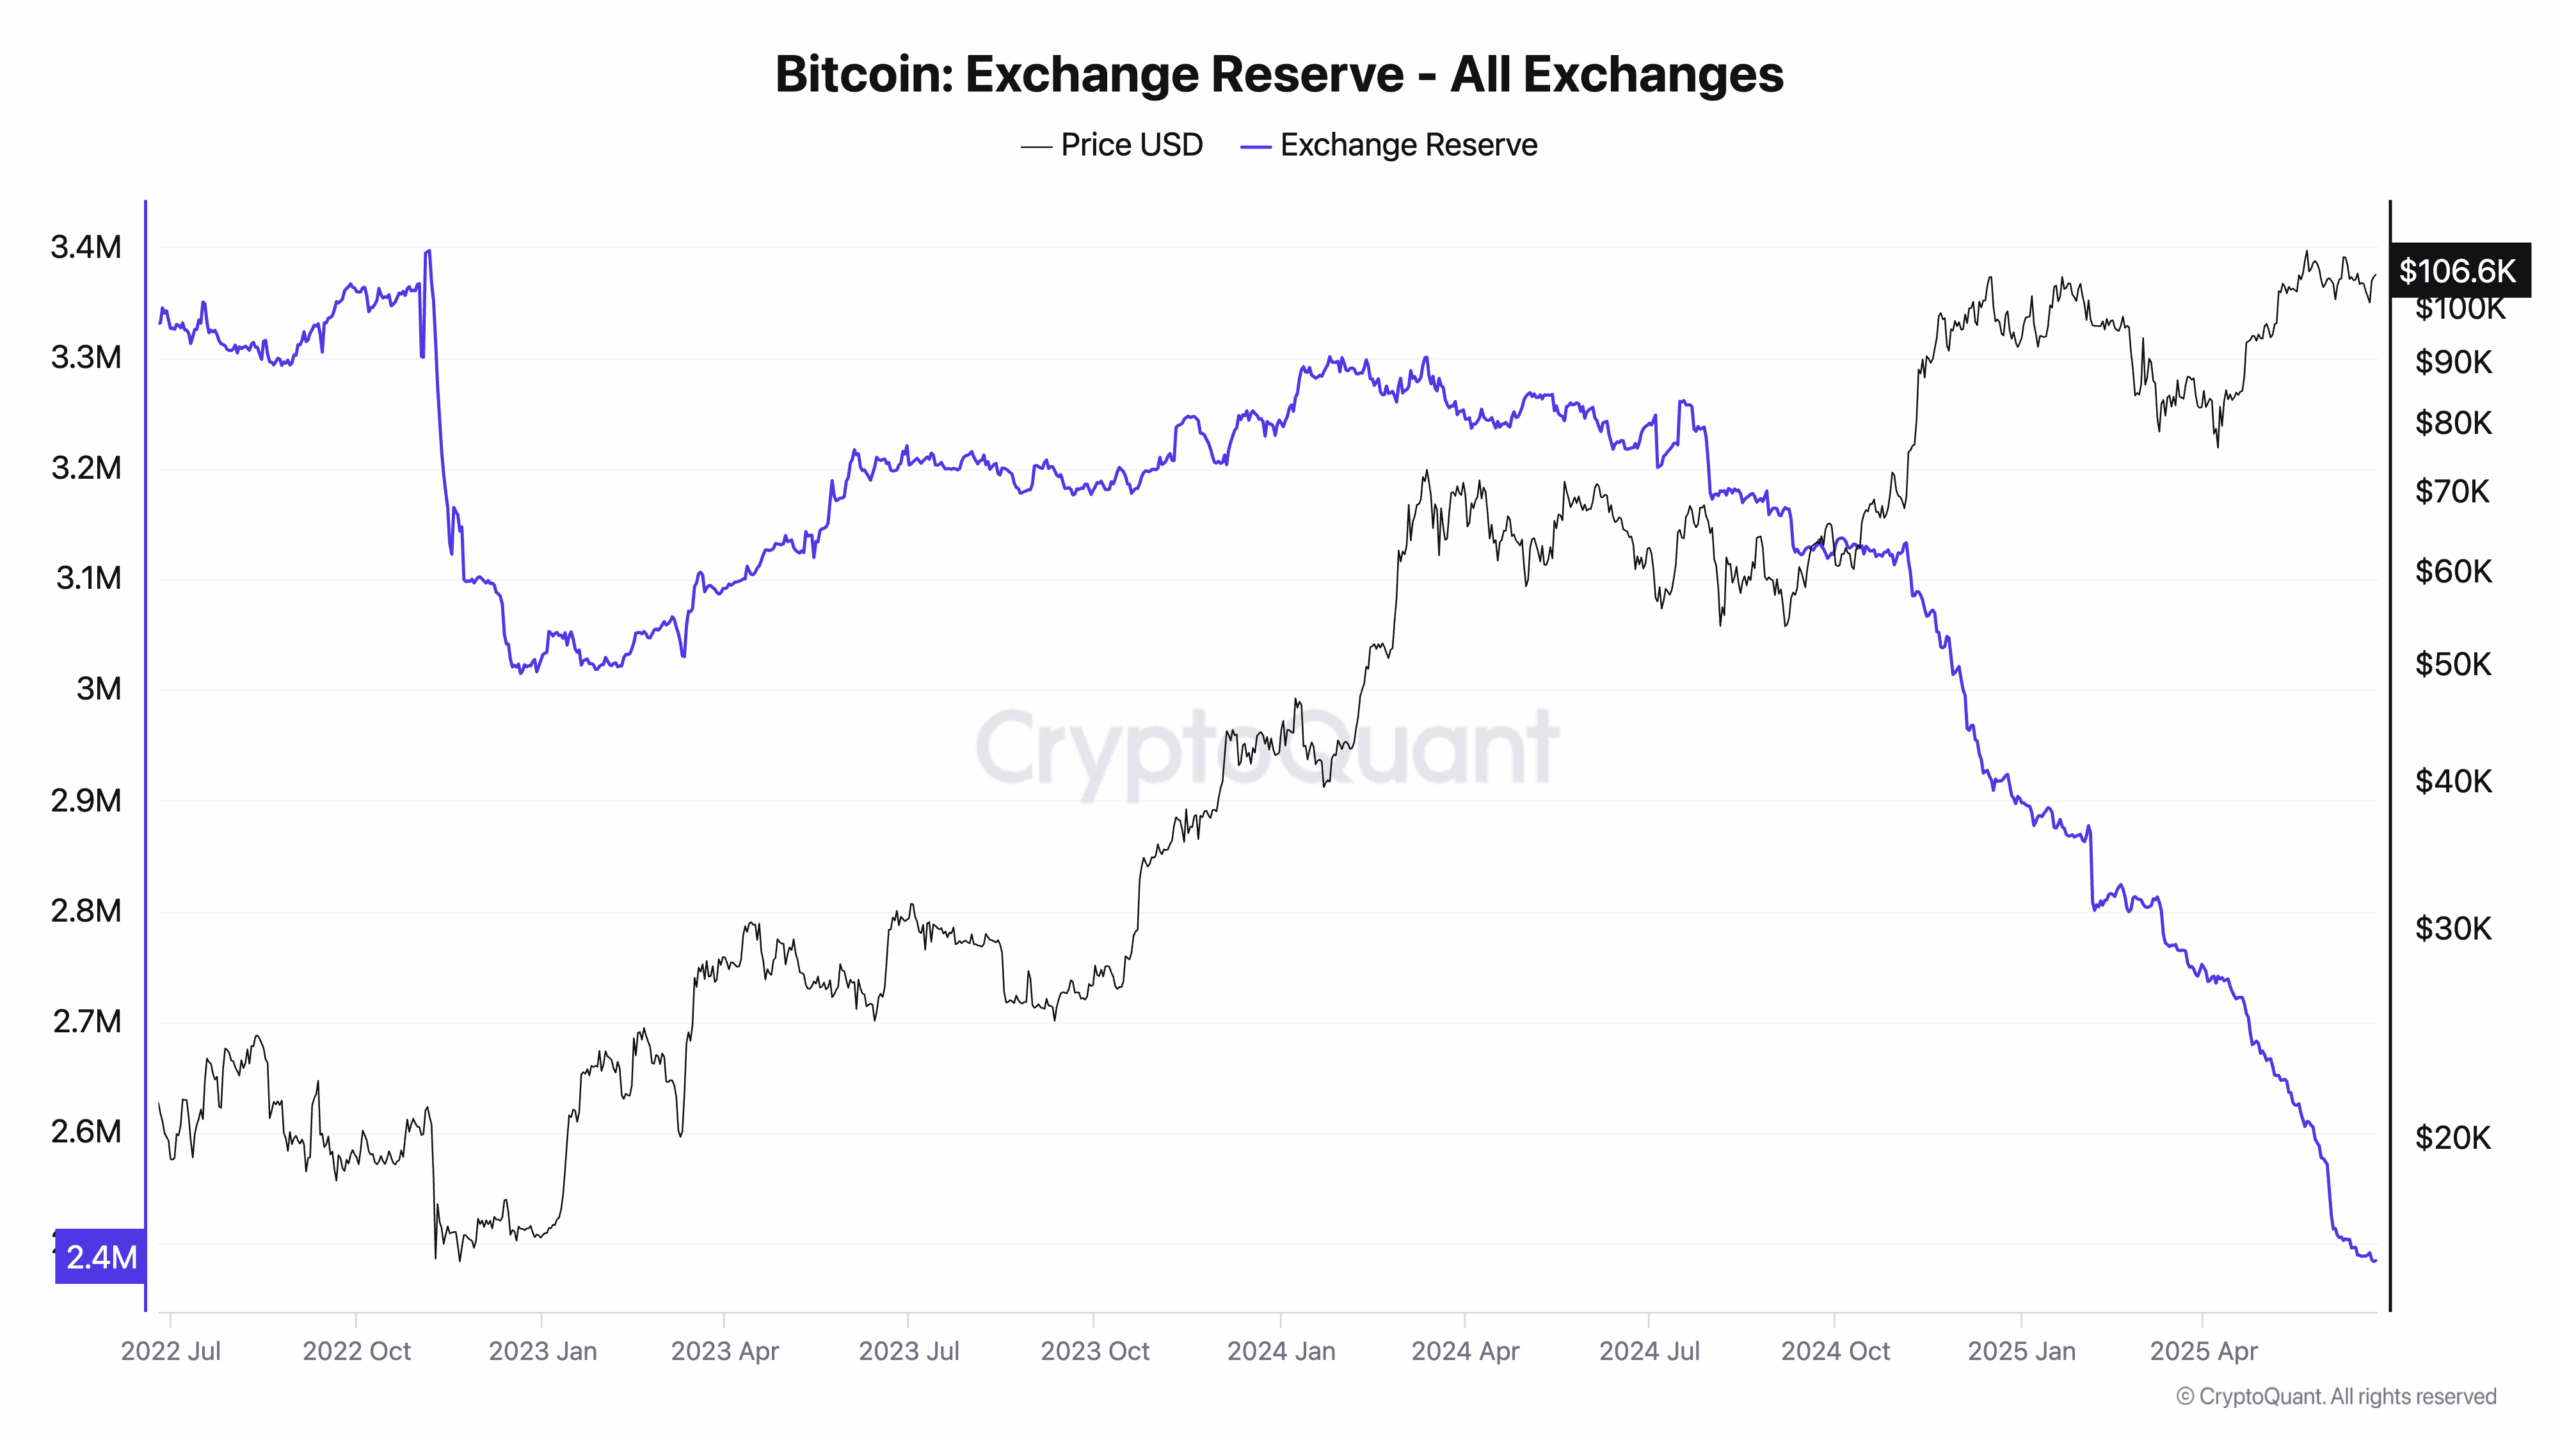
The Bitcoin balance on exchanges has dropped by 800,000 between June 2024 and today. The estimated amount of BTC mined for the past year is around 177,000.
#Bitcoin
MVRV Z-Score – in my opinion the most important on-chain metric – tells us the true story of where we are in the BTC cycle.
MVRV shows the difference between Bitcoin's market cap and what people actually paid for their coins (realized cap). The Z-Score normalizes this… pic.twitter.com/trwe5AESDG
— Stockmoney Lizards (@StockmoneyL) June 24, 2025
Stockmoney Lizards’ observation that people are still not massively in profit means that selling pressure should still be rather low, compared to what it should be at the end of the bullrun. Great fundamentals! Now it’s time to MOVE on to technical analysis.
Is Bitcoin Rush Displayed On the Charts?
(BTCUSD)
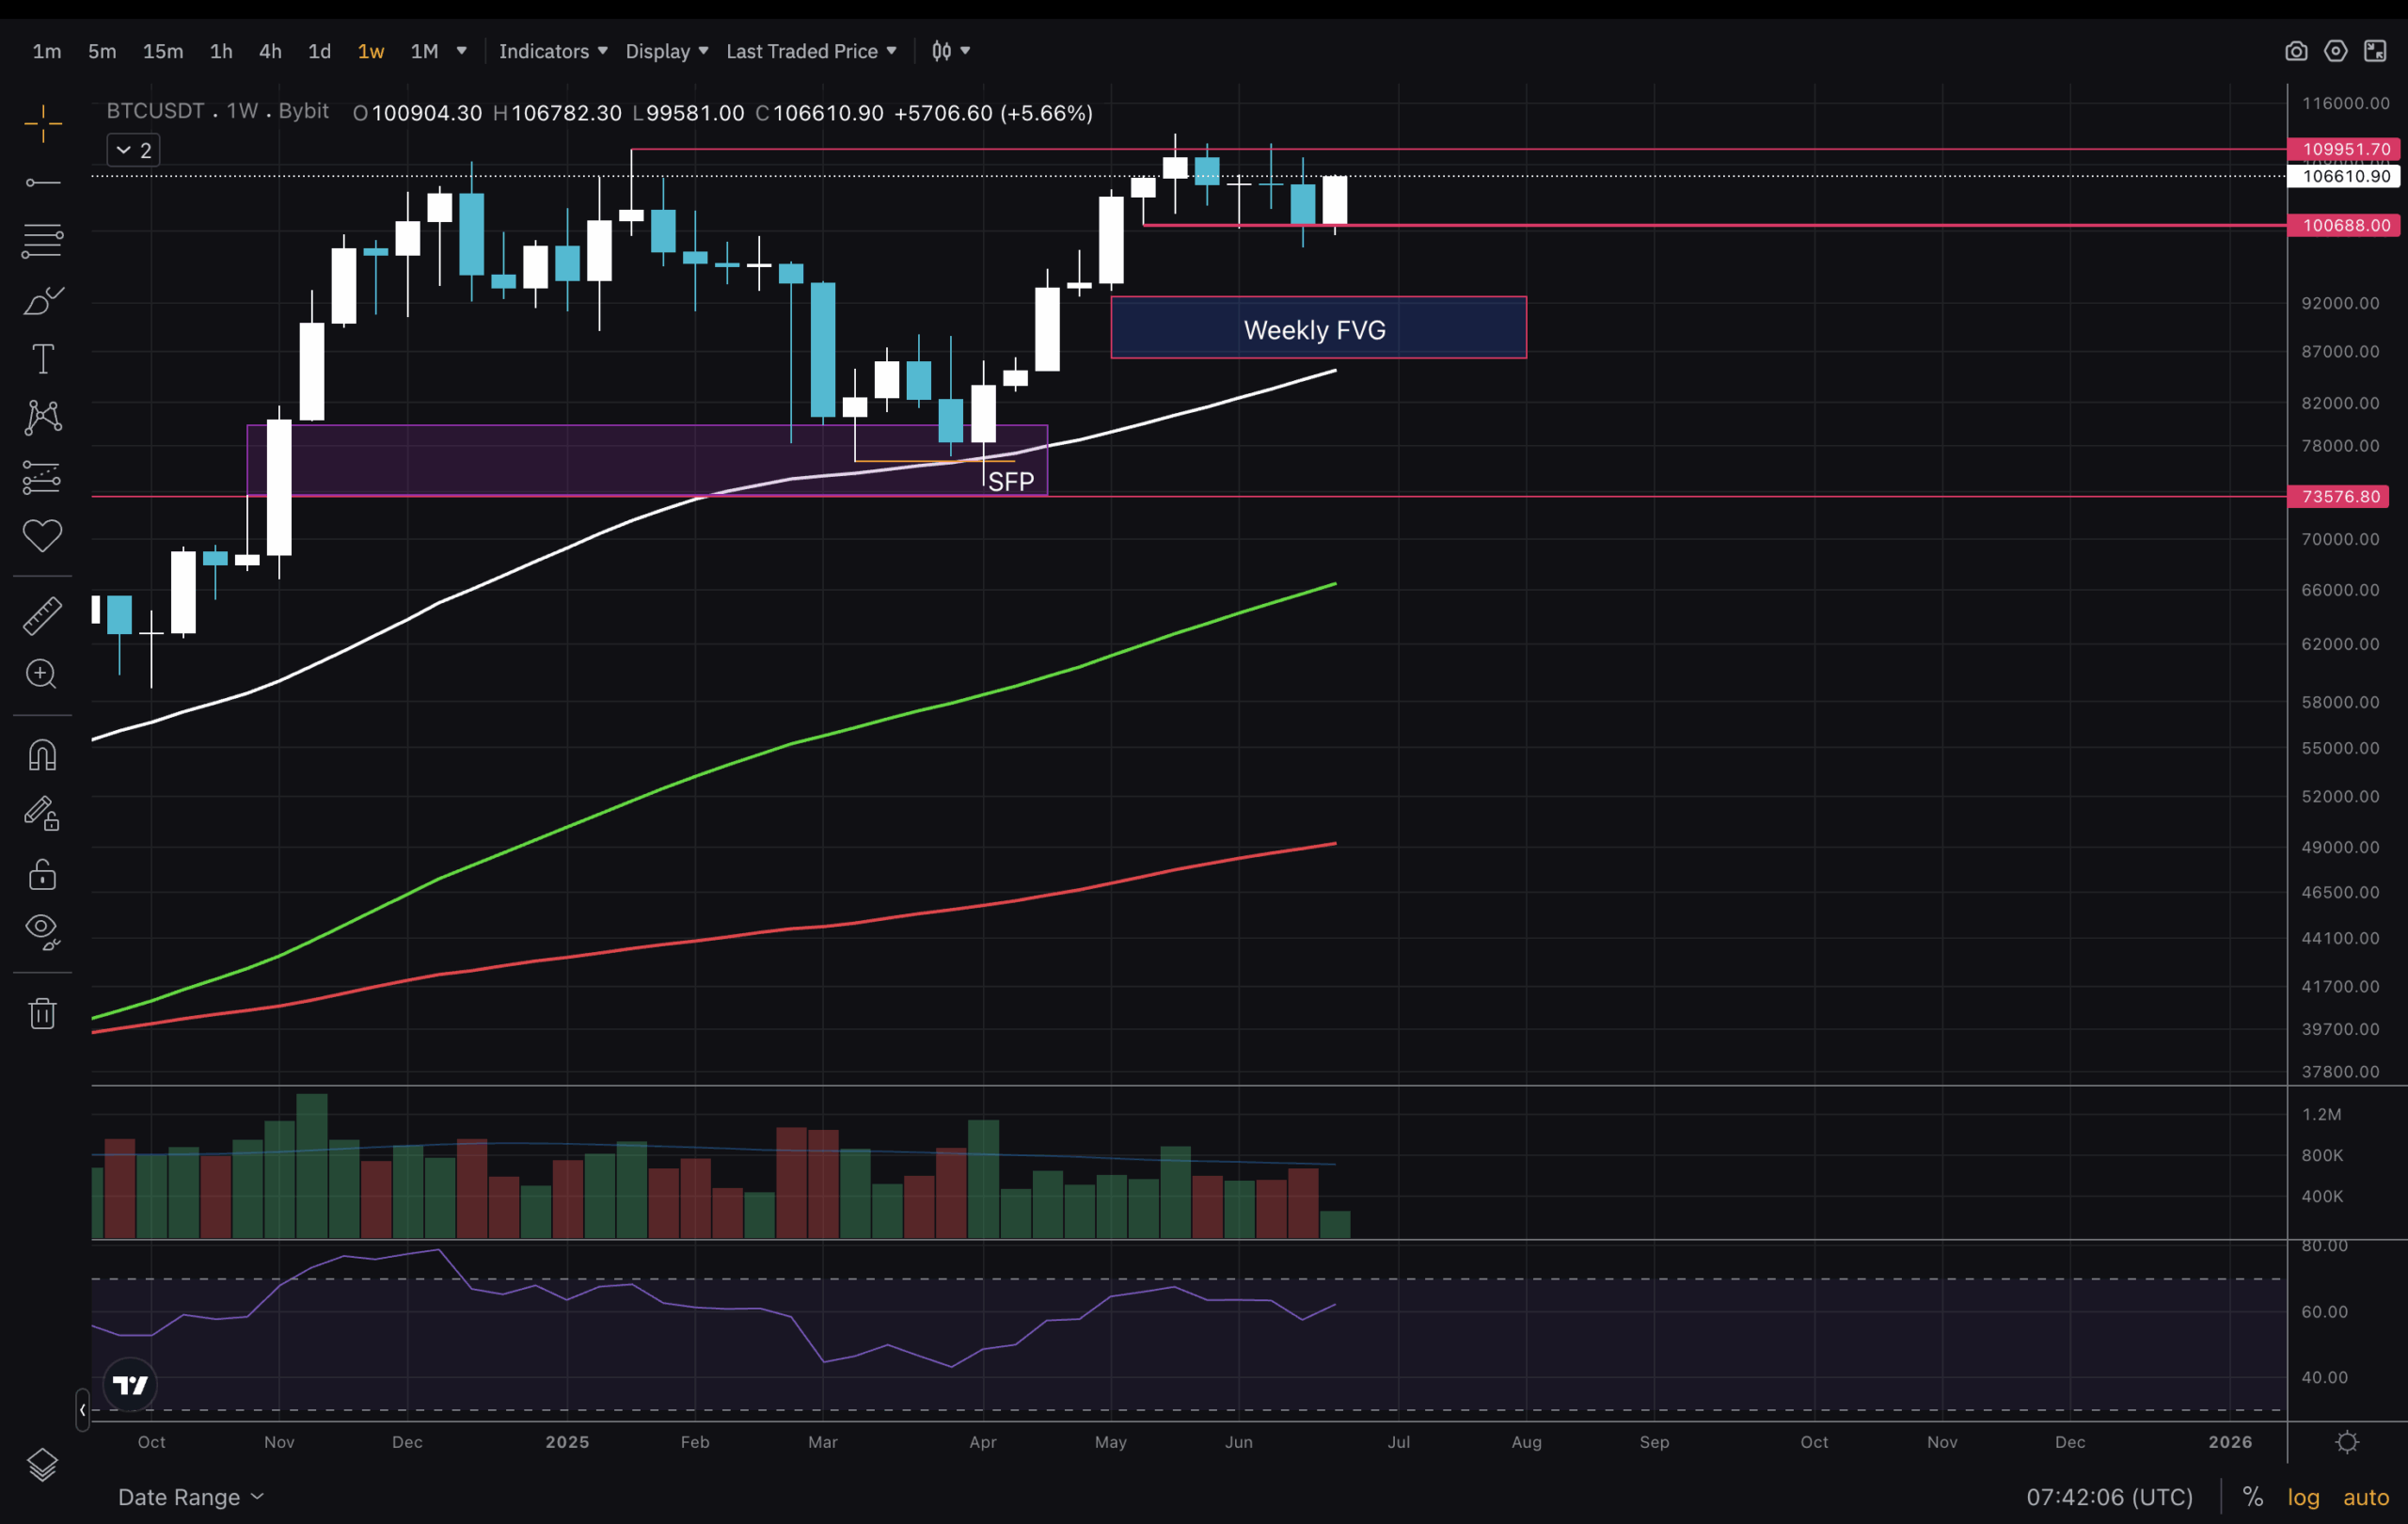
Bitcoin is still in an uptrend in the weekly timeframe. Above all, moving averages are making higher highs and lower lows. A key level that needs to be broken is at $110,000, which for now proves to be resistance. One possible scenario investors WOULD not like is the so-called double top. The FVG gap here is still not filled, though we are witnessing a strong bounce from support at $100,000.
BTC USD Forms a Bull Flag on The Daily Chart?
(BTCUSD)
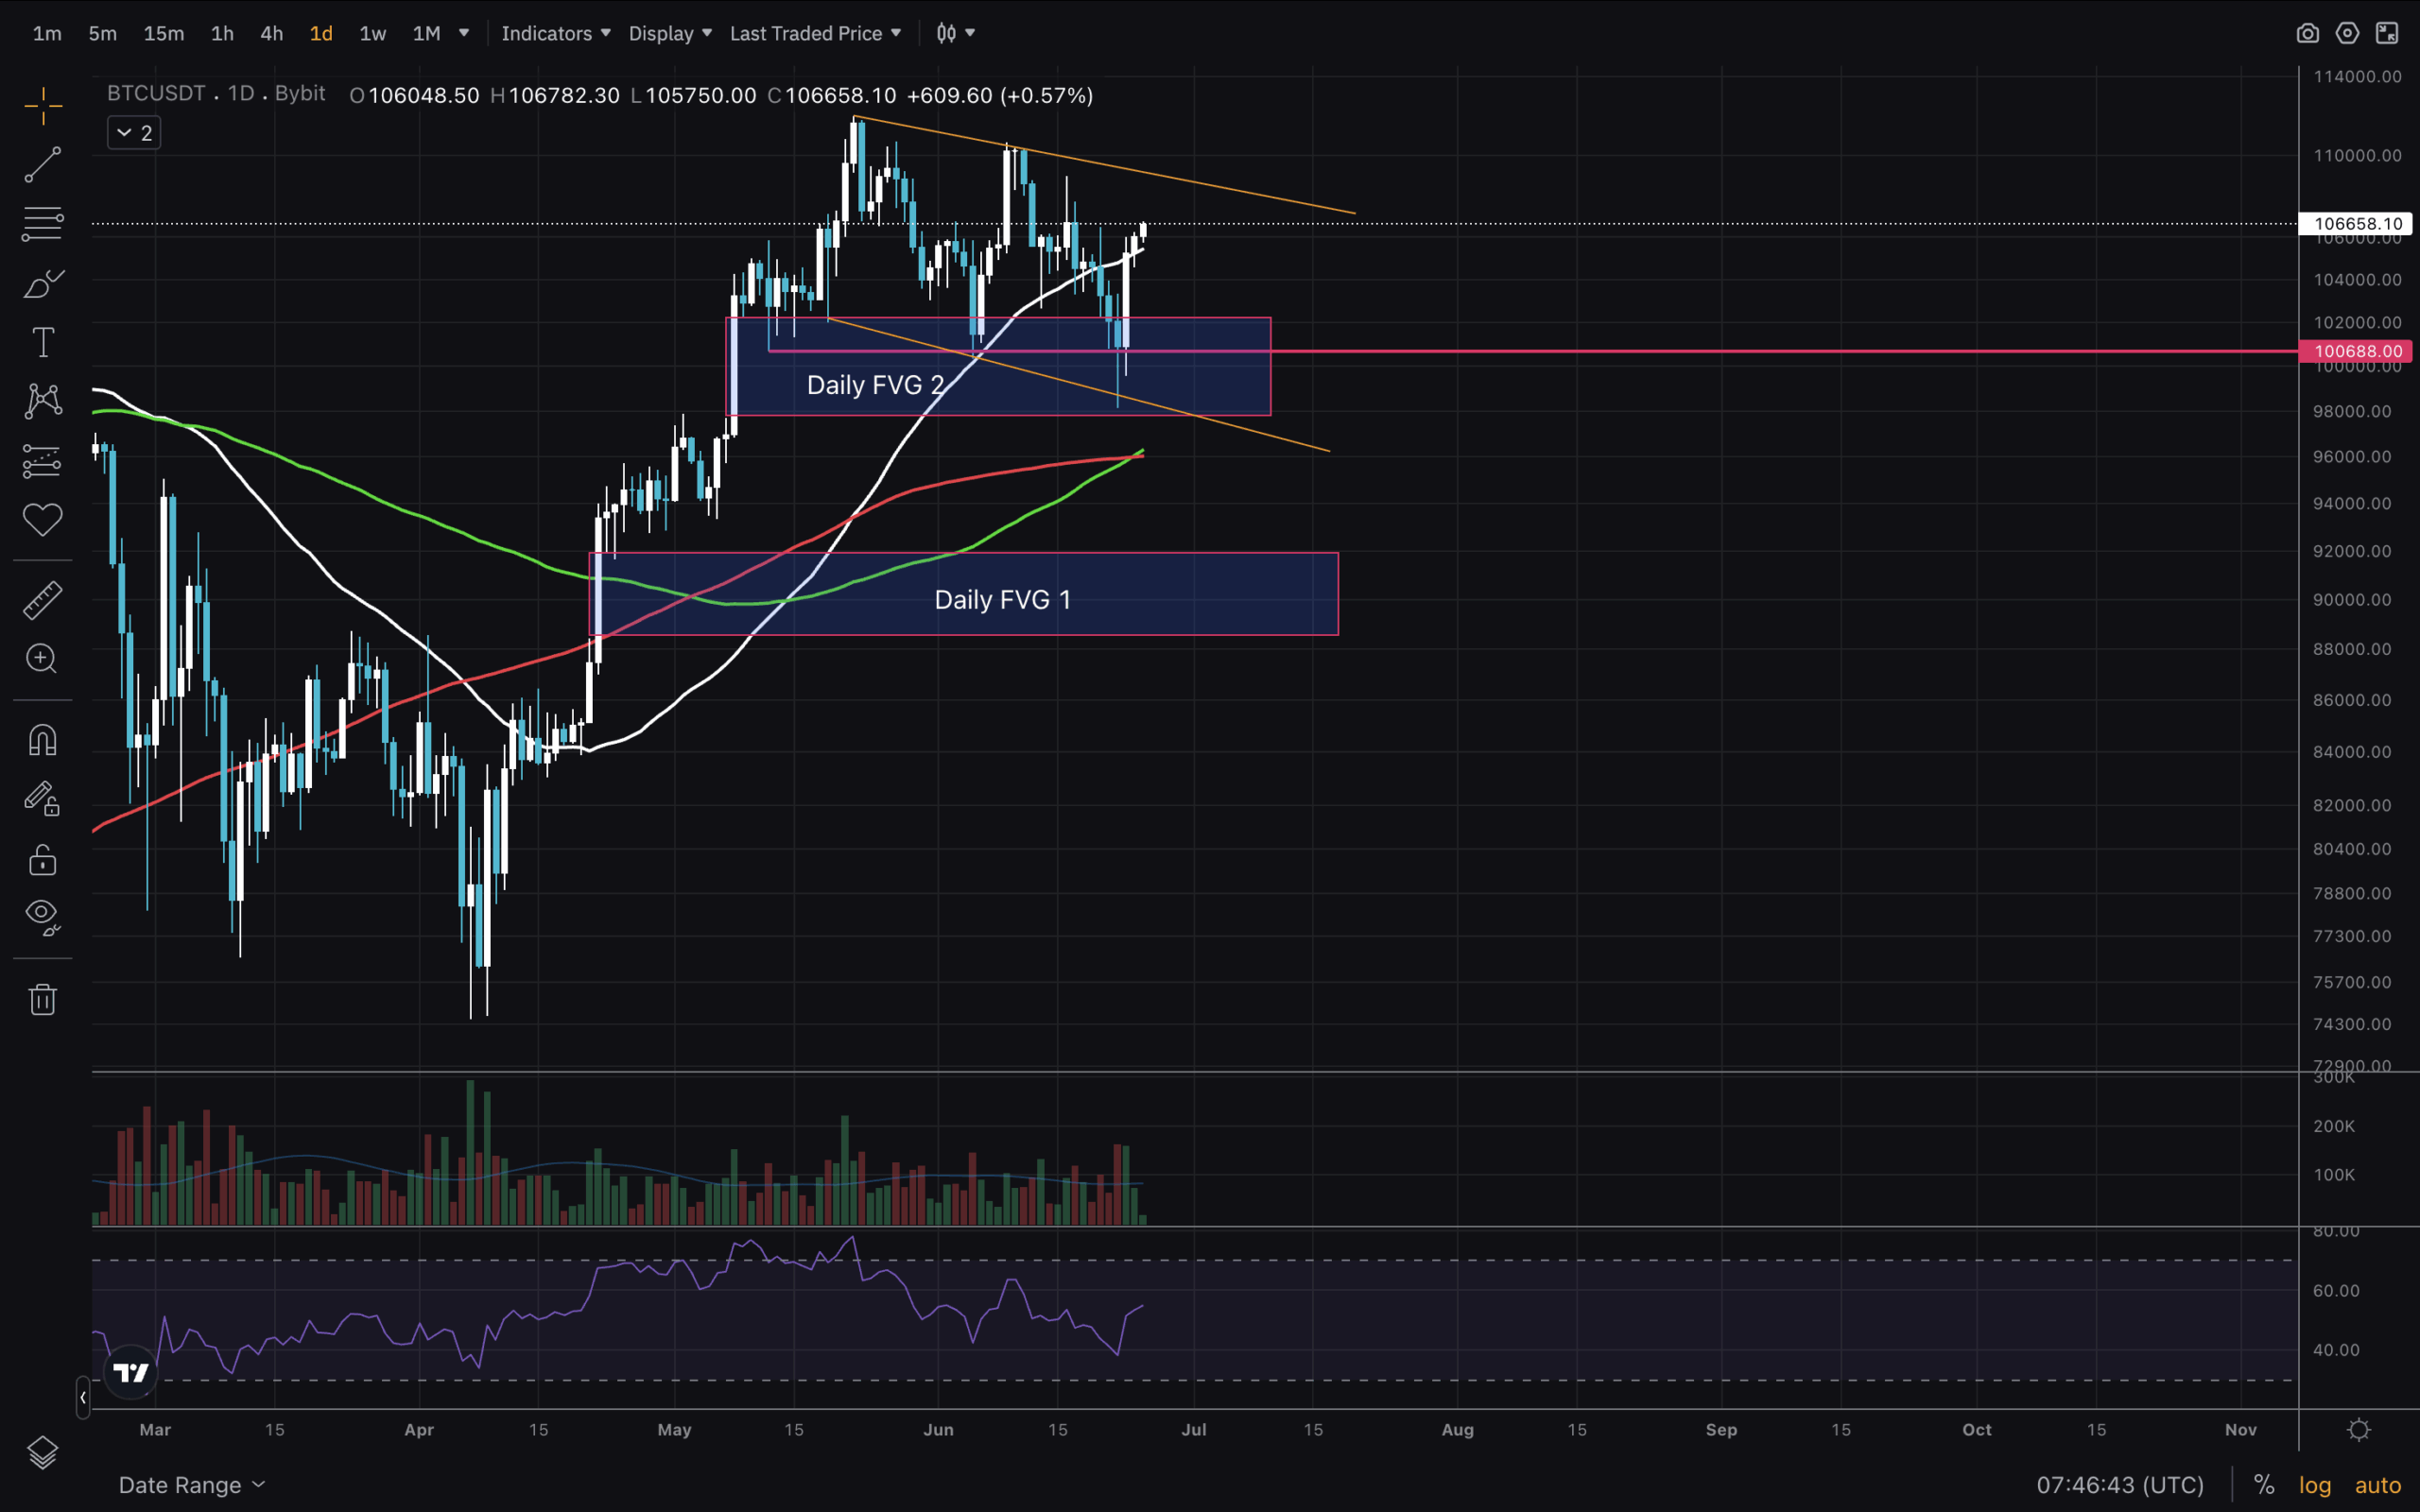
Next in line is the Daily timeframe. Here we see two FVG gaps. The upper one has been visited multiple times, but FVG1 is still filled. Will it happen? We will see later, so keeping it as a plausible scenario is good.
However, it being below the moving averages, which is the price reclaimed in April, makes it unlikely. Another pattern I see here is a bull flag, which I indicated with orange lines. In uptrends, these formations are usually bullish accumulations and break to the upside.
(BTCUSD)
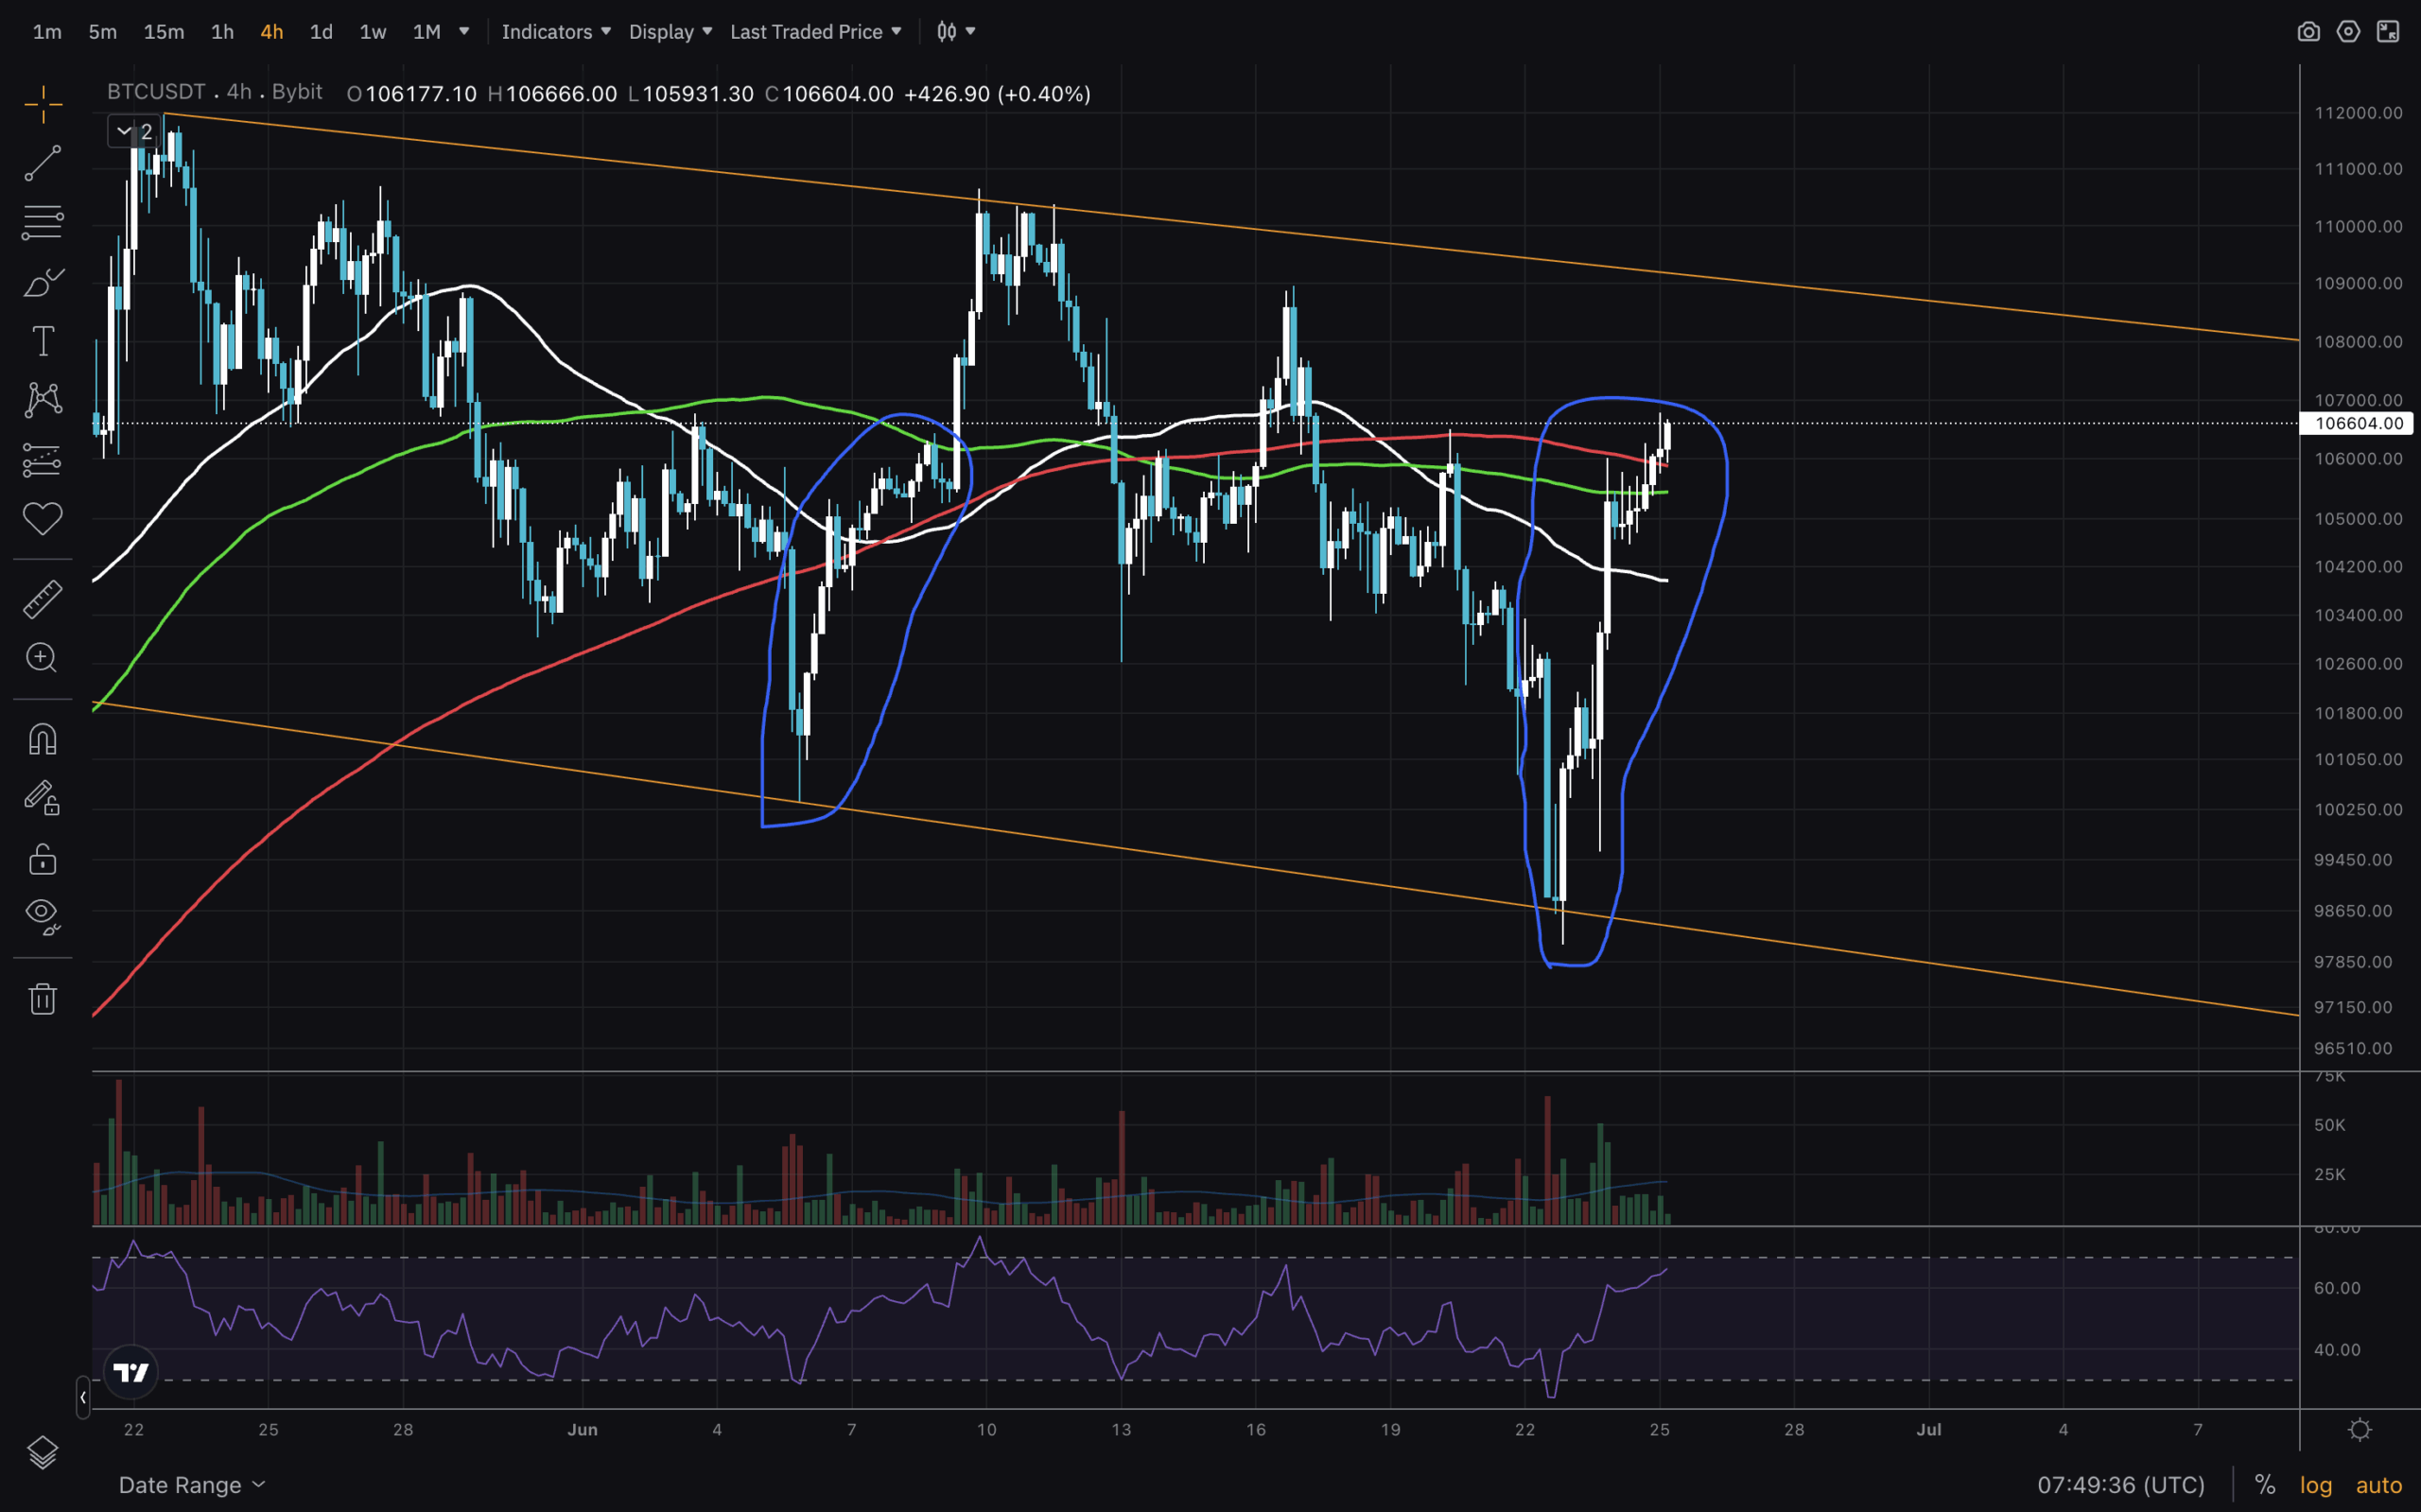
Let’s finish today’s analysis with the 4H chart. The two main parts of this chart we pay attention to are the second break above MA200, which led to a quick leg up. Now, we might see this repeated. The second bit is that price has moved above the previous high (test of MA200 before the drop to $98,000). I expect $108,000 to be tested again soon, and I’ll be watching how traders respond.
Join The 99Bitcoins News Discord Here For The Latest Market Updates
Bitcoin Rush Of 21st Century: People Scrambling For Leftovers
- FVG 2 demand should be low now
- Weekly FVG might not be tested, though we keep it as plausible
- Price is forming a bull flag.
- MA200 on 4H reclaimed

Log in to Reply
Log in to comment your thoughtsComments
Related Articles
|Square
Get the BTCC app to start your crypto journey
Get started today Scan to join our 100M+ users