Solana Braces for June Fireworks: Breaking Down SOL’s High-Stakes Price Surge

Solana's SOL is charging into June like a bull at a rodeo—volatility guaranteed. The high-speed blockchain’s native token has traders glued to their screens, anticipating wild swings as market forces collide.
Buckle up for the SOL coaster
With institutional interest heating up and retail FOMO creeping back, SOL’s price action could make or break portfolios this month. The token’s 90-day chart already looks like an EKG reading—just how Wall Street likes it.
Technical indicators scream 'high-risk, high-reward'
Solana’s proving it can hang with the big boys, though Ethereum maximalists will never admit it. Meanwhile, hedge funds are quietly accumulating—because nothing says 'trust the tech' like leveraged bets during a liquidity crunch.
One thing’s certain: in crypto’s casino economy, SOL remains the table with the highest minimums... and the drunkest whales.
Zooming Out on SOL USD: Solana Price in the Long Time Frame
We’ve got three charts to look at – brace yourself!
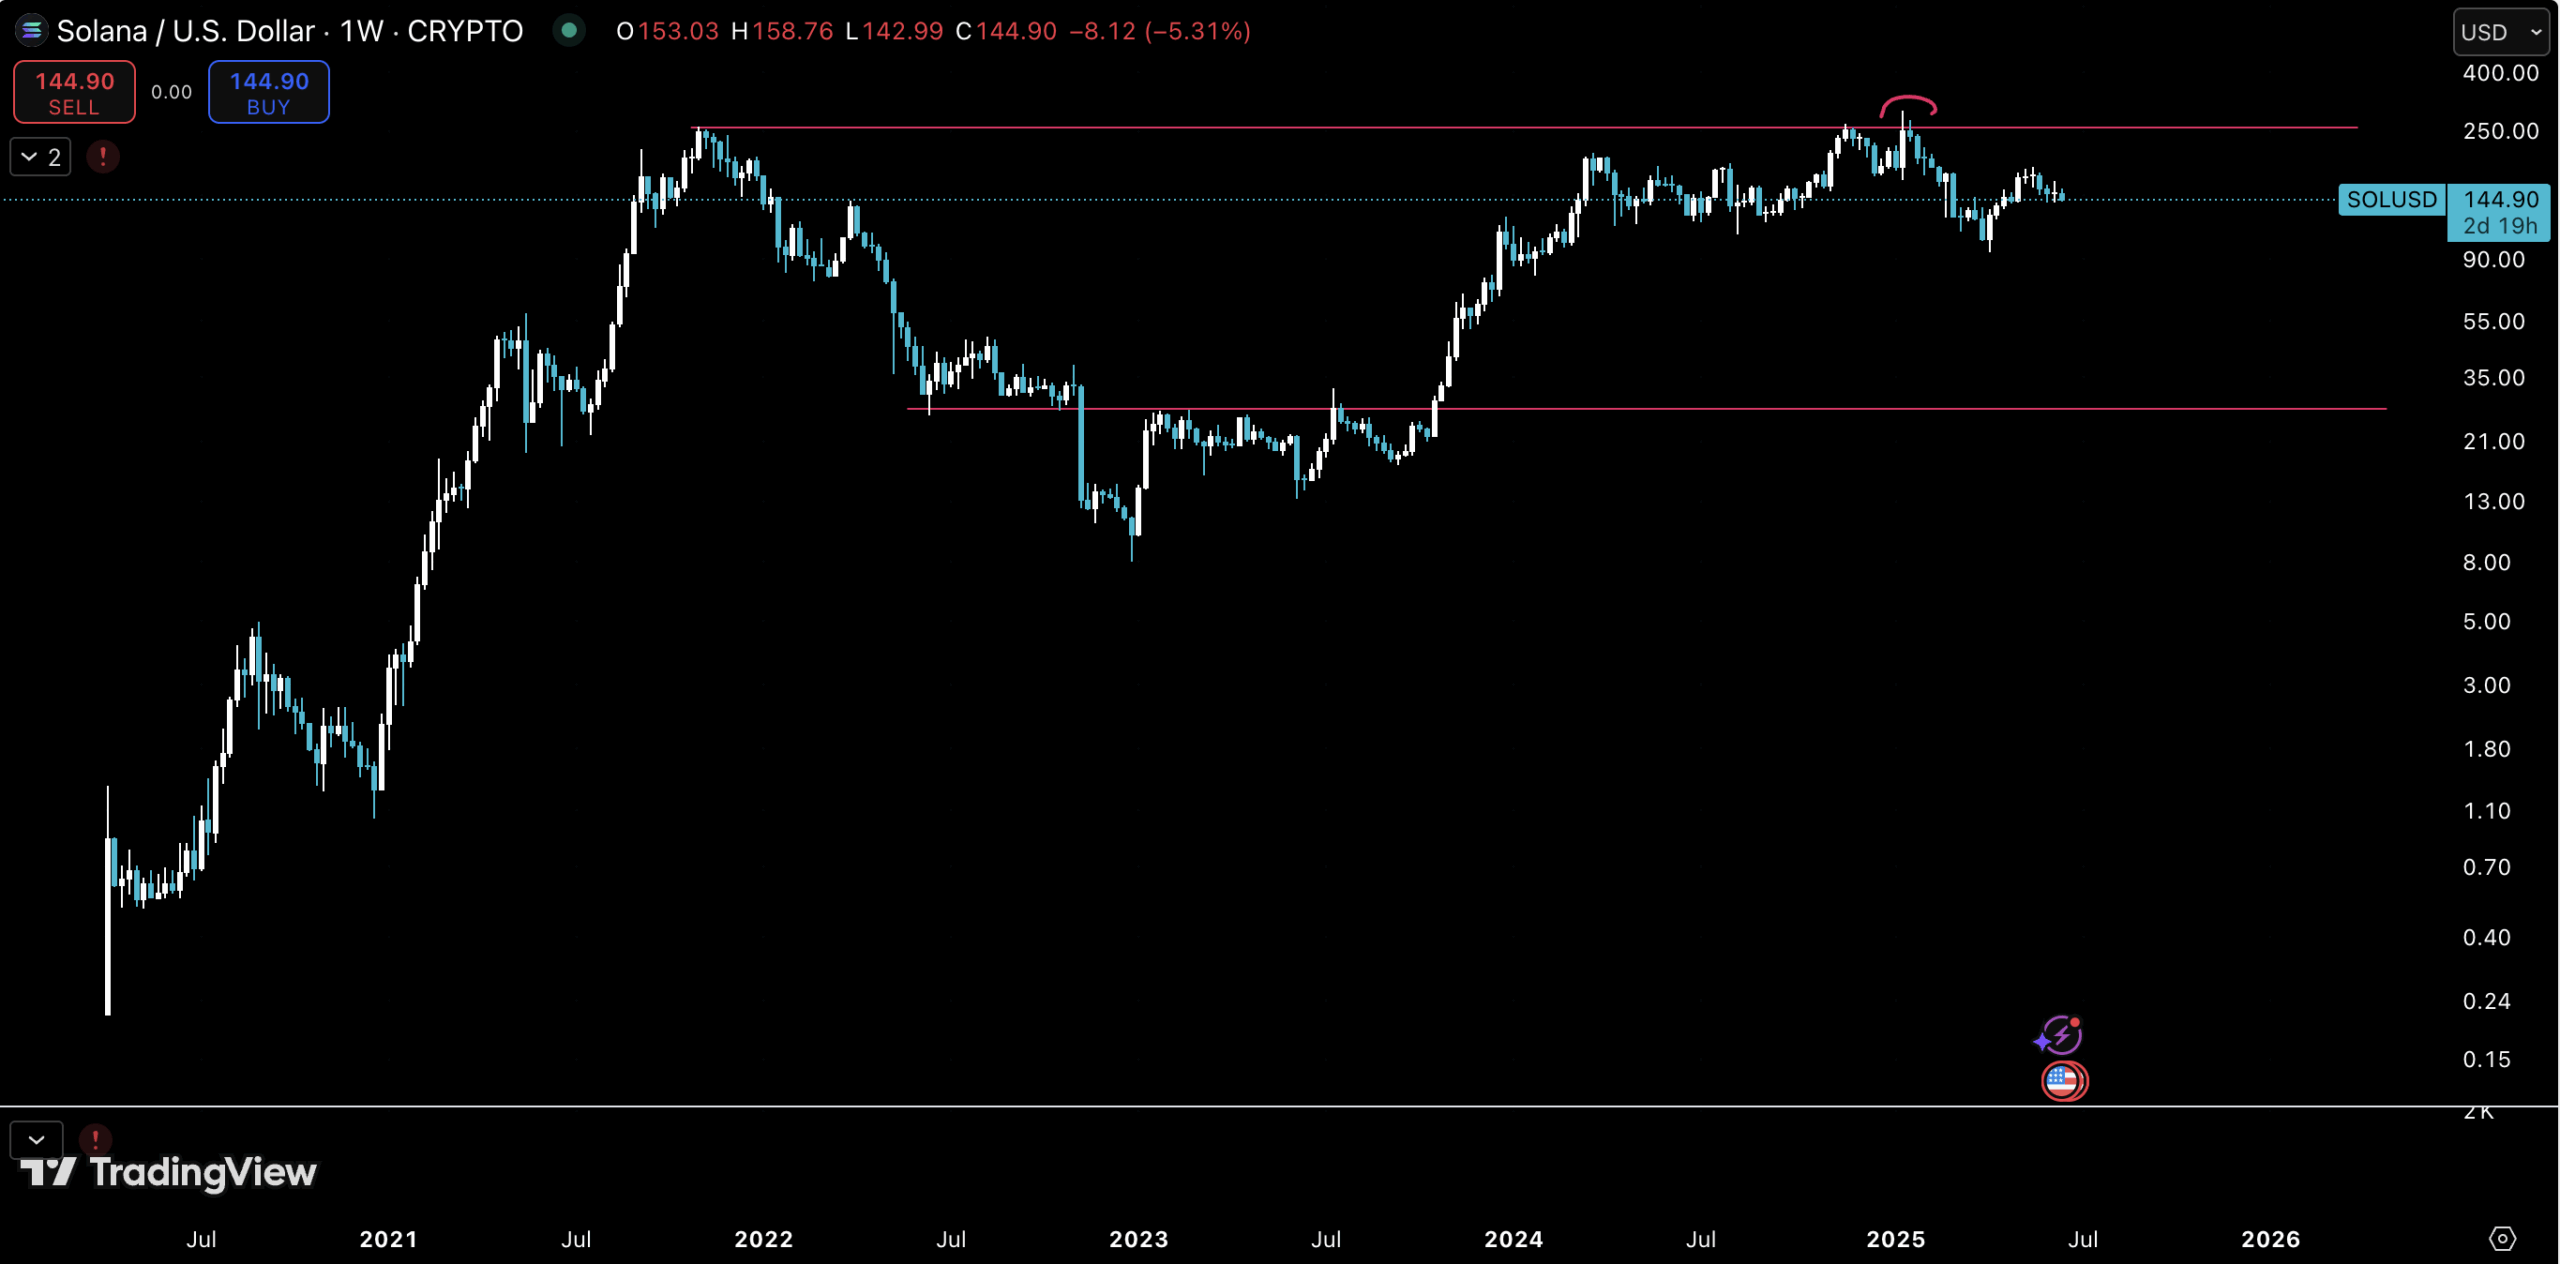
(SOLUSD)
The first chart we will start our analysis on is the long-term Weekly timeframe, specifically looking at the bigger range. Solana’s price reached the 2021 bull run top at the end of 2025, which is our current resistance. In other words, it is the top of the range.
The bottom of the range might look very far down at $27. It’s good to remember that SOL spent almost a full year trading under $10 in its early days.
Zooming In on Solana Price Action: Where Does SOL Go From Here?
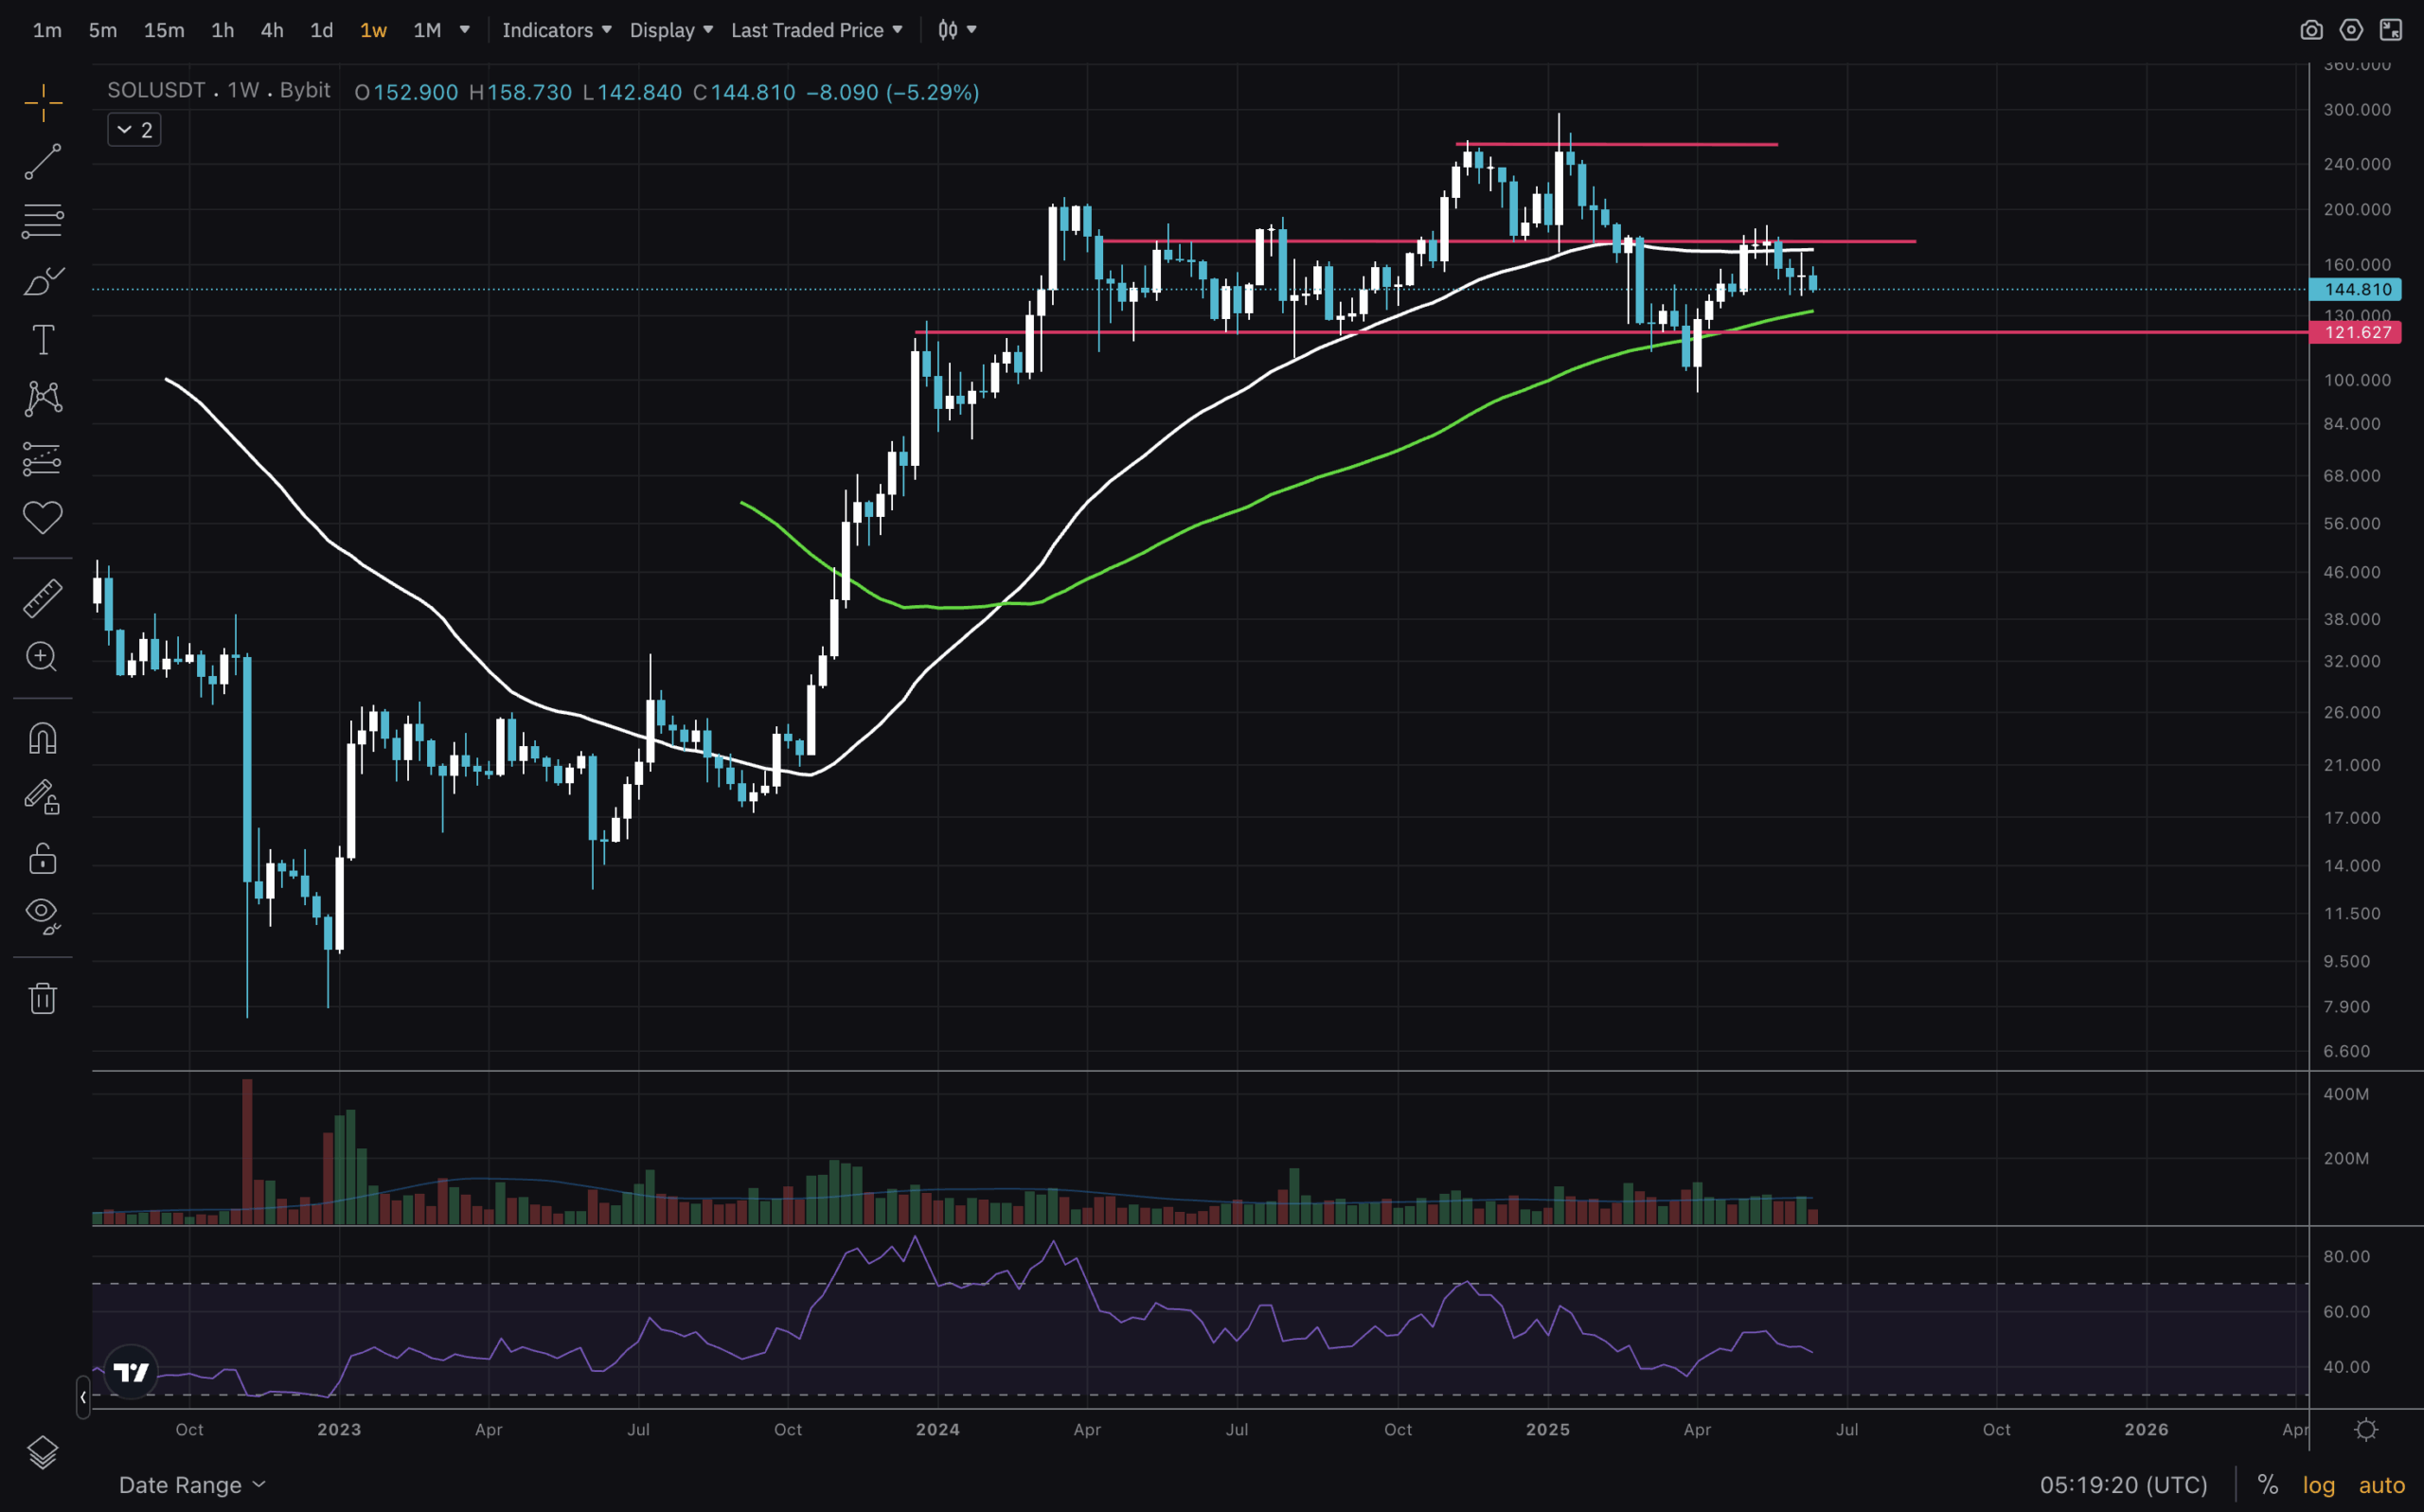
(SOLUSD)
Another quick look at the 1W timeframe, and then we’ll MOVE on. The latest run’s current bottom range and support cost ~$120. However, the price exceeded the MA50 and was rejected when retested as resistance. Soon, MA100 could be reached – good to watch the reaction. Lose the $120 level, and we might drop below $100.
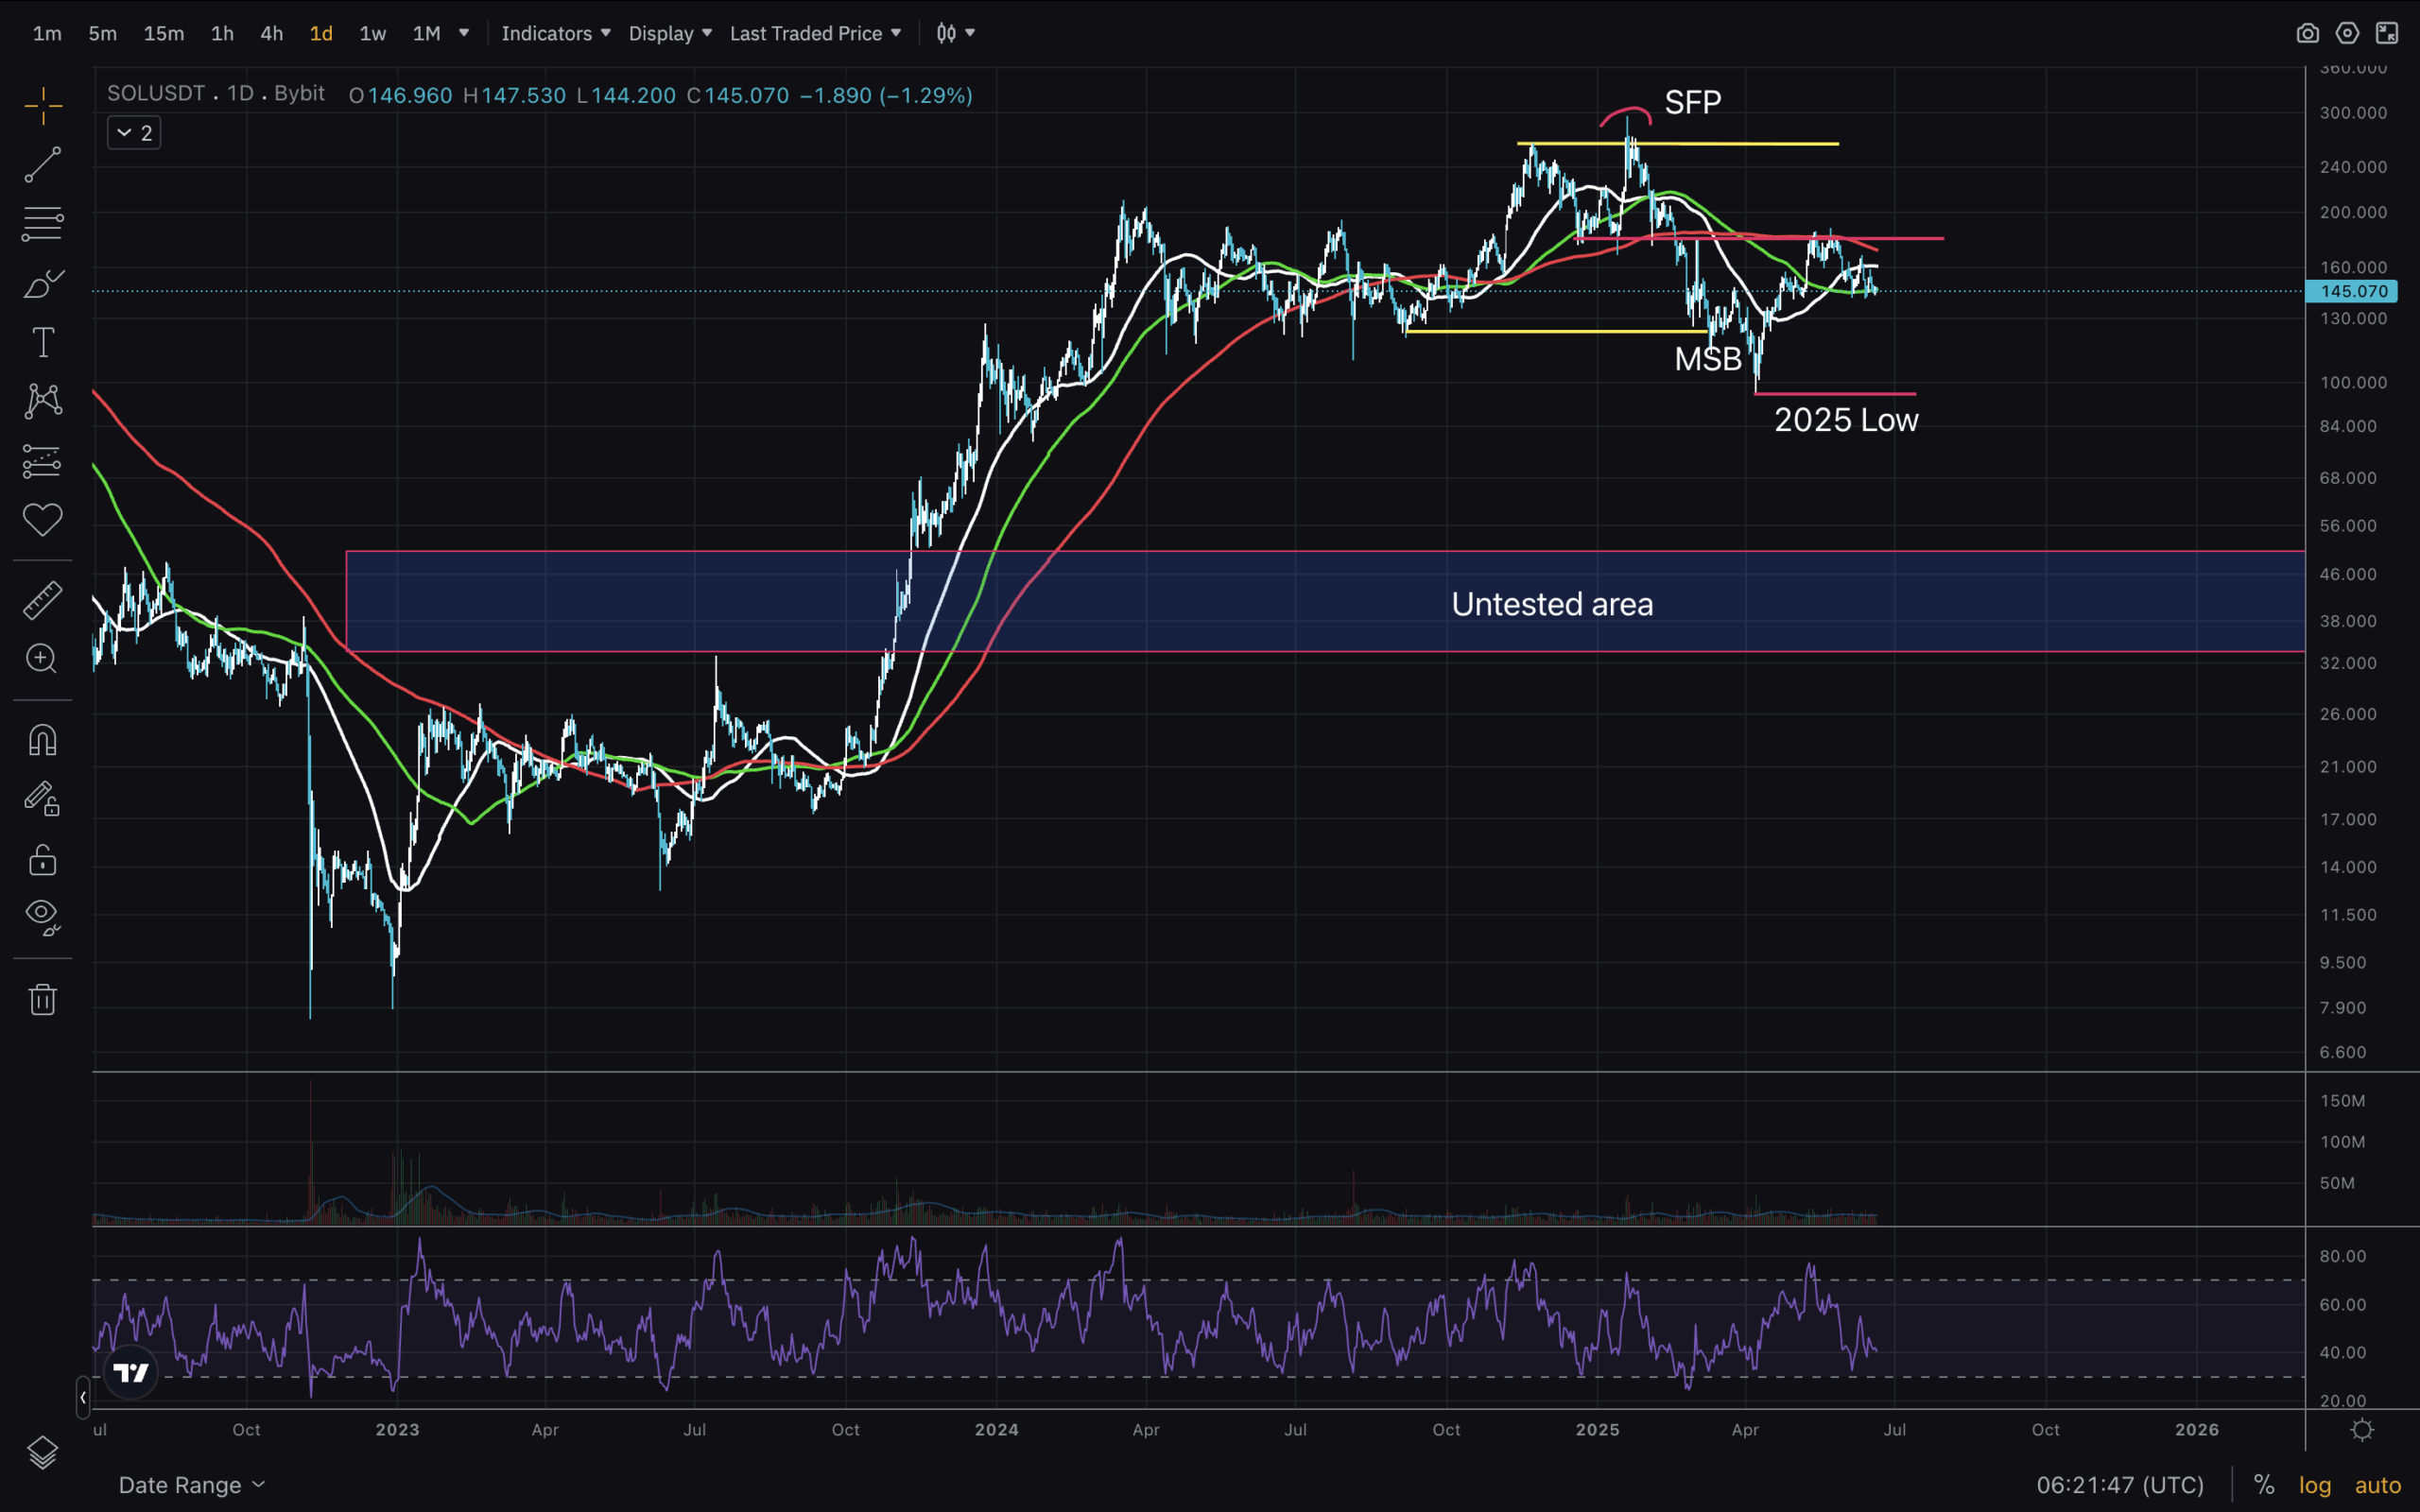
(SOLUSD)
Zooming in on the 1D day, we can now see more details. A large untested area ranges from $32 to $50, though it can be extended to $100. We see a clear SFP, break of market structure, and retest of MA200, which was also the previous low, now acting as resistance. Quite the dynamic chart.
For me, it looks like SOL USD is heading lower, unless MA200 is reclaimed. As Matthew said in his X post, the market can move both ways, and it’s good to be ready for either of the two scenarios.
Join The 99Bitcoins News Discord Here For The Latest Market Updates
Solana Wild Ride: Unpacking The Latest Price Action
- Late 2023 and 2024 SOL saw huge gains.
- Untested price are starting beneath $100
- Price needs to reclaim MA200 on 1D for next leg higher
